Week 2 - Flow over a Cylinder.
AIM-- To simulate the flow over cyllinder and explain phenomenon of karman vortex.
OBEJCTIVE:
(1) SImulate flow with steady and transient and calculate the strouhal number for Re=100.
(2) To simulate & calculate the coefficient of drag and lift over a cylinder by settiing the reynolds number to 10,100,1000,10000,100000.
THEORY:
1. Flow over cylinder
The flow around the cylinderical is one of main case study in CFD or fluid mechanics.Cross flow normal to the axis of cylinder is provided in domain where the impact of fluid flow over the cylinderical walls are studied and conncepts like Reynolds number and after effect the Von karman bortex street theories comes to play . As we will observe the physics of flow is more complex than what relatively simple shape might suggest.
2. Vortex shedding
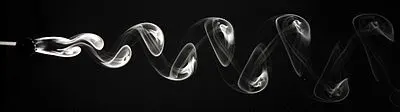
It is an oscillating flow that takes place when a fluid such as air or water flow past a bluff body at certain velocities , depending on the shape and size of the body. In this flow the vortices are created at the back of body and for certain fraction of time it detach itself from body forming Von karman vortex street. The fluid flow past the object creates alternating low pressure vortices on the downstream of the object. This will tend to move toward low - pressure zone.
If the structure is not mounted rigidly and the frequency of vortex shedding matches the resonance frequency of structure it can cause resonance means the object will start to vibrate. It Signifies its Role in many aspects of our life like Wind resistence towards car body , high wind at chimneys or other antenas structure . Its study is important as we need to make sure to reduces drag and lift force but also need to find a way for no resonance occuring situations.So the accidental failure can be prevented.
3. Strouhal Number
It is a dimensionless number describing oscillations flow mechanisms.
It is often given as
`S_t=(fD)/U^'`
where,
f= frequency of vortex shedding
D= characterstics diameter of cylinder
U'= Fluid flow velocity.
4. Reynolds number
It is a measure of the ratio of interial to viscous forces in the flow of a fluid around a body.
Re`Re = (rho*V*d)/dynamic viscosity
The range of Reynolds values will vary with size and shape of body from which eddies are shed.
But generaly
For Enclosed area Re = less than 2400 is caled LAMINAR FLOW and above 4000 is caled TURBULENT FLOW.
For open Surface area Re= less than `2*10^5` is LAMINAR FLOW and above `5*10^5` is TURBULENT FLOW
PROCEDURE
- Geometry
A plate with dimension of 20* 60 is created with 2mm cylinder wall at distance shown below.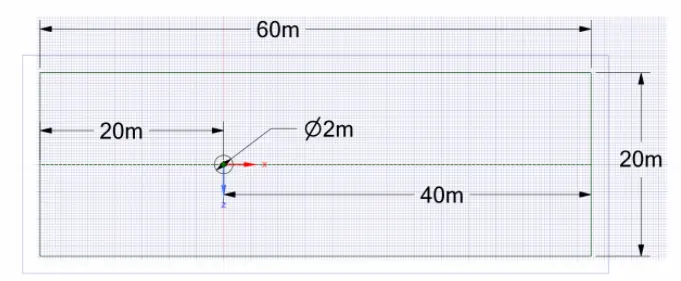
Now we want fluid flow over cylinder so selevt circle and delete it.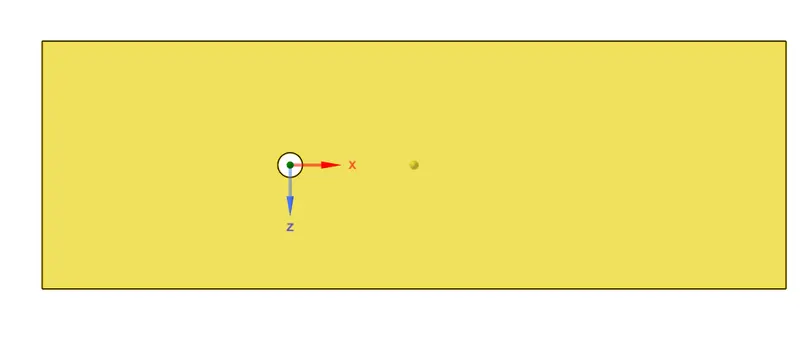
- Meshing
Select the edges of geometry and name them as inlet ,outlet, wall & symmetry.
Now we generate mesh of size 3mm.But to ensure the traingular mesh right click select method and select triangular option
Then we ge to mesh > sizing> select circular edge> defination> type> no of division =36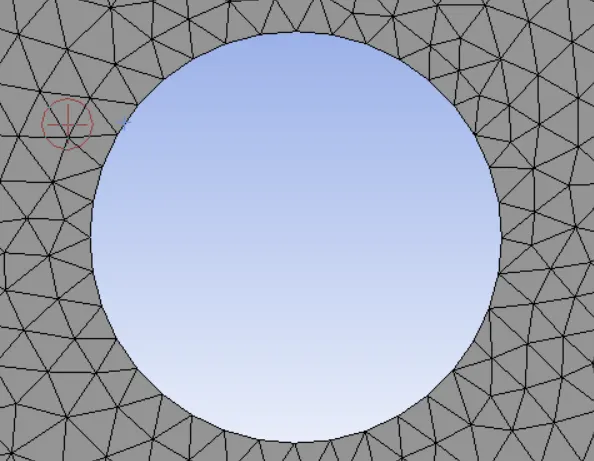
Then for better result at boundaries we use inflation by
go to mesh > inflation> select body and then edge> thickness> layers=7> ratio=1.2.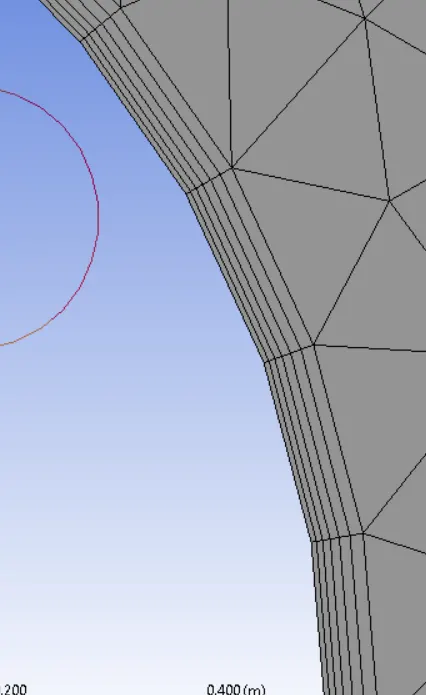
- SOLVE
Here we select laminar flow under physics and add material air of density 1kg/m^3 and viscosity of 0.05 kg/m-s .
Select method as SIMPLE.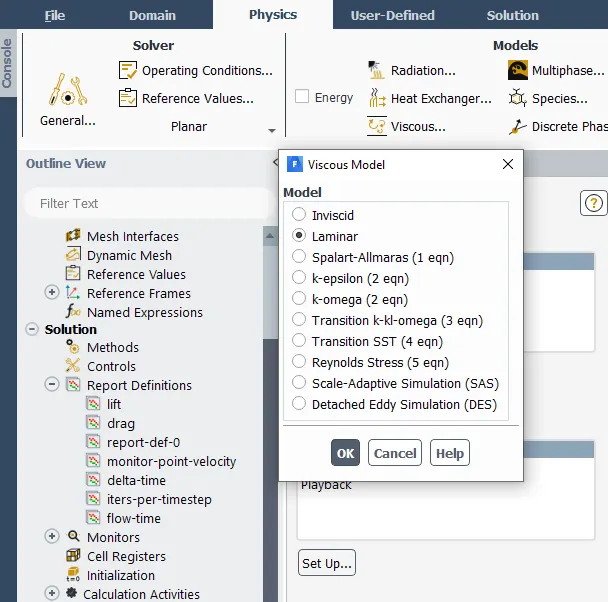
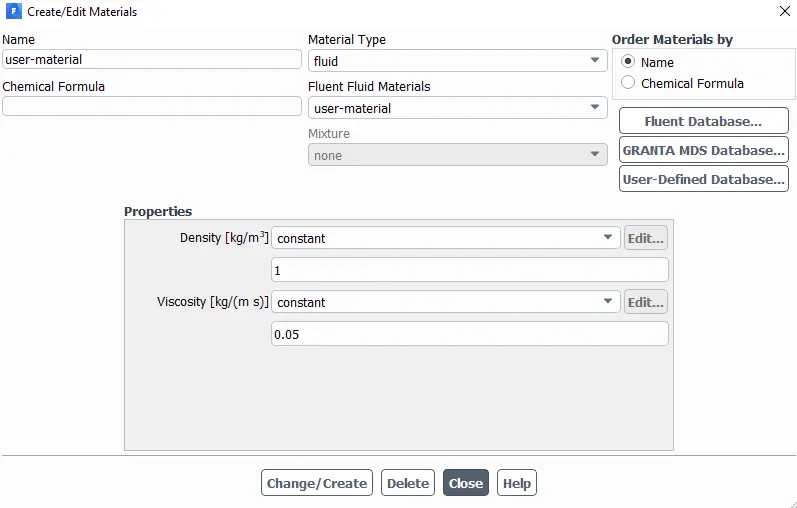
We can use reynolds formula for simulating for different reynlds value by changing velocities
Re= 10 velocity = 0.25m/s
Re= 100 velocity = 2.5m/s
Re=1000 velocity = 25m/s
Re=10000 velocity = 250m/s
Re=100000 velocity = 2500m/s
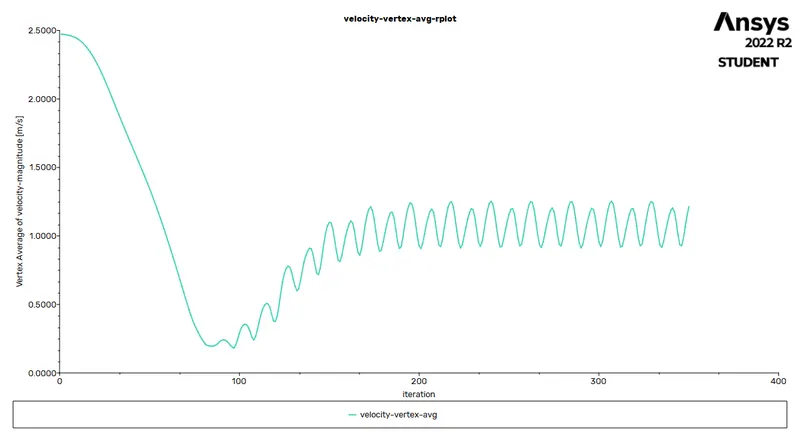
We create monitoring point from cylinder wall at 8m by inserting point commnd so we can observe details at vortex area.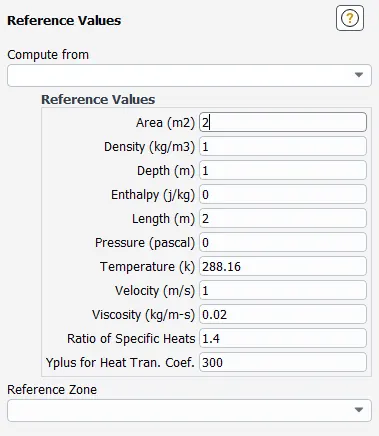
Then we need 3 report for drag coefficient ,Lift coefficient and avg. vertex velocity we create that and initialize the solution but before we save frames so we can create animation in result.
then we run for iterations 350 in this case.
RESULTS PART -I( STROUHAL NO. FOR STEADY AND TRANSIENT FOR RE=100)
viscosity= 0.05kg/m-s
density = 1kg/m^3
Steady state
Residual plot 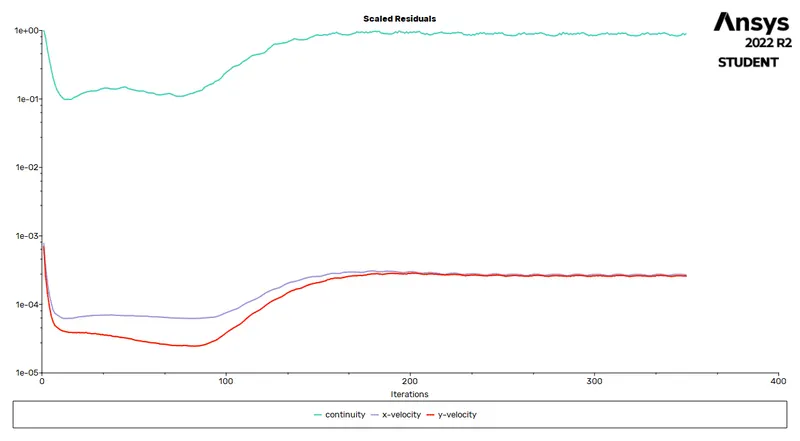
Lift coefficient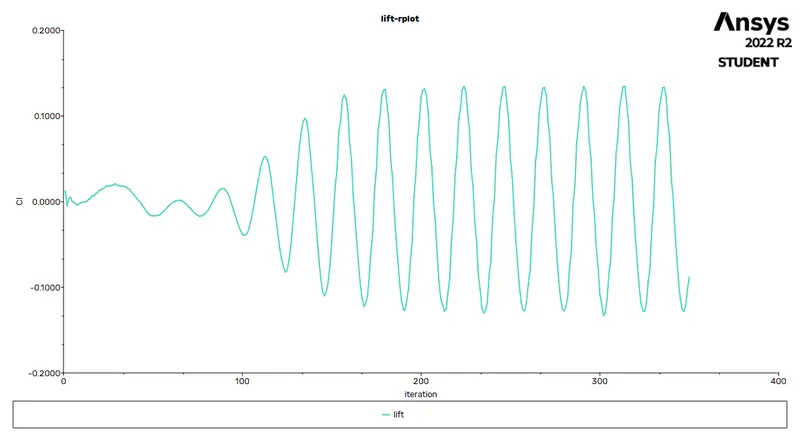
Drag coefficient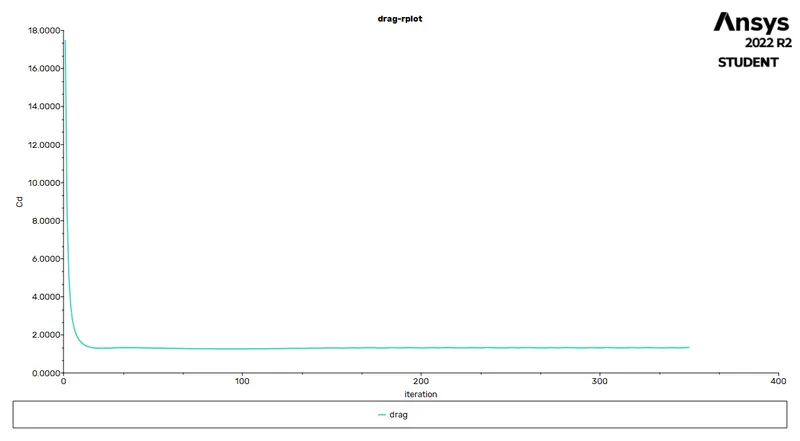
Monitor velocity point
Velocity contour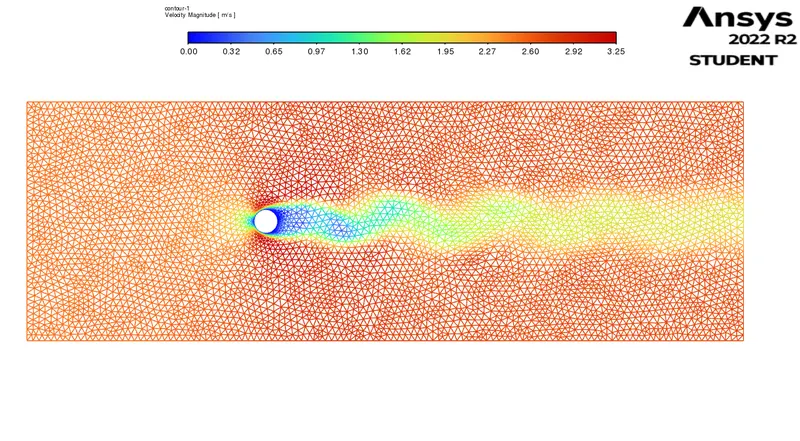
Pressure contour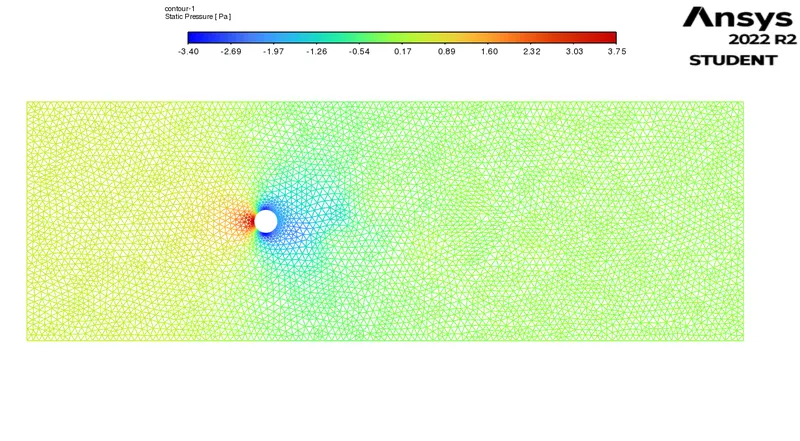
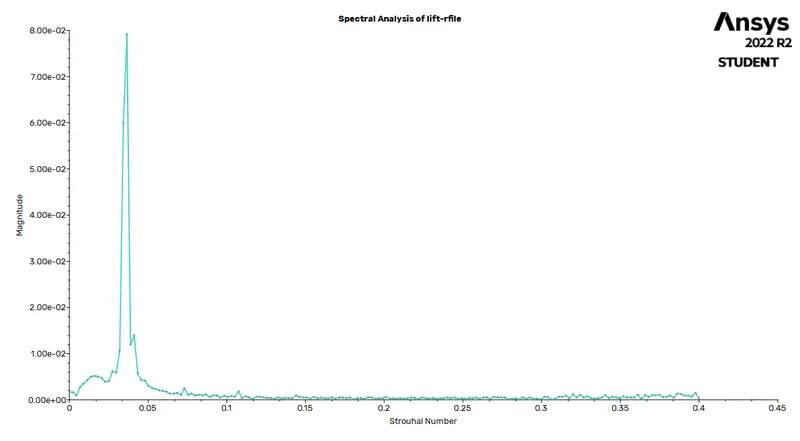
strauhal number
Transient state
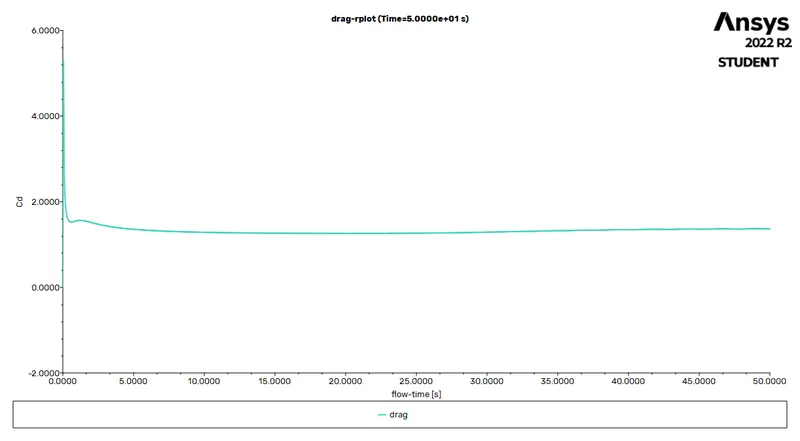
Its different from steady state as it is time depedent solver the difference in time steps and no of timesteps are mentions to calculate for vertains steps its is more detail oriented solution but efficiency is not more suprior in prior to steady state as we will observe the data is almost same .
Residuals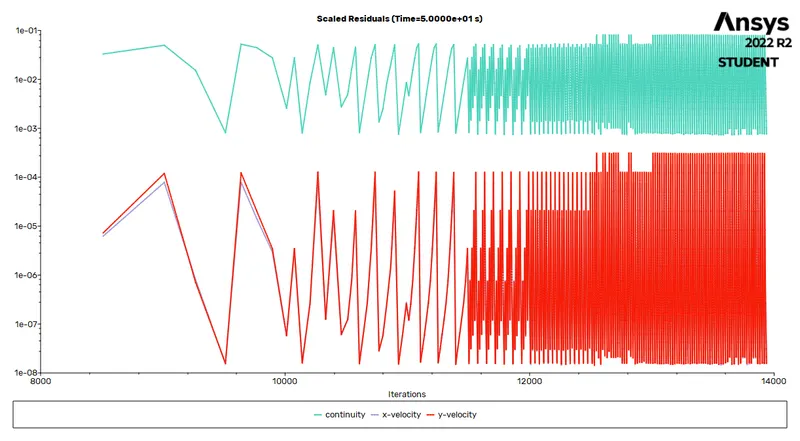
Lift coefficient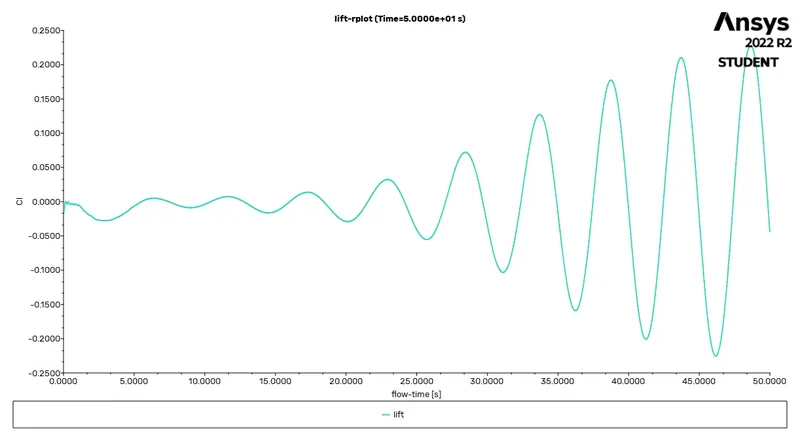
Drag coefficient
monitor point velocity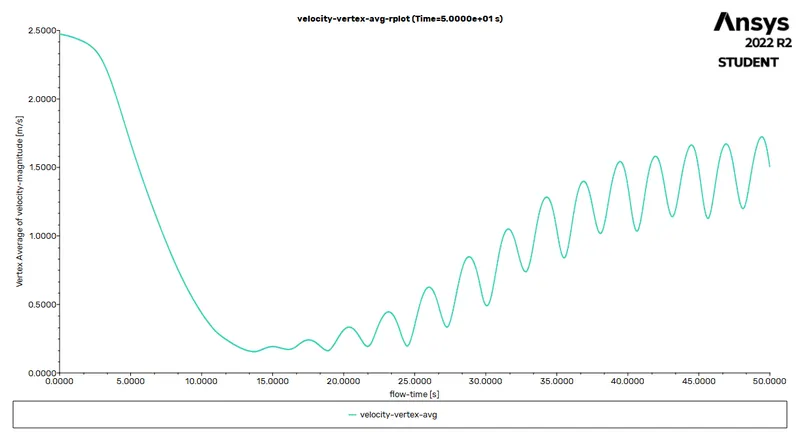
velocity contour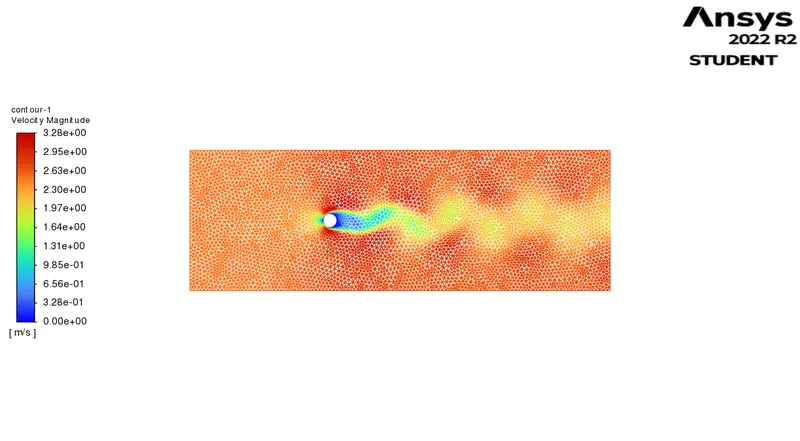
Pressure contour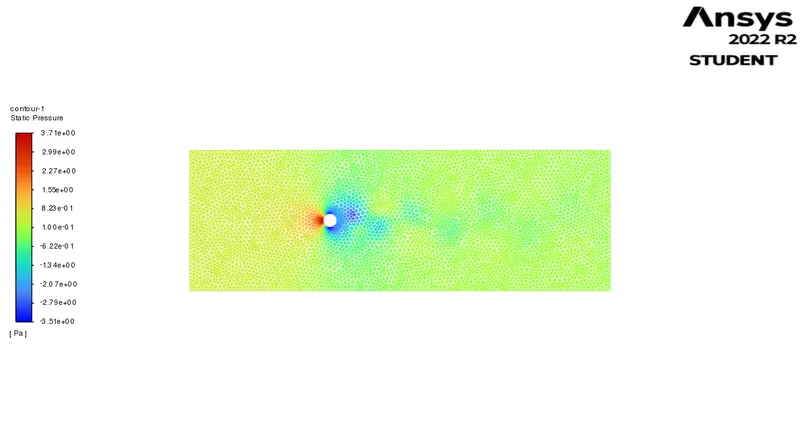
Strouhal 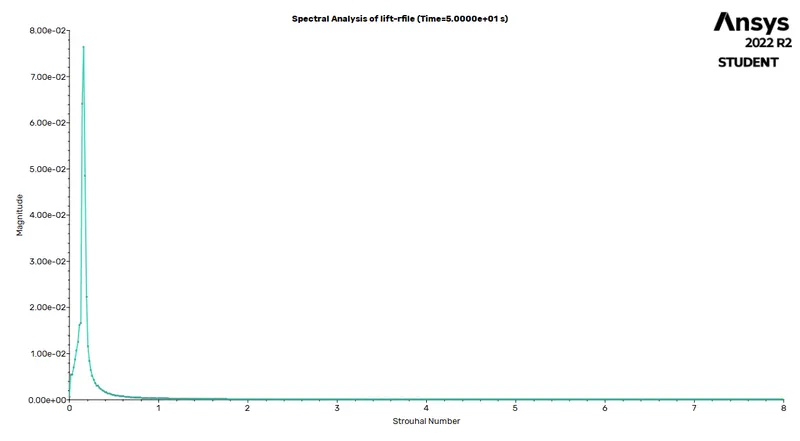
A we can see the values will not be different for both transient and steady case the strouhal no value is almost same 0.08 ( steady state ) & 0.076 for ( transient state).
As for drag coefficient its 1.33 (steady state) and 1.38 for (transient state)
AS for Lift coefficient its -0.08 ( steady state) and -0.076 for (transient state)
RESULTS PART-II( solutions for Re= 10,100,1000,10000,100000)
1. Re= 10 , Velocity= 0.25m/s
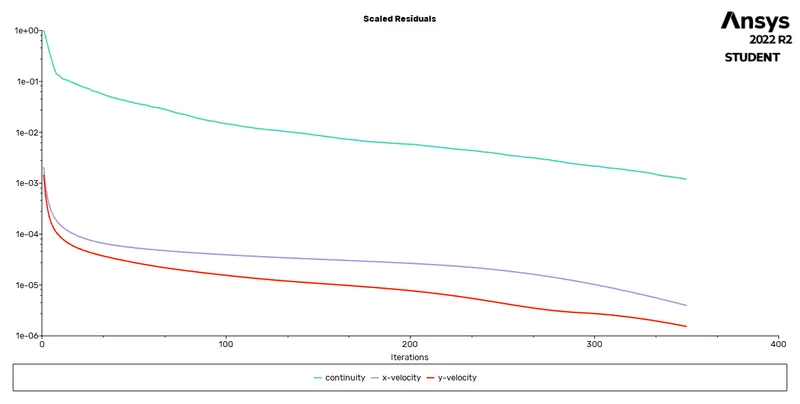
Residual
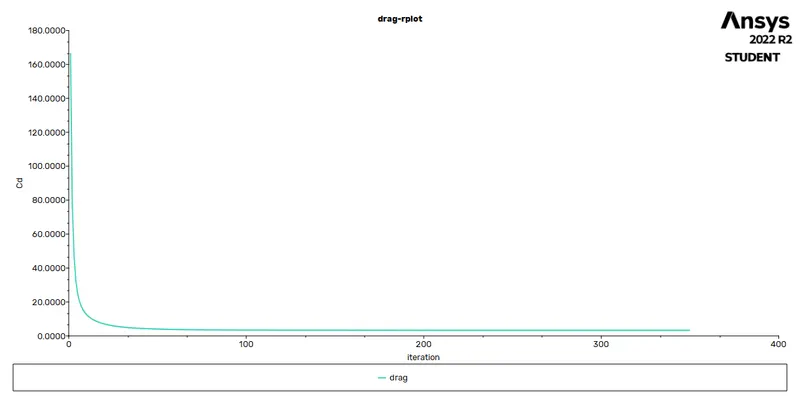
Drag coefficient
Lift coefficient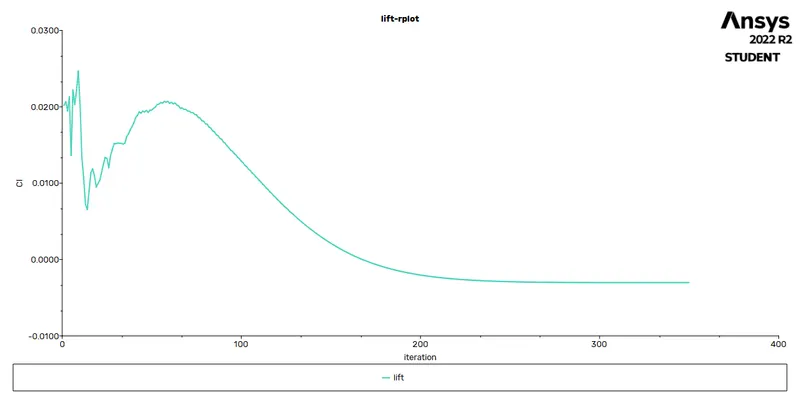
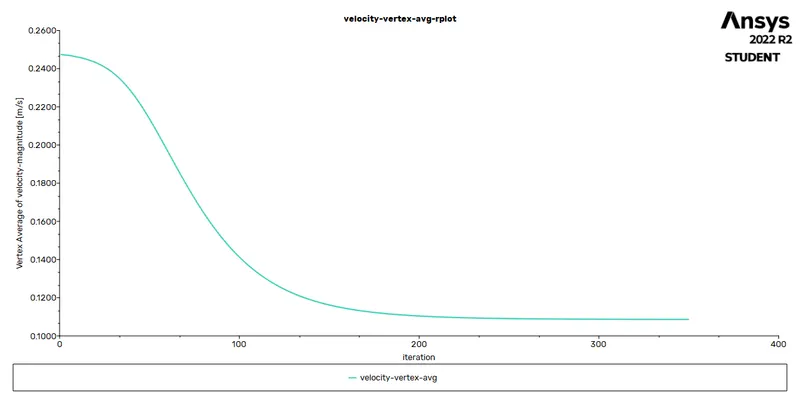
Monitoring point velocity
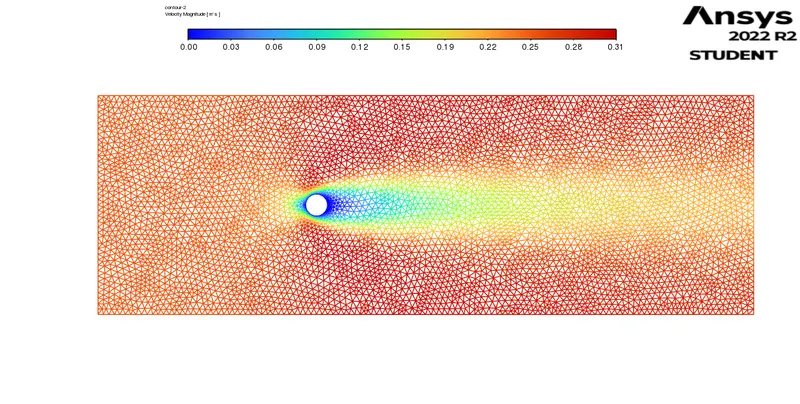
Velocity contour
Pressure contour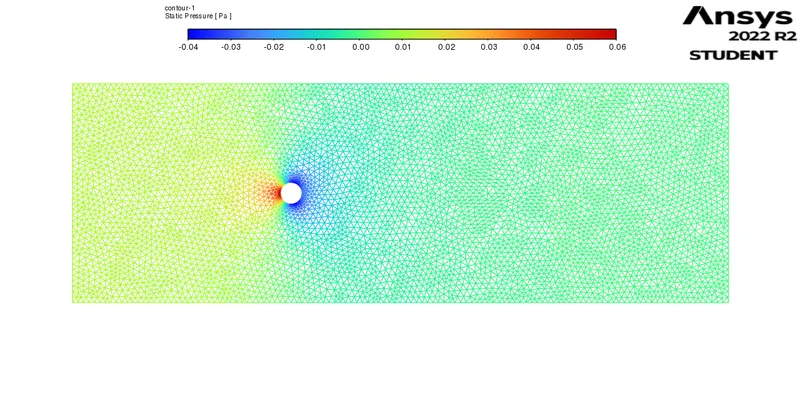
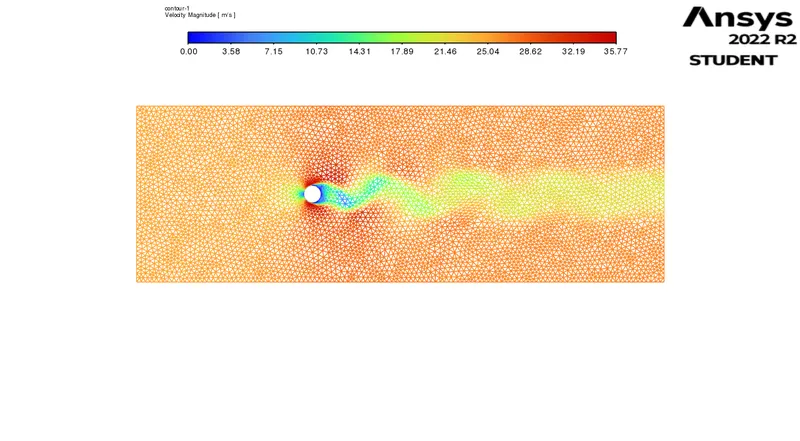
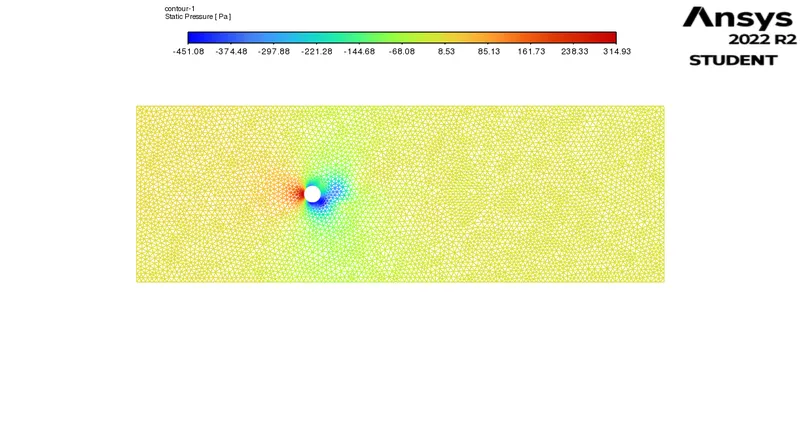
2. Re=1000, velocity= 25m/s
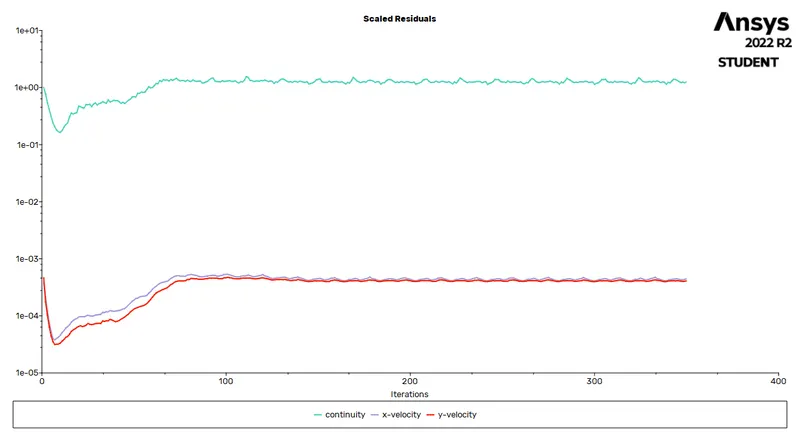
Residuals
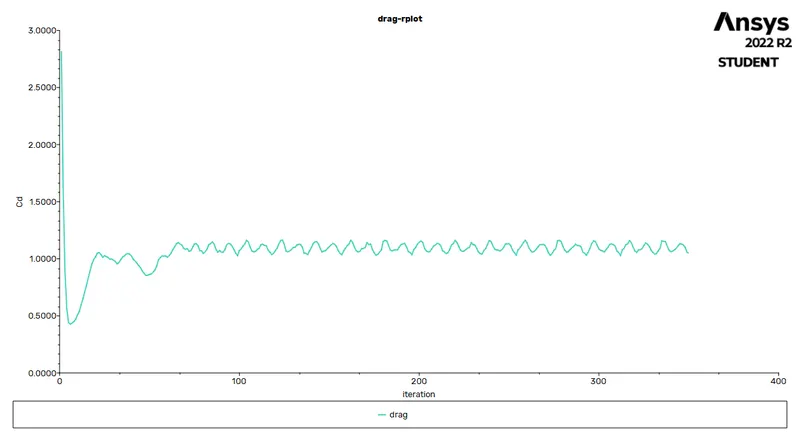
Drag coefficient
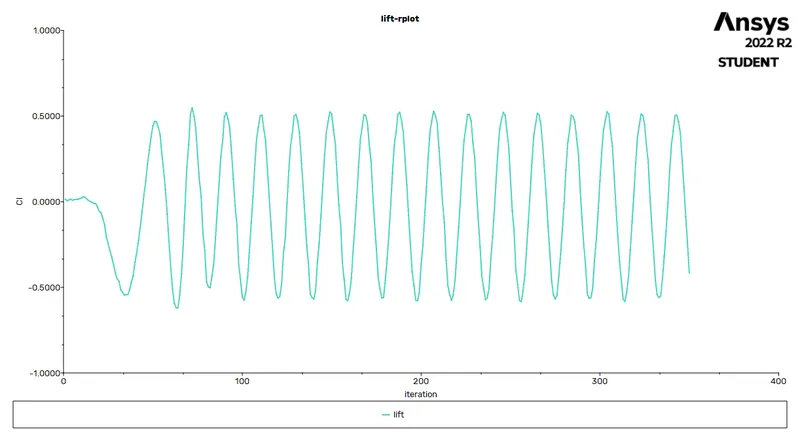
Lift coefficient
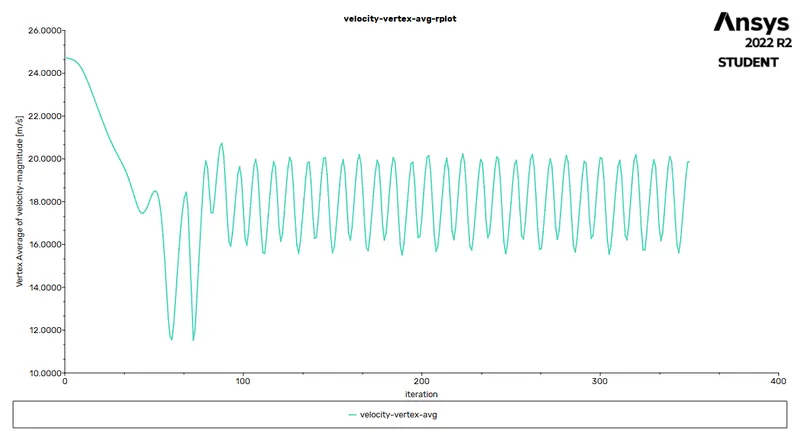
Monitoring point velocity
velocity contour
Pressure contour
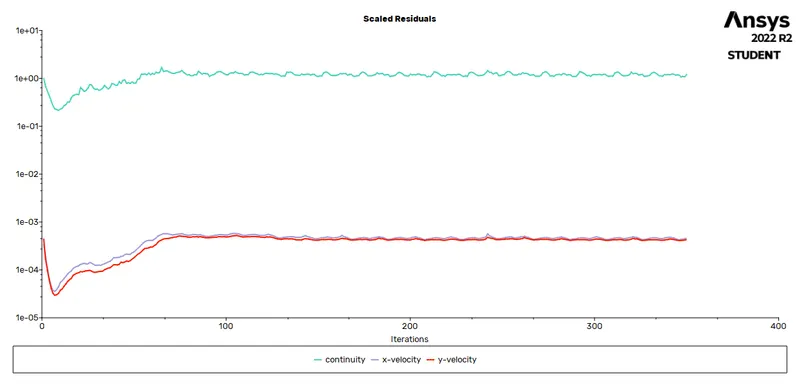
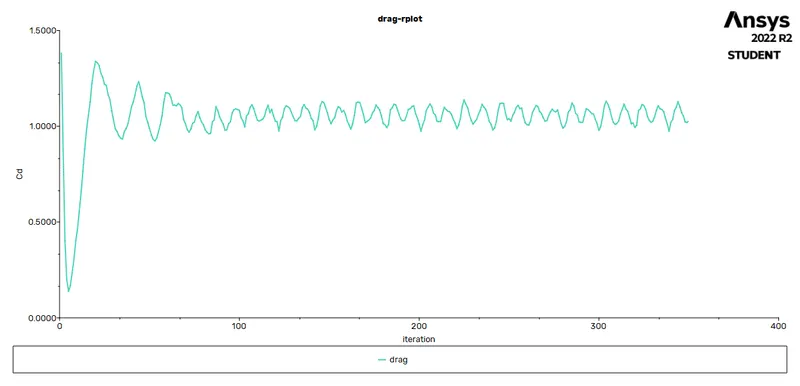
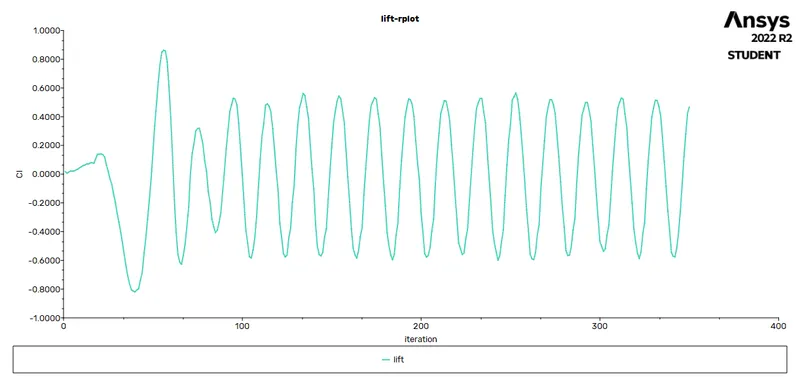
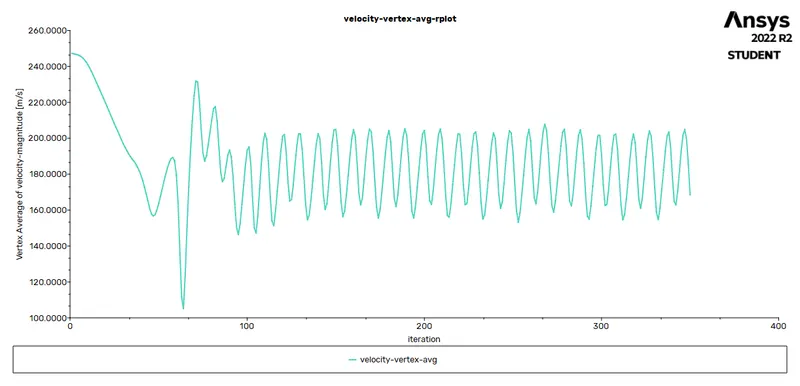
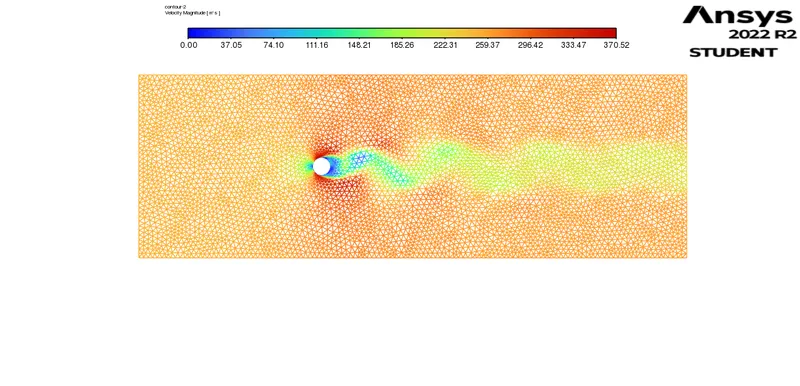
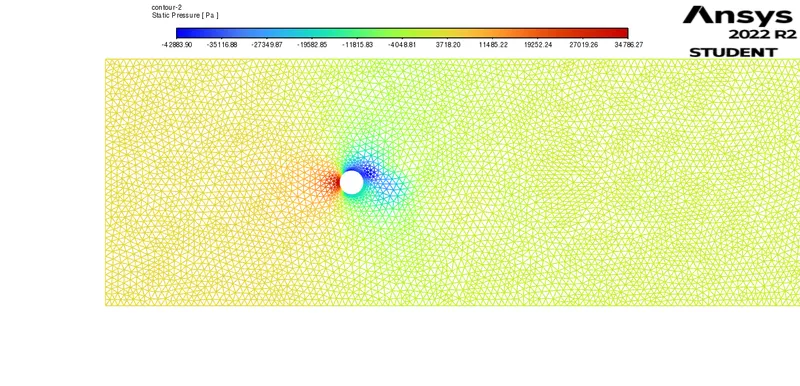
3. Re= 10000, velocity= 250m/s
Residual
Drag coefficient
Lift coefficient
Monitoring pont velocity
Velocity contour
Pressure contour
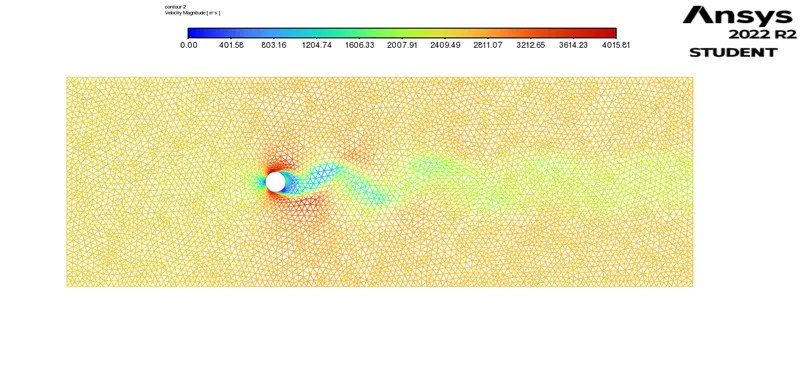
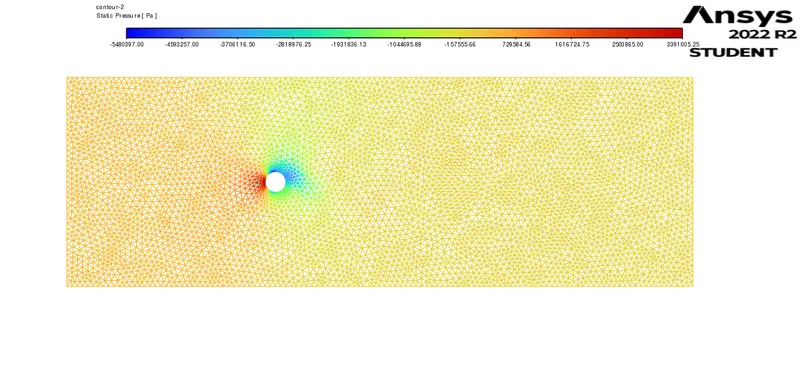
4. Re=100000, velocity = 2500m/s
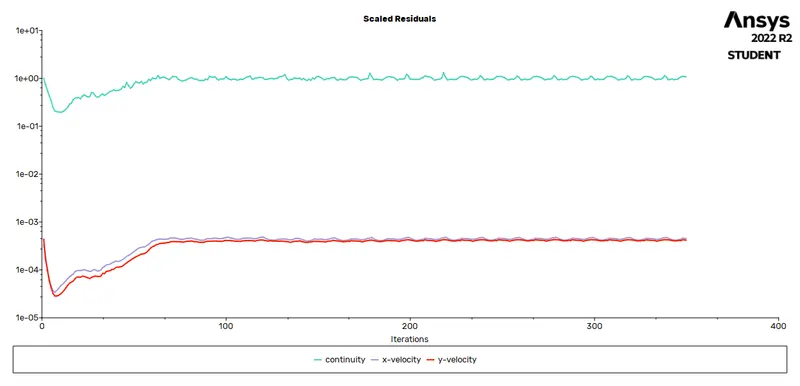
Residuals
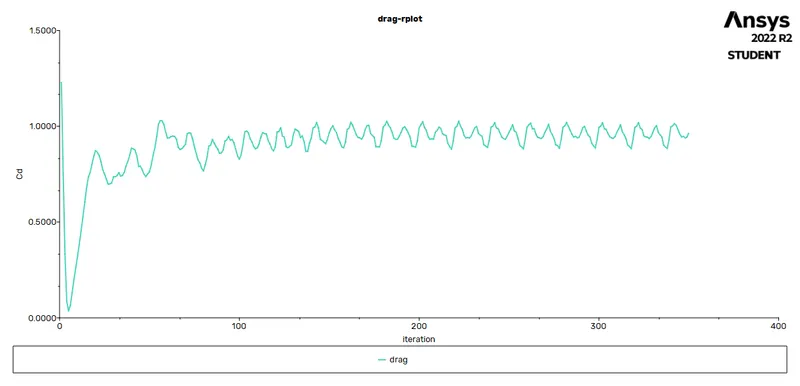
Drag coefficient
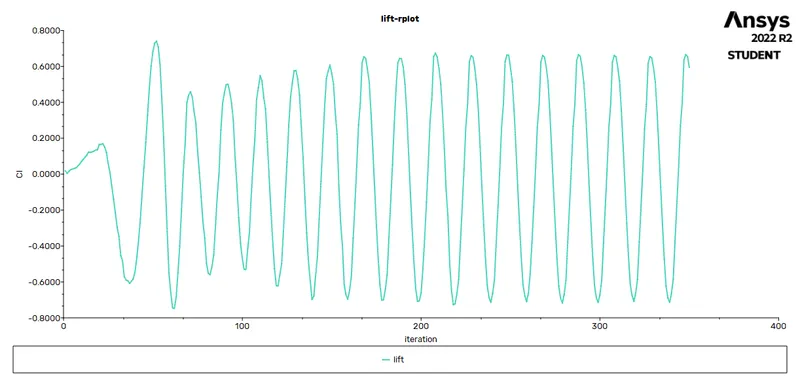
Lift coefficient
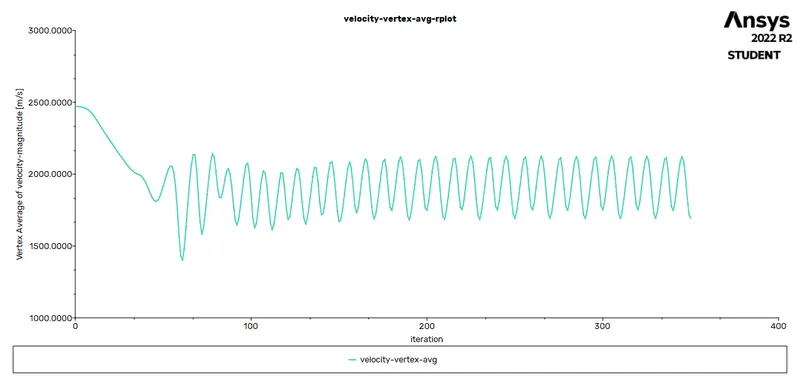
Monitoring point velocity
Velocity contour
Pressure contour
Summarized result
| Re | Cd(Drag coeff) | Cl(Lift Coeff | Monitoring point velocity(m/s) |
| 10 | 3.33 | -0.003 | .108 |
| 100 | 1.33 | -0.08 | 1.22 |
| 1000 | 1.01 | -.04 | 19.85 |
| 10000 | 1.02 | .46 | 168.115 |
| 100000 | 0.92 | 0.59 | 1690.5 |
Theoretical comaprison of cd
| Reynolds no | Theoretical Cd | Numerical Cd | error |
| 10 | 3.5 | 3.3 | 4.77% |
| 100 | 1.4 | 1.33 | 2.6% |
So error computable is less than 5%
CONCLUSION
- Other than the case of Re=10 all other case determines the phenomenon of von karman vortex street.
- As we see in residuals straight line or similar patterens which means the solutions are converged.
- We observe as the Reynolds no. increses the effect of Vortex shedding increases.
- As reynolds number increases the pressure at stagation point increases and more low pressure is created towards the Monitoring point(back side)
- As Velocity increases the drag coefficient decreases while lift coefficient increases
Link For Animation GIFs-https://drive.google.com/drive/folders/1al1XDy_fED2F3-UkVmPJkh415foR4Nus?usp=sharing
Reference- https://www.sciencedirect.com/science/article/pii/S0307904X08000243