Week 2 - Flow over a Cylinder.
Aim: To simulate the flow over a cylinder and explain the phenomenon of Karman vortex street.
Objectives:
- Case-1:
1. To simulate the flow with the steady and unsteady case and set the Reynolds number value for both the cases for Re= 100.
- Case-2: 1. Calculate the coefficient of drag and lift over a cylinder by setting the Reynolds number value as 10, 100, 1000, 10000, & 100000. (Both the case are run in steady state case only) 2. Discuss the effect of the Reynolds number on the coefficient of drag.
Factors Entailed:
1. Flow over a cylinder:
- Flow over a cylinder is important in many industrial applications like cooling or cylindrical pipe.
- Flow over a cylinder is a classical problem for understanding the flow over an obstacle.
- The flow past a two-dimensional cylinder is one of the most studied aerodynamics applications.
- Depending on the flow rate, fluid properties, and size of the cylinder, the flow can be a laminar, transition, and turbulent.
- The Reynolds numbers are <10, and the flow is laminar.
- The Reynolds number value is between 10 to 40, and two stationary vortices appear behind the cylinder.
- When its flow is 40 to 200, vortex shedding starts, and the vortices are going to detach from the top and bottom of the cylinder. 2. Strouhal number:
- In dimensional analysis, it is a dimensional number describing an oscillating flow mechanism.
- It can be important when analyzing unsteady, oscillating flow problems. 3. Co-efficient of drag:
- In fluid dynamics, the drag coefficient is a dimensionless quantity that is used to quantify the drag or resistance of an object in a fluid environment, such as air or water. It is used in the drag equation in which a lower drag coefficient indicates the object will have a less aerodynamic or hydrodynamic drag. The drag coefficient is always associated with a particular surface area.
- The drag coefficient of a complete structure such as an aircraft also includes the effects of interference drag. 4. Co-efficient of lift:
- The lift coefficient is a dimensionless coefficient that relates the lift generated by a lifting body to the fluid density around the body, the fluid velocity, and an associated reference area.
- The section lift coefficient refers to the dynamic lift characteristics of a two-dimensional foil section, with the reference area replaced by the foil chord.
Solution:
CASE 1:(a)STEADY-STATE
PROCESS: GEOMETRY
- All the units are in meters
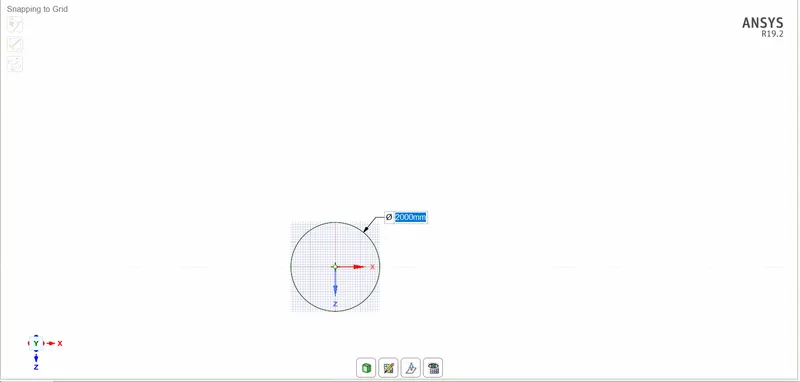
- To draw the circle the diameter is 2m, and to draw the rectangle length is 60*20m and the distance from the circle breadth end is 10m.
- And to fix the axis.
MESH:
- After the geometry is loaded we should mesh it and here I used 0.25 m as elemental size.
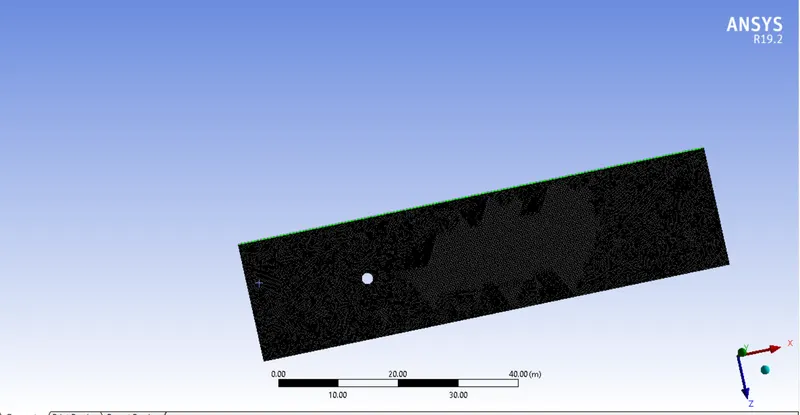
- But the meshing nodes, the shape is more quadrilateral than the triangle so we should do this by changing the method to the triangle in the insert option.
- After changing the node's shape into triangles we should improve the mesh around the cylinder by sizing the mesh which is used to control precisely the mesh.
- Then we should add inflation which is used to create a body-fitted mesh.
- Where the cylinder edge is named as walls.
Data for setting up ANSYS fluent:
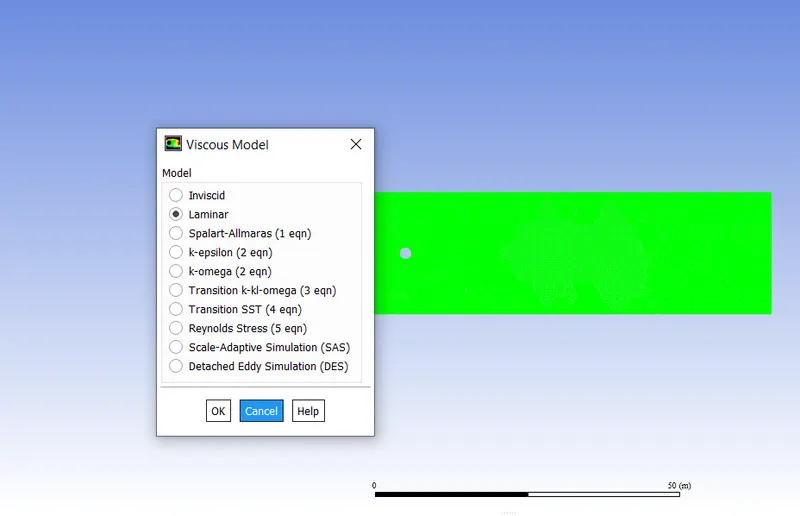
- We should update the mesh before opening the setup. Then, we should change for a viscous to laminar flow.
- Density/kinematic viscosity: 1/0.05
- Create a monitor point behind the cylinder by selecting the point under surfaces in the results bar.
- After creating the monitor point, create reports/plots for drag, lift, velocity wrt cylinder.
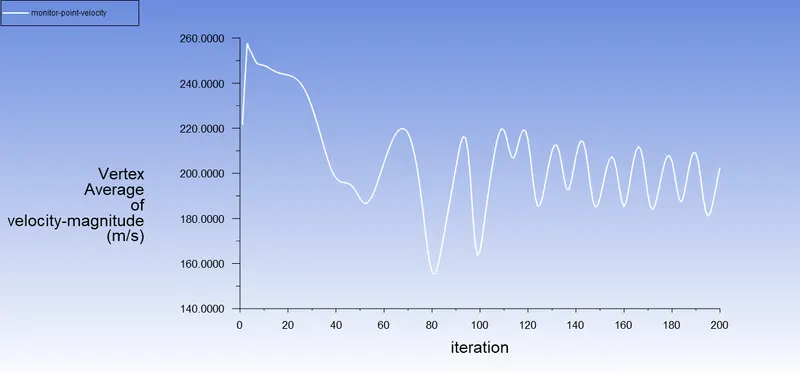
- Creates plots for the velocity at the monitor point to analyze the vortex shedding.
- Use hybrid initialization for steady-state and standard for transient state simulations.
CASE1:(a) STEADY STATE
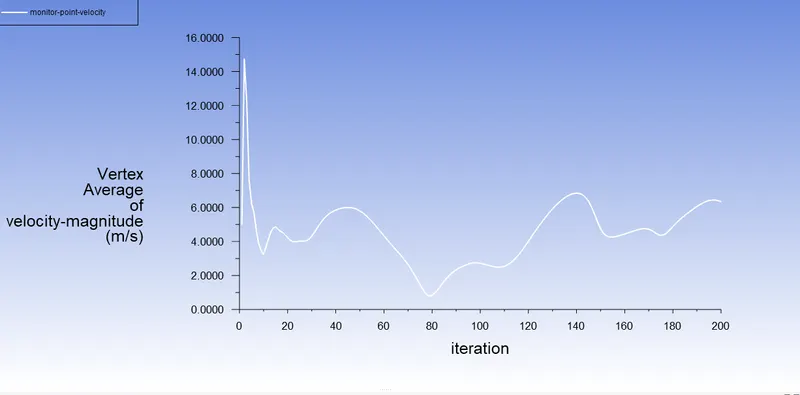
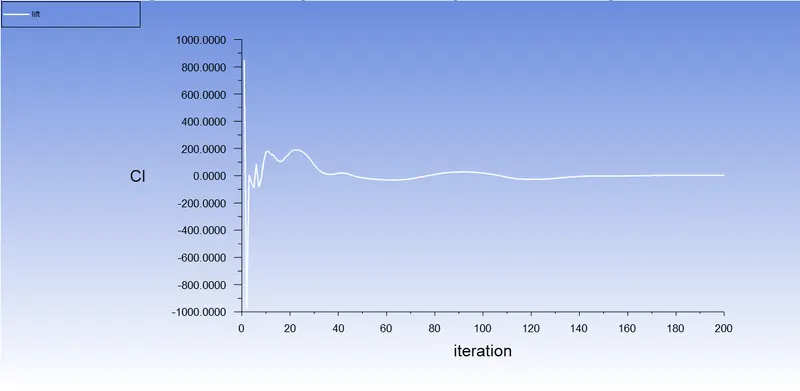
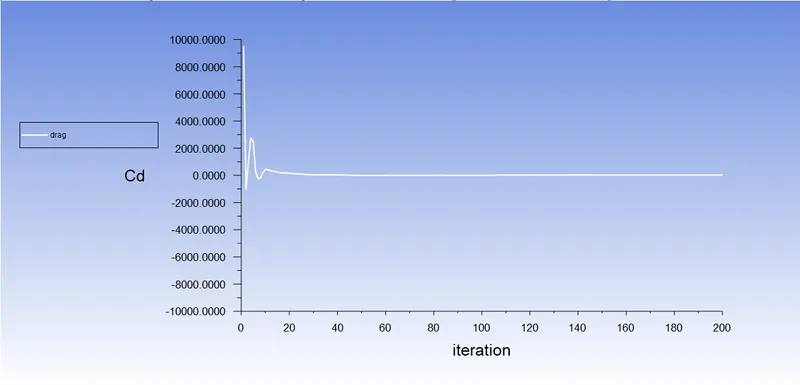
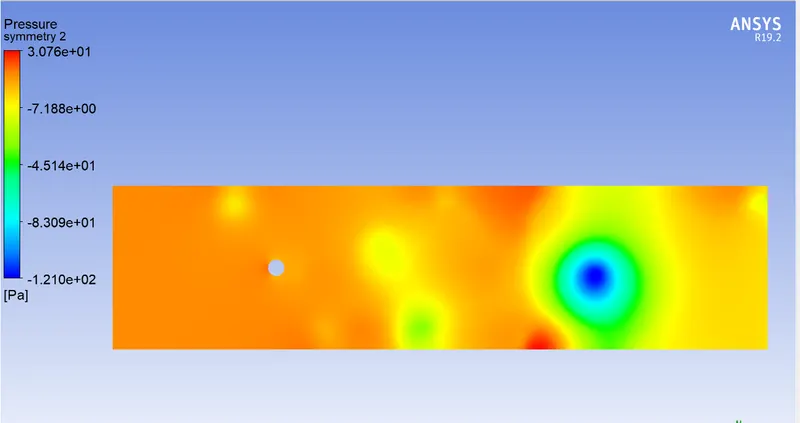
- Now, simulate the flow with the steady case and calculate the strouhal number for Re=100 and velocity 2.5m/s.
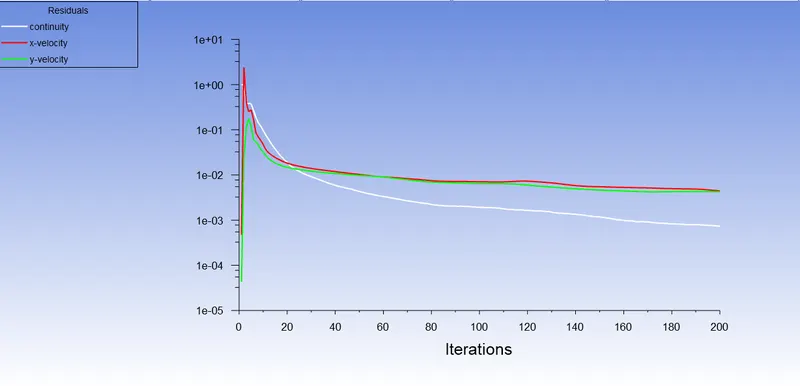
- Residuals plot:
- Monitor point velocity:
- Coefficient of lift (CI):
- Coefficient of drag (CD):
- Pressure contour:
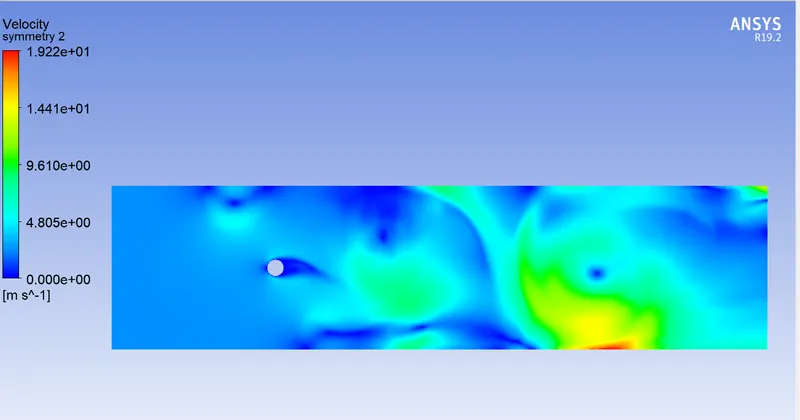
- Velocity Contour:
CASE1:(b) UNSTEADY STATE
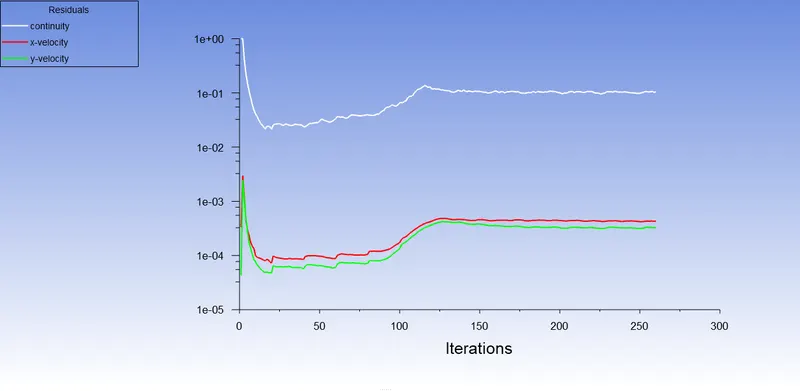
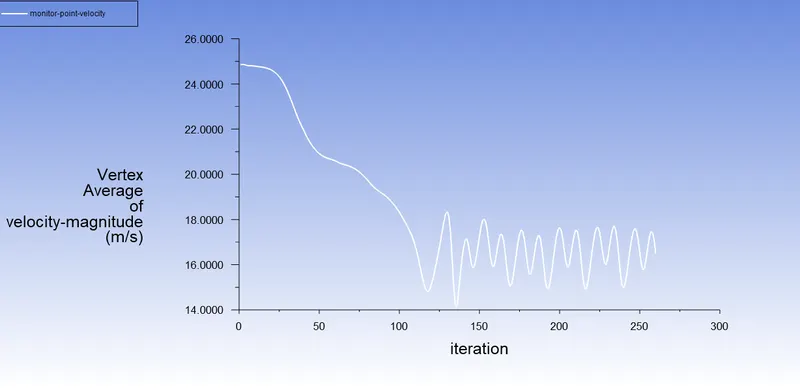
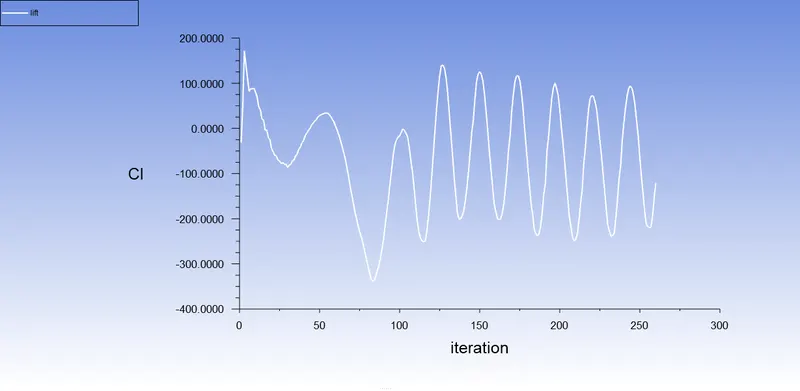
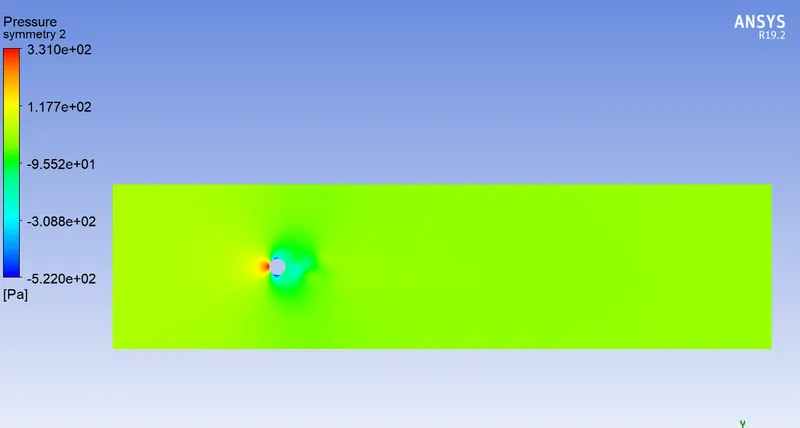
- Now, simulate the flow with the Unsteady case and calculate the strouhal number for Re=1000 and velocity 25m/s.
- Residuals plot:
- Monitor point velocity:
- Coefficient of lift (CI):
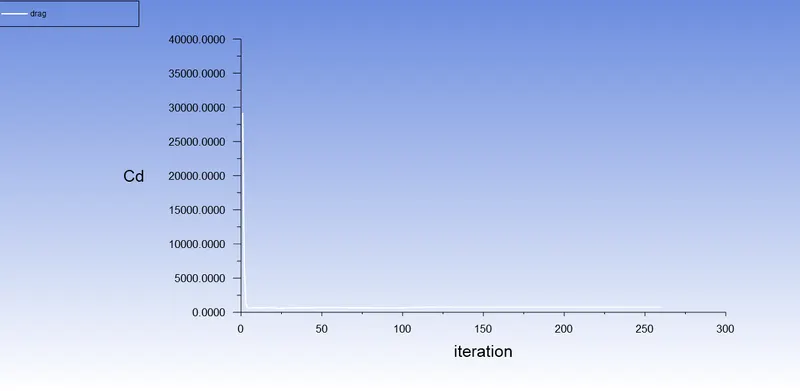
- Coefficient of drag (CD):
- Pressure contour:
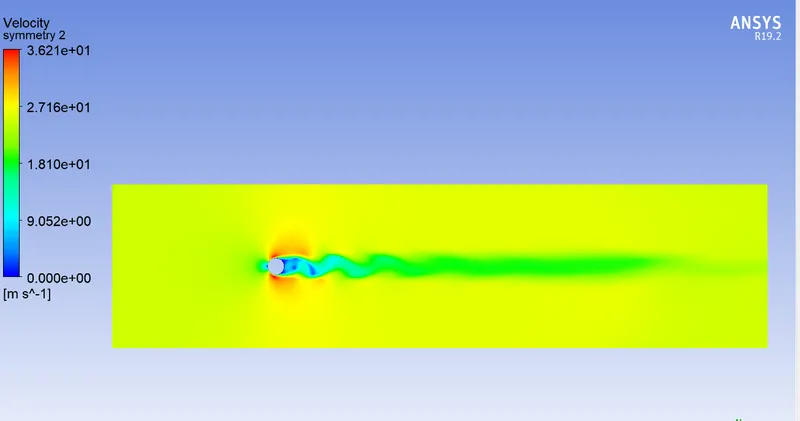
- Velocity Contour:
CASE2:(a) STEADY STATE
- Now, simulate the flow with the steady case and calculate the strouhal number for Re=10 and velocity 0.25m/s.
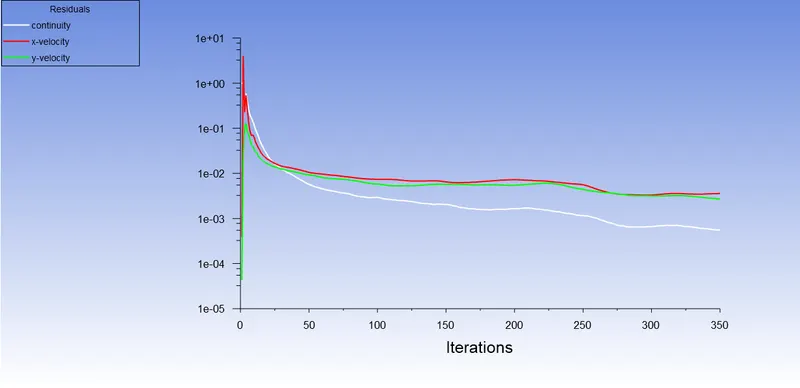
- Residuals plot:
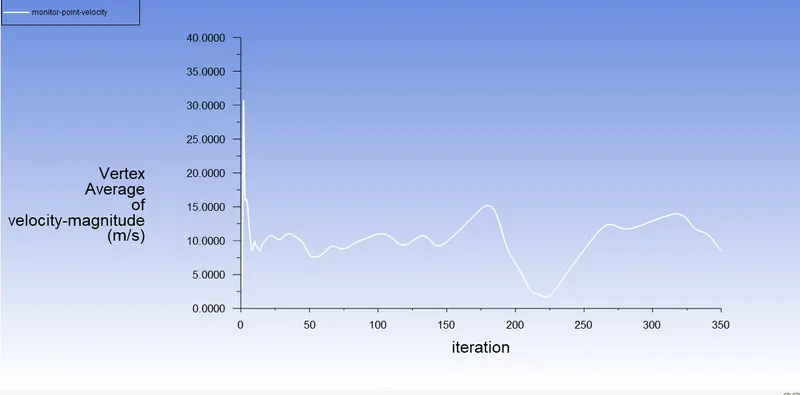
- Monitor point velocity:
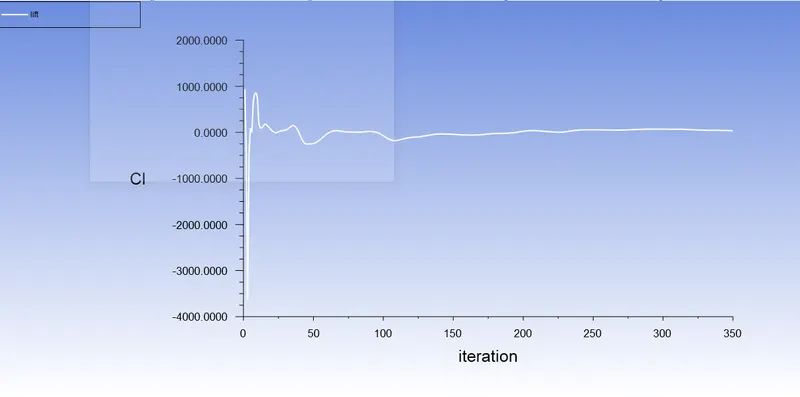
- Coefficient of lift (CI):
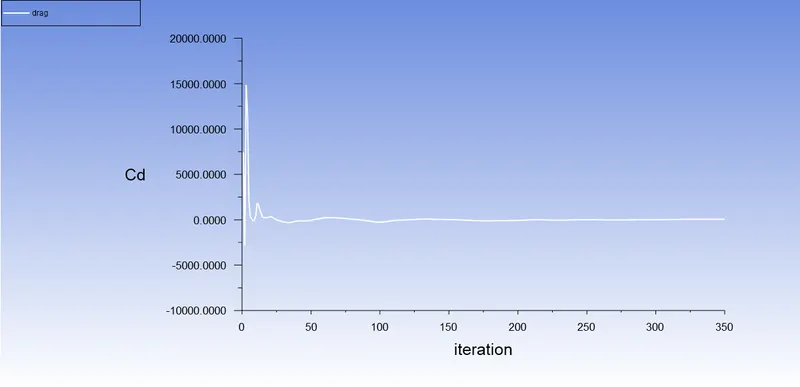
- Coefficient of drag (CD):
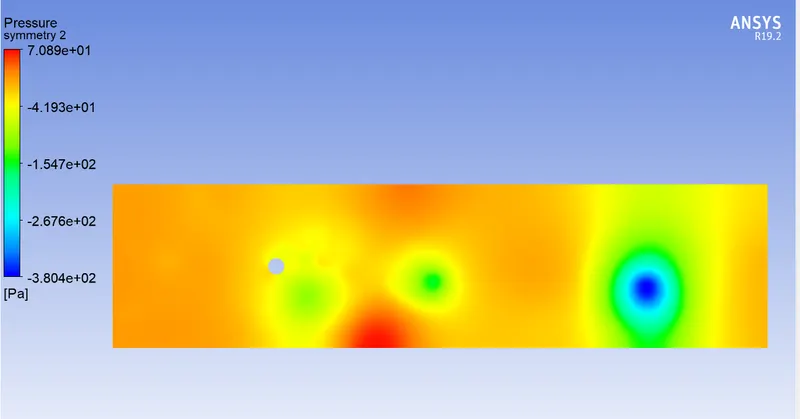
- Pressure contour:
- Velocity Contour:
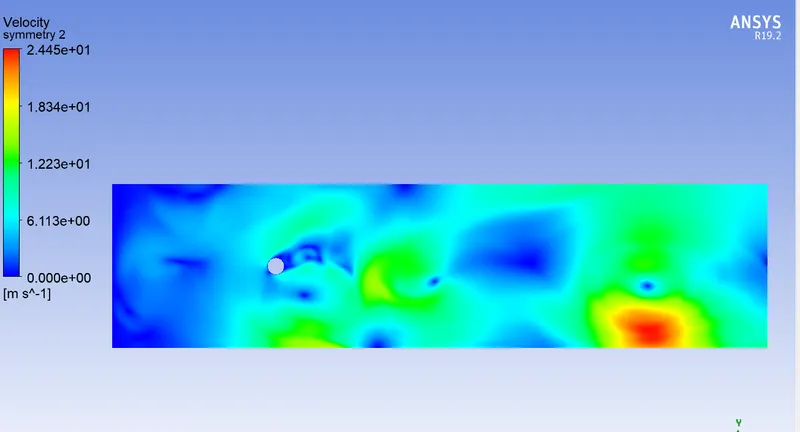
CASE2:(b) STEADY STATE
- Now, simulate the flow with the steady case and calculate the strouhal number for Re=100 and velocity 2.5m/s.
- Residuals plot:
- Monitor point velocity:
- Coefficient of lift (CI):
- Coefficient of drag (CD):
- Pressure contour:
- Velocity Contour:
CASE2:(c) STEADY STATE
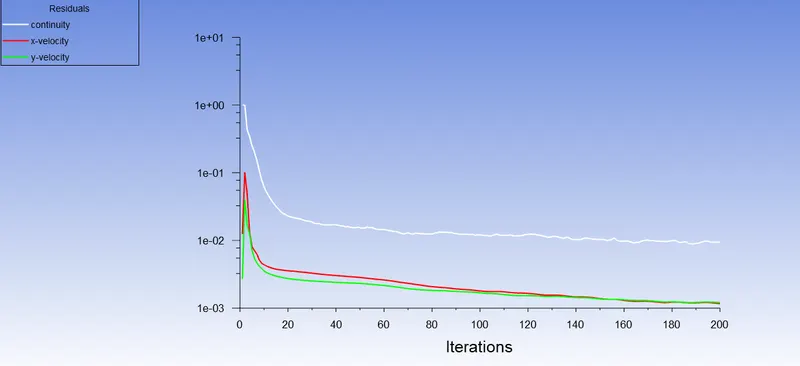
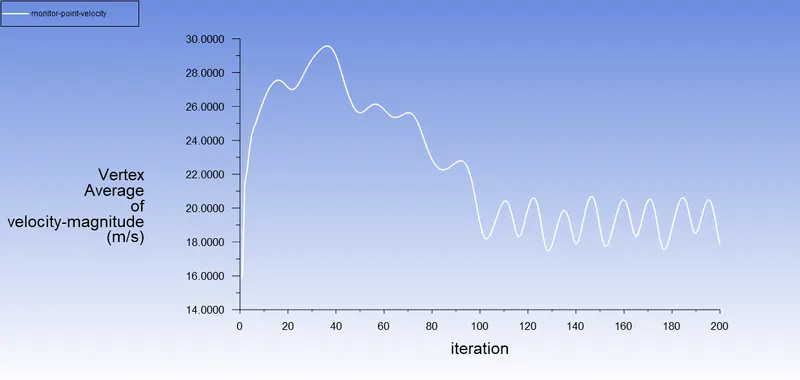
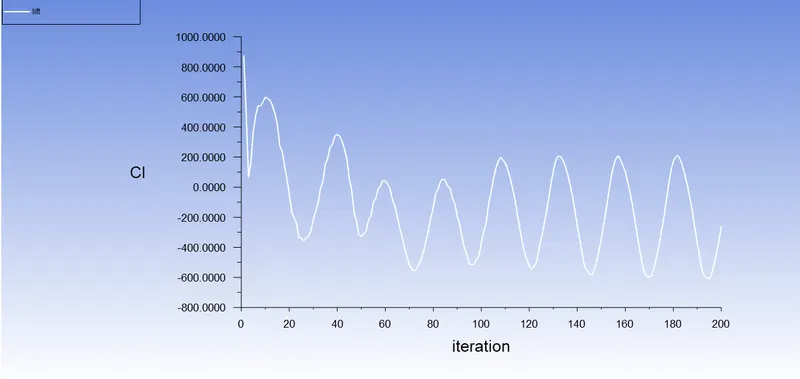
- Now, simulate the flow with the steady case and calculate the strouhal number for Re=1000 and velocity 25m/s.
- Residuals plot:
- Monitor point velocity:
- Coefficient of lift (CI):
- Coefficient of drag (CD):
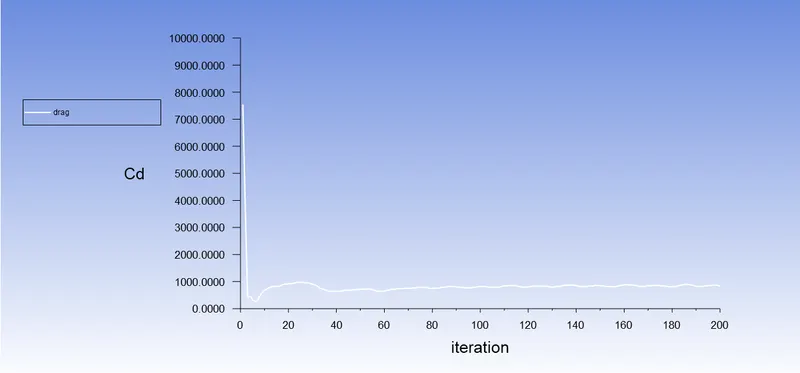
- Pressure contour:
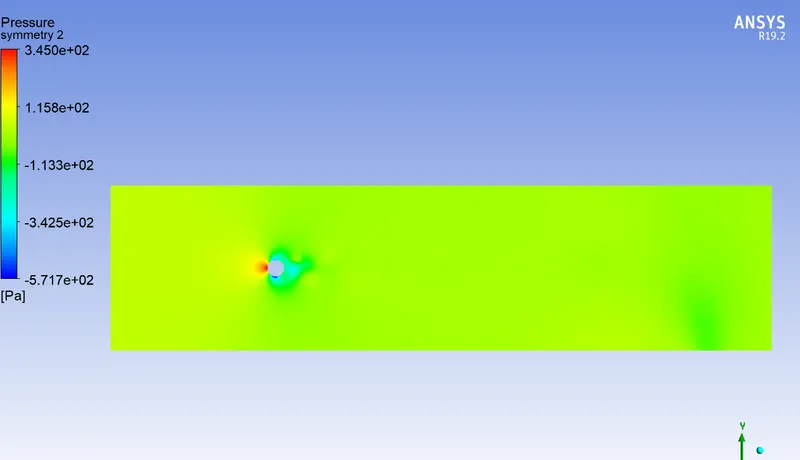
- Velocity Contour:
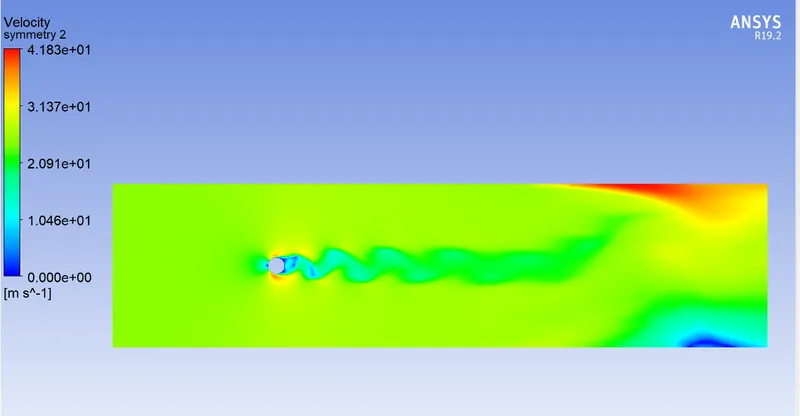
CASE2:(d) STEADY STATE
- Now, simulate the flow with the steady case and calculate the strouhal number for Re=10000 and velocity 250m/s.
- Residuals plot:
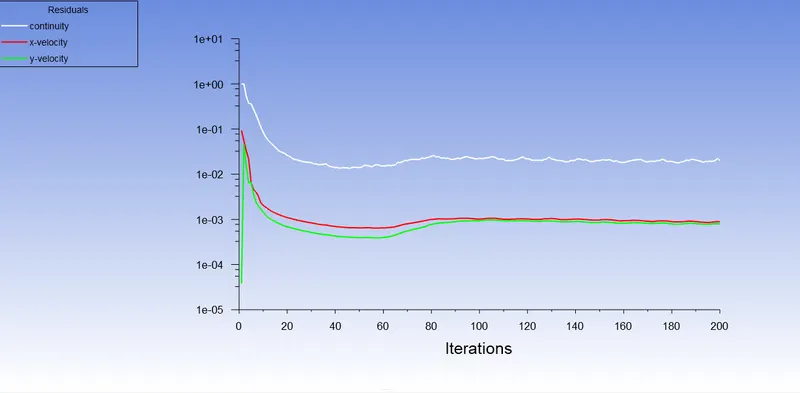
- Monitor point velocity:
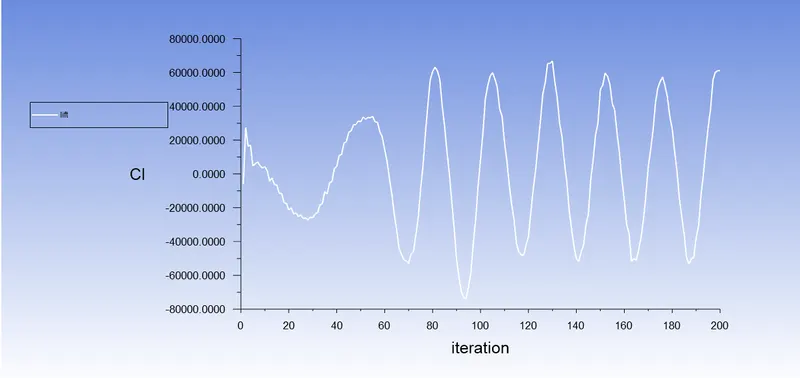
- Coefficient of lift (CI):
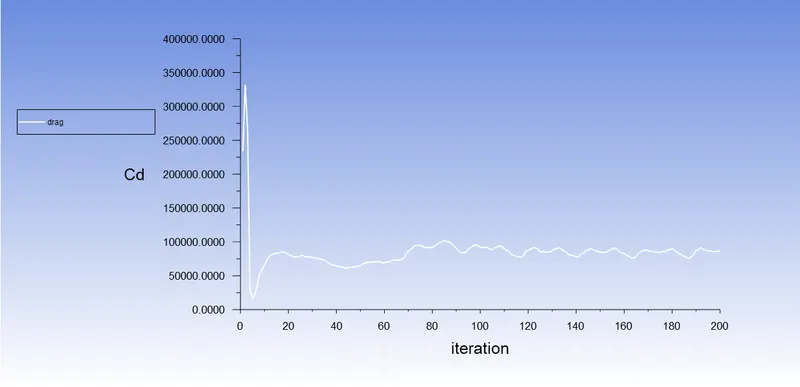
- Coefficient of drag (CD):
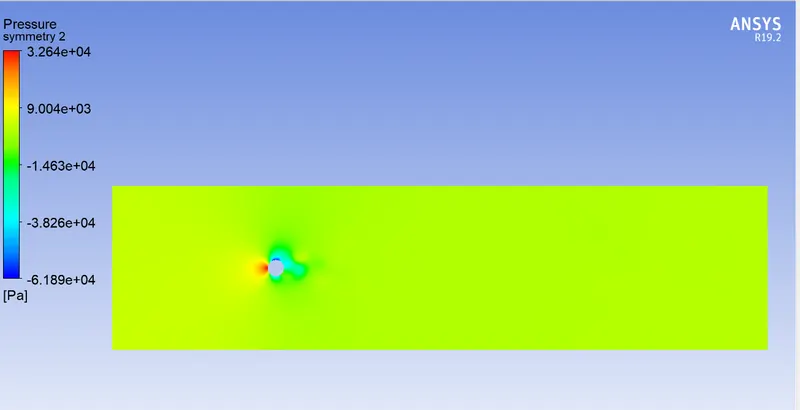
- Pressure contour:
- Velocity Contour:
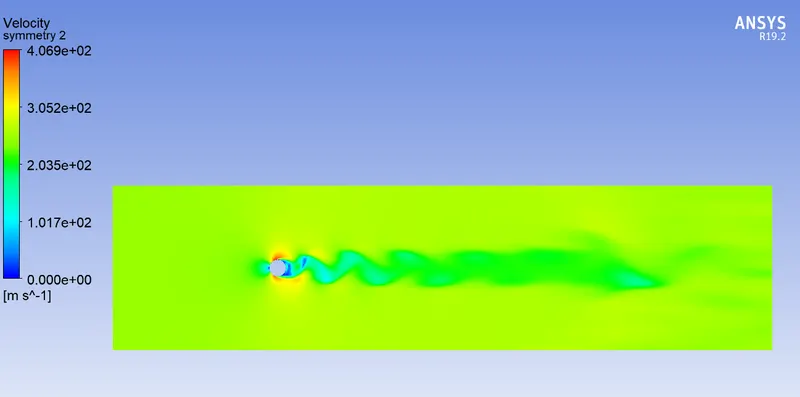
CASE2:(e) STEADY STATE
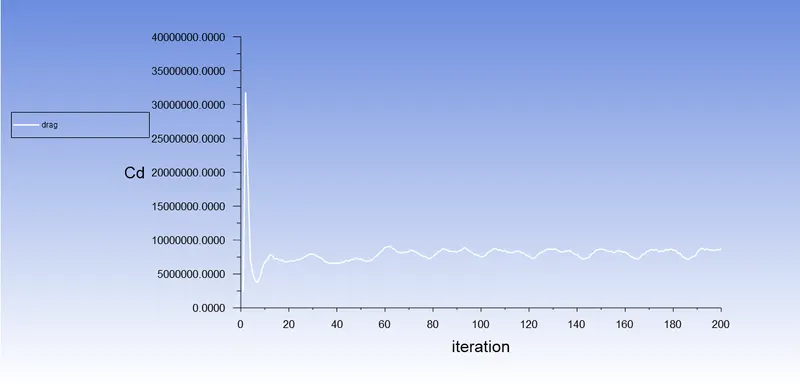
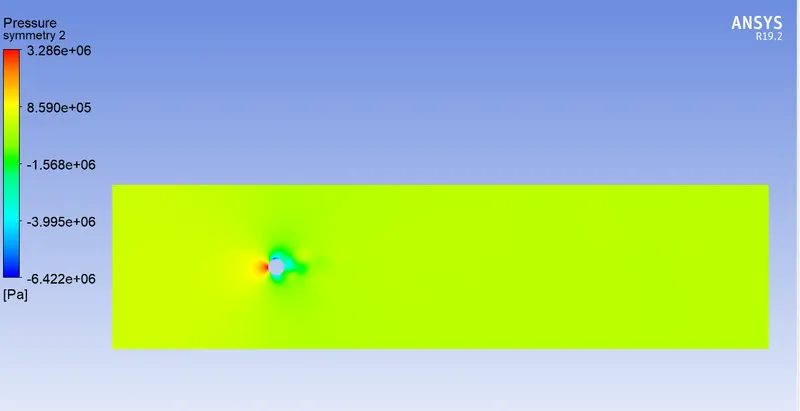
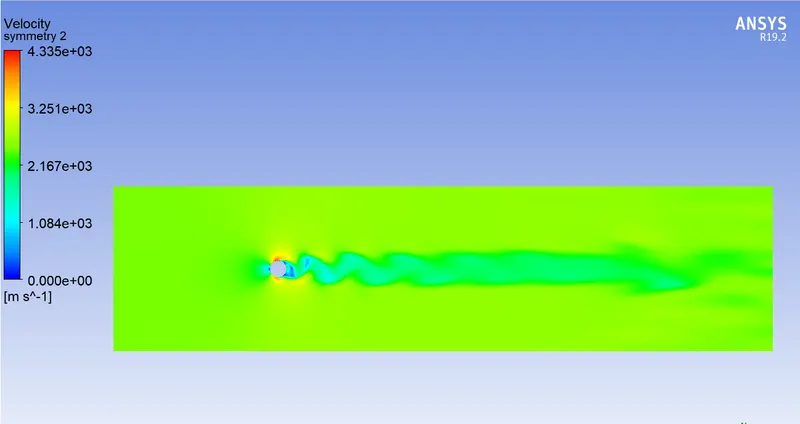
- Now, simulate the flow with the steady case and calculate the strouhal number for Re=100000 and velocity 2500m/s.
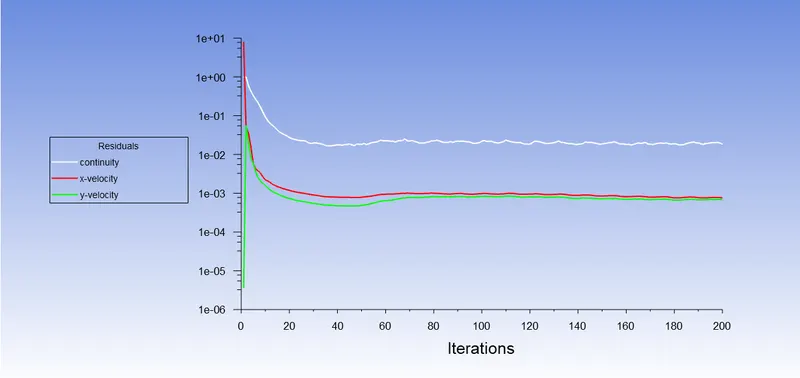
- Residuals plot:
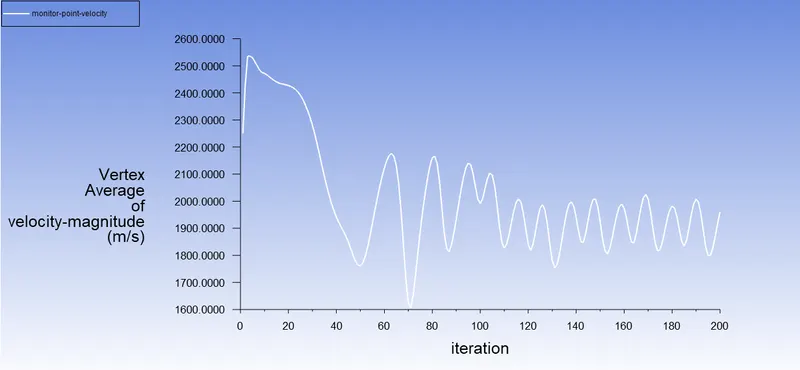
- Monitor point velocity
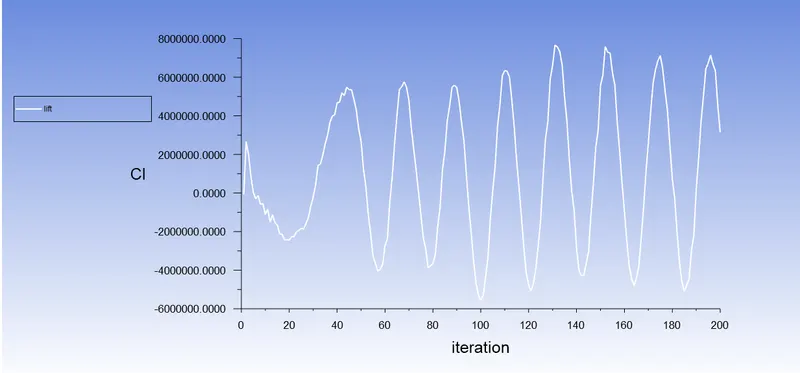
- Coefficient of lift (CI):
- Coefficient of drag (CD):
- Pressure contour:
- Velocity Contour:
RESULT:
Drag and lift coefficient for different Re:
Re Cd Cl
10 3.59 -0.02
100 1.29 -0.127
1000 0.91 -0.054
10000 0.87 -0.031
100000 0.83 -0.024
Errors with respect to the theoretical values from the reference material,
Reynolds number Theoretical Cd Numerical Cd Error
10 3.5 3.154 4.54%
100 1.4 1.857 3.2%
CONCLUSION:
- The flow over a cylinder is simulated in the first case for both steady and unsteady cases with Re=100, and from the results, the von Karman vortex street phenomenon is also seen.
- Plots that are necessary to see that the flow has converged and that vortex shedding is occurring are created.
- In the second iteration, the Reynolds number is changed to five different simulations, i.e. (Re = 10,100,1000,10000,100000 ), to observe how the drag and lift coefficients behave.
- For Re=10, it is observed that there is no formation of vortex shedding and in the rest of the cases, it is clearly observed.
- At a higher Reynolds number, flow around the cylinder becomes irregular. The increased inertia forces break the vortex generated behind the cylinder, with a high frequency of vortex shedding than that in laminar flow.
- From the above table, it can be concluded that the error percentage is less than 5%.