Week 2 Air standard Cycle
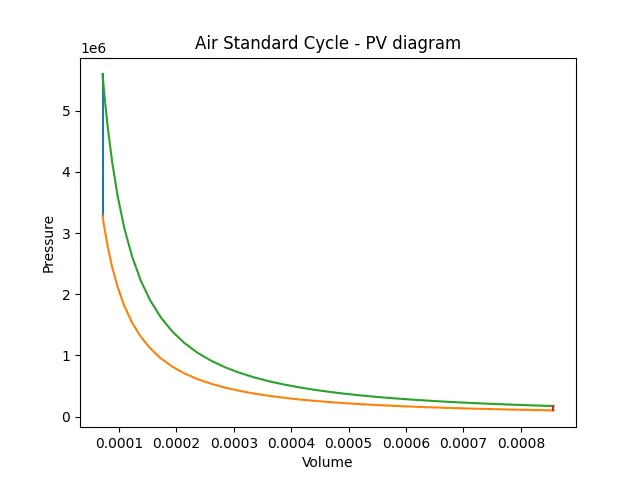
Objective - To write a program to plot a P-V diagram of the Otto Cycle and To calculate Thermal Efficiency of Otto Cycle using Python.
Air Standard Cycle -
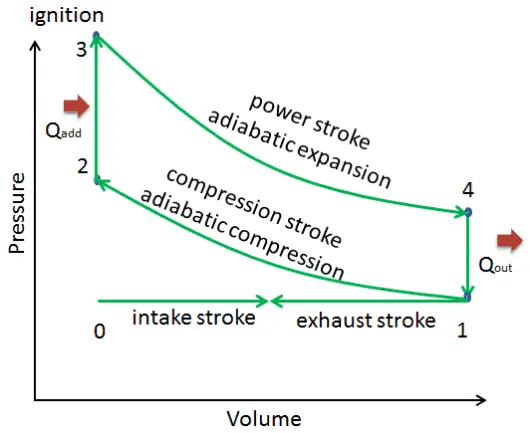
The air-standard Otto cycle is the idealized cycle for spark-ignition internal combustion engines.
The Otto cycle 1 → 2 → 3 → 4 consists of the following four processes:
Process 1-2: Isentropic compression of air;
Process 2-3: Heat supply at constant volume;
Process 3-4: Isentropic expansion of air;
Process 4-1: Heat rejection at constant volume.
Python Code:
"""
otto cycle simulator
"""
import math
import matplotlib.pyplot as plt
def engine_kinematics(bore,stroke,Con_rod,cr,start_crank,end_crank):
"""
Engine Kinematics
"""
# Geometric parameters
a = stroke/2 # crank pin radius
R = con_rod/a
# Volume parameters
v_s = math.pi*(1/4)*pow(bore,2)*stroke # Swept Volume
v_c = v_s / (cr-1) # Clearance volume
sc = math.radians(start_crank) # Starting crank angle
ec = math.radians(end_crank) # Ending crank angle
num_values = 50
dtheta = (ec-sc)/(num_values-1) # Crank angle spacing
V = [] # empty array
for i in range(0,num_values):
theta = sc + i*dtheta
term1 = 0.5*(cr-1)
term2 = R + 1 - math.cos(theta)
term3 = pow(R,2) - pow(math.sin(theta),2)
term3 = pow(term3,0.5)
V.append((1+term1*(term2-term3))*v_c)
return V
# Inputs
p1 = 101325 # Pressure at State-1
t1 = 500 # Temperature at State-1
gamma = 1.4
t3 = 2300
# Geometric parameters
bore = 0.1 # Engine bore size
stroke = 0.1 # Stroke length of engine
con_rod = 0.15 # Connecting rod length
cr = 12 # compression ratio
# Calculating the swept volume and the clearance volume
v_s = (math.pi/4)*pow(bore,2)*stroke # Volume of cylinder at start of compression or end of expansion
v_c = v_s/(cr-1) # Volume of cylinder at end of compression and start of expansion
v1 = v_c + v_s
# State point 2
v2 = v_c # Volume after isentropic compression
# p2v2^gamma = p1v1^gamma
p2 = p1*pow(v1,gamma)/pow(v2,gamma)
# p2v2/t2 = p1v1/t1 | rhs = p1v1/t1 | p2v2/t2 = rhs | t2 = p2v2/rhs
rhs = p1*v1/t1
t2 = p2*v2/rhs
# Position of crank pin angle when expansion start from 180 to 0
V_compression = engine_kinematics(bore, stroke, con_rod, cr, 180, 0)
constant = p1 * pow(v1, gamma)
P_compression = []
for v in V_compression:
P_compression.append(constant/pow(v, gamma))
# state point 3
v3 = v2
# p3v3/t3 = p2v2/t2 | rhs = p2v2/t2 | p3 = rhs*t3/v3
rhs = p2*v2/t2
p3= rhs*t3/v3
# position of crank pin angle when expansion start from 0 to 180
V_expansion = engine_kinematics(bore, stroke, con_rod, cr, 0, 180)
constant = p3 * pow(v3, gamma)
P_expansion = []
for v in V_expansion:
P_expansion.append(constant/pow(v, gamma))
# State point 4
v4 = v1
# p4v4^gamma = p3v3^gamma
p4 = (p3*pow(v3,gamma)/pow(v4,gamma))
# p4v4/t4 = rhs
t4 = p4*v4/rhs
# Thermal efficiency calculation
x = (1-gamma)
Thermal_efficiency = 1 - (pow(cr,x)) # Thermal efficiency of Otto cycle
Otto_Cycle_efficiency = Thermal_efficiency * 100 # Efficiency in percentage
print('Thermal_efficiency_of_Otto_cycle')
print(Otto_Cycle_efficiency)
plt.plot([v2,v3],[p2,p3])
plt.plot(V_compression,P_compression)
plt.plot(V_expansion,P_expansion)
plt.plot([v4,v1],[p4,p1])
plt.xlabel('Volume')
plt.ylabel('Pressure')
plt.title('Air Standard Cycle - PV diagram')
plt.show()
Code Explanation:
- The library module ‘math’ and ‘matplotlib.pyplot’ are imported using import command.
- The ‘Engine kinematics’ function created using def function statement with proper input variables
- The parameters such as crank pin radius, R value, swept volume and clearance volume calculated using formula
- Inside the function the volume formula is defined and values of volume calculated for 50 items and saved in empty array
- Each State variables pressure and volume are calculated. geometric parameters are defined, based on that swept volume and clearance volume calculated
- Function is called out to fine volume, pressure during expansion and compression cycle
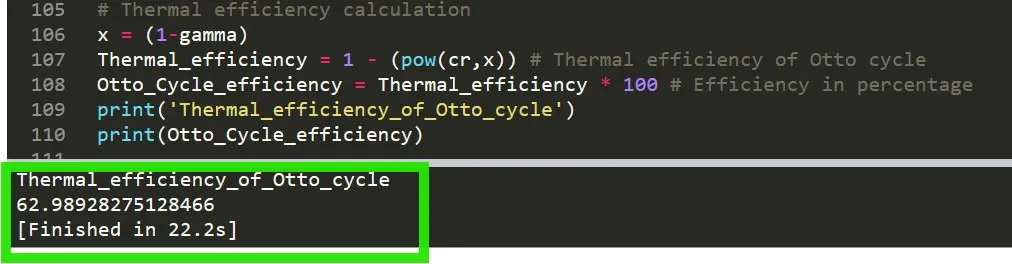
- The thermal efficiency of otto cycle calculated using the formula and resulted are printed in display window
- Then, using all state variables (pressure, volume) the PV diagram is plotted
Output:
# PV diagram of Otto cycle
# Thermal Efficiency of Otto cycle
Conclusion:
- The P-V diagram for all four processes has been plotted with proper markers of all 4 states and labels of all 4 process
- Thermal efficiency of the air standard cycle is calculated as 62.98%