Week 2 Air standard Cycle
objective:Based on the concepts you have learnt during the forward kinematics routine, go ahead and write code that can solve an otto cycle and make plots for it.
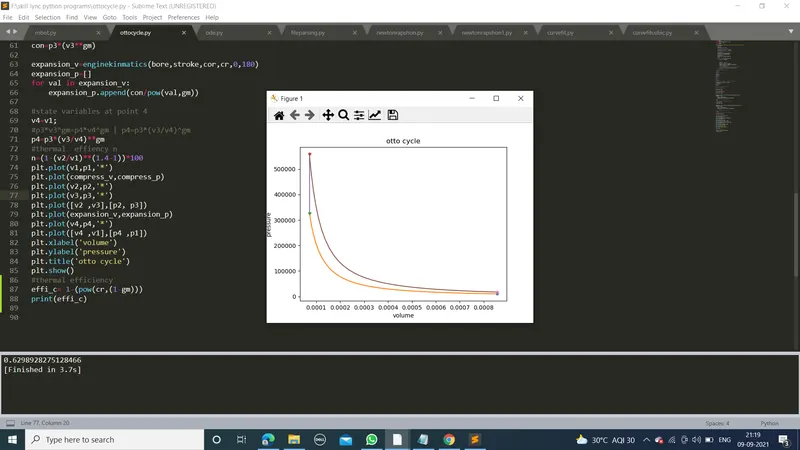
In this programme i have plotted a PV diagramme for an Otto cycle by using a engine parameters and some inputs. In this cycle we have four process to complete
one cycle. if p1 and t1 are inputs and t3 is the output parameters so that we can calculate v1,v2,p2,p3,p4,t2,t4 and it has two constant volume processes so that
v2=v3 and v1=v4. at last i have evaluated the Thermal_effeciency of Otto cycle
The processes of Otto cycle are
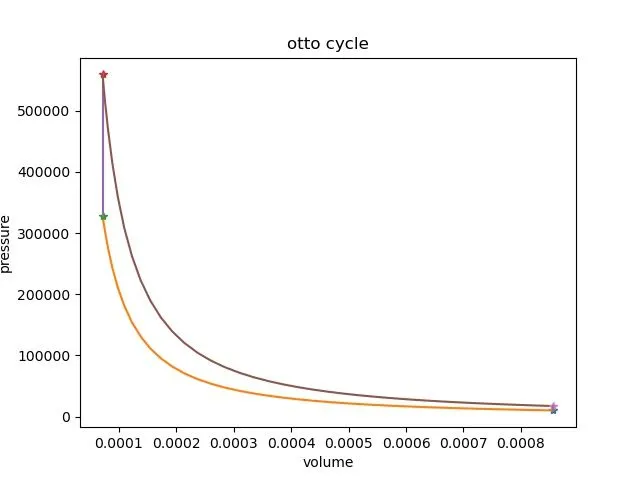
1. Process 1–2 is an adiabatic (isentropic) compression.
2. Process 2–3 is a constant-volume heat transfer.
3. Process 3–4 is an adiabatic (isentropic) expansion (power stroke).
4. Process 4–1 completes the cycle by a constant-volume process in which heat is rejected.
Thermal efficiency of the engine is given by
n=1-(1/r**(k-1))
where
η = thermal efficiency
r = compression ratio that is 'cr'
K = the value of gamma that is 1.4 adiabatic process
code:
import math
import matplotlib.pyplot as plt
import numpy as np
import math
def enginekinmatics(bore,stroke,cor,cr,startcrank,endcrank):
    a=stroke/2
    r=cor/a
    teta=math.radians(0)
    #swept volume calculaton vc
    vs=(math.pi/4)*bore**2*stroke
    #clearence volume calculation vc
    vc=vs/(cr-1)
    sc=math.radians(startcrank)
    ec=math.radians(endcrank)
    numvalues=50
    dtetha=(ec-sc)/(numvalues-1)
    V=[]
    for i in range(0,numvalues):
        teta=sc+i*dtetha


        term1=0.5*(cr-1)
        term2=r+1-math.cos(teta)
        term3=pow(r,2)-pow(math.sin(teta),2)
        term3=pow(term3,0.5)
    #to caliculate volumme v=(1+term1*(term2-term3))*vc
        V.append((1+term1*(term2-term3))*vc)
    return V
#state variables at point1
p1=10135
t1=500
 #engine geometrics
bore=0.1
stroke=0.1
cor=0.15
cr=12
#inputs
gm=1.4
t3=2300
#caliculating swept and clearence volume
vs=(math.pi/4)*bore**2*stroke
vc=vs/(cr-1)
v1=vs+vc
v2=vc
#state variables at point 2
#p2*v2^gm=p1*v1^gm
#p2=p1*(v1/v2)^gm
p2=p1*(cr)**gm
#p1*v1*t1=p2*v2*t2
t2=p2*v2*t1/(p1*v1)
con=p1*(v1**gm)

compress_v=enginekinmatics(bore,stroke,cor,cr,180,0)
compress_p=[]
for val in compress_v:
    compress_p.append(con/pow(val,gm))
#state vriable at point 3
v3=v2
#p3*v3/t3=p2*v2/t2 | p3=p2*t3/t2
p3=(p2*t3)/t2
con=p3*(v3**gm)

expansion_v=enginekinmatics(bore,stroke,cor,cr,0,180)
expansion_p=[]
for val in expansion_v:
    expansion_p.append(con/pow(val,gm))

#state variables at point 4
v4=v1;
#p3*v3^gm=p4*v4^gm | p4=p3*(v3/v4)^gm
p4=p3*(v3/v4)**gm
#thermal  effiency n
n=(1-(v2/v1)**(1.4-1))*100
plt.plot(v1,p1,'*')
plt.plot(compress_v,compress_p)
plt.plot(v2,p2,'*')
plt.plot(v3,p3,'*')
plt.plot([v2 ,v3],[p2, p3])
plt.plot(expansion_v,expansion_p)
plt.plot(v4,p4,'*')
plt.plot([v4 ,v1],[p4 ,p1])
plt.xlabel('volume')
plt.ylabel('pressure')
plt.title('otto cycle')
plt.show()
#thermal efficiency
effi_c= 1-(pow(cr,(1-gm)))
print(effi_c)
codelogic:
EXPLANATION OF THE PYTHON CODE:-
1. Import the necessary modules.
2. Based on the relationship between crank angle and volume inside the chamber we make a function named engine_kinematics, which takes the following
inputs - stroke,con_rod,cr,v_clearence,start_crank_angle,end_crank_angle And it returns an array of the volumes inside the chamber as an output for the
variation of crank angle.
3. Assign the input values.
4. Calculate the swept volume, clearance volume, v1 & v2.
5. Calculate of static variables based on the derived formulas using the given data.
6. Calculate the pressure & volume during compression and expansion calling the engine_kinematics function.
7. Plot of the curves which represent the thermal process based on the p & v values of four states.
8. Give title and label to the graph.
9. Calculation of thermal efficiency
output:
effieciency:
pvplot:
obsevation:
CONCLUSION:-
1. The thermal efficiency of the otto cycle is 0.62 or 62%.. Efficiency is typically less than 100% because there are inefficiencies such as friction and heatloss that convert the energy into alternative forms.
2. The graph which we get is the ideal otto cycle p-v diagram. The actual otto cycle diagram is different but for the ease of calculation we generally use theideal diagram.