Project 1 - Parsing NASA thermodynamic data
objective:
1. Write a function that extracts the 14 co-efficients and calculates the enthalpy, entropy and specific heats for all the species in the data file.
The FIRST 7 coefficients are HIGH-temperature coefficients and the SECOND 7 coefficients are LOW-temperature coefficients.
Also use the LOCAL TEMPERATURE RANGES which is unique for each individual species, not the GLOBAL TEMPERATURE RANGE.
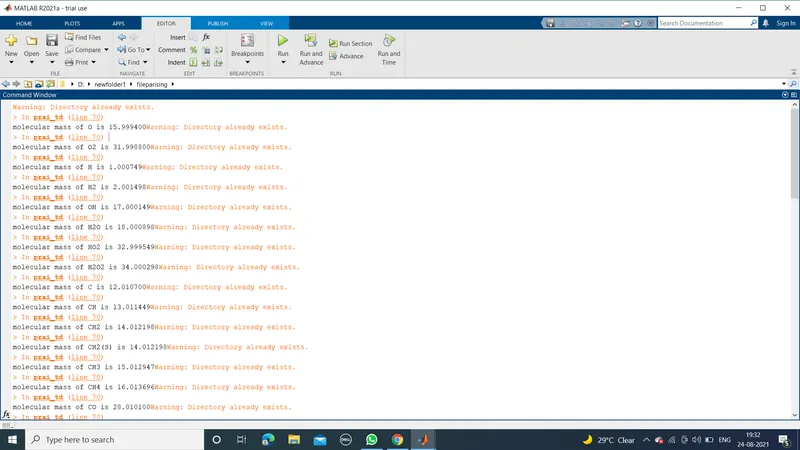
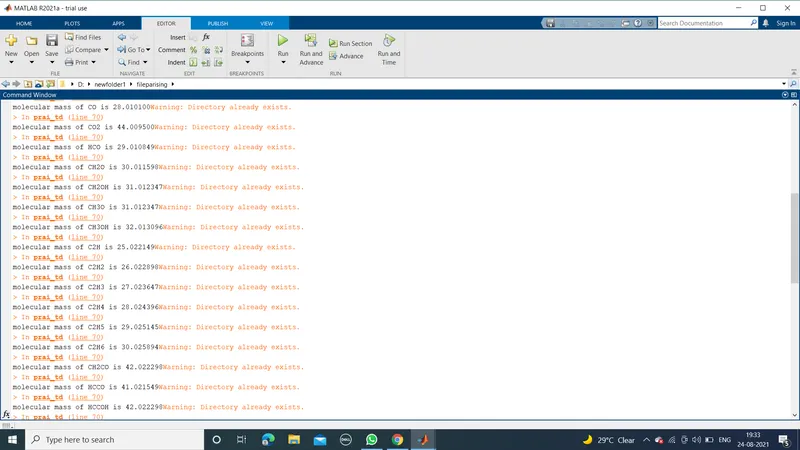
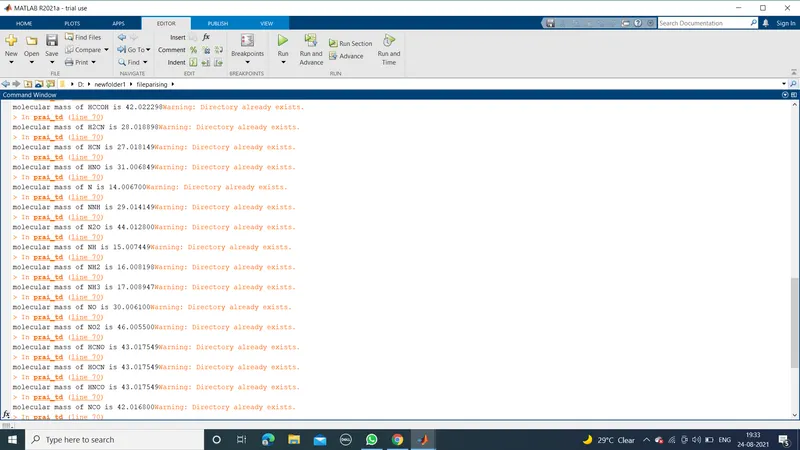
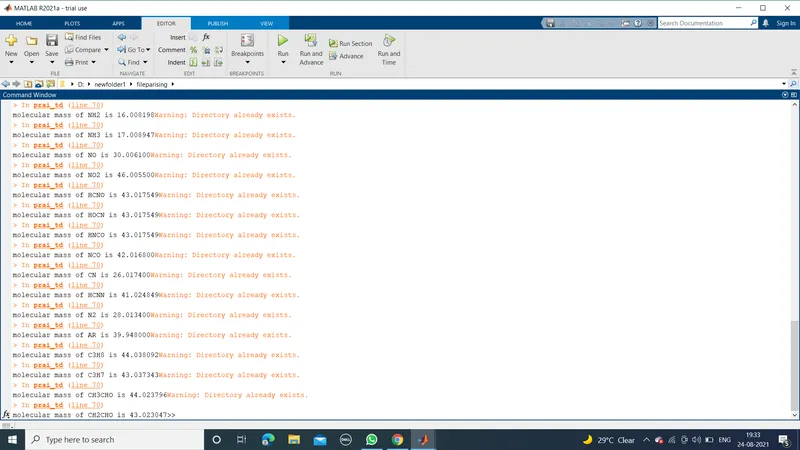
2. Calculate the molecular weight of each species and display it in the command window.
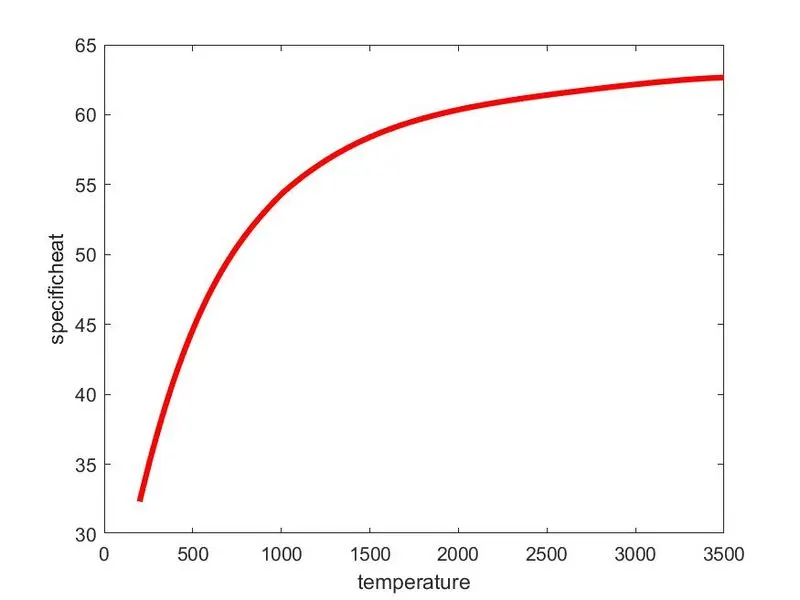
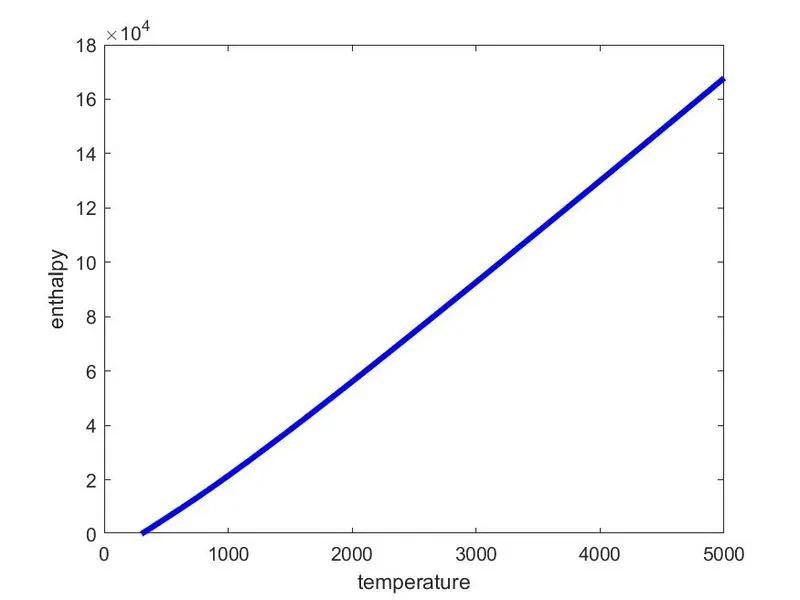
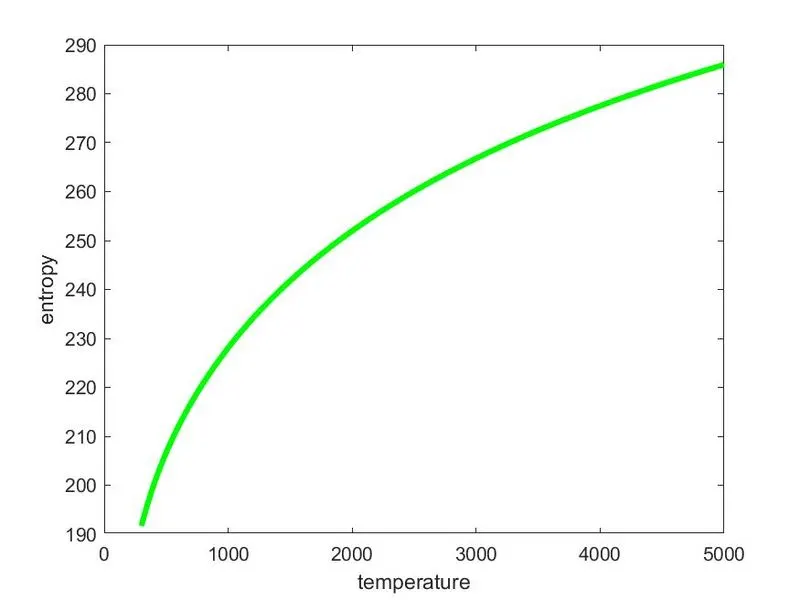
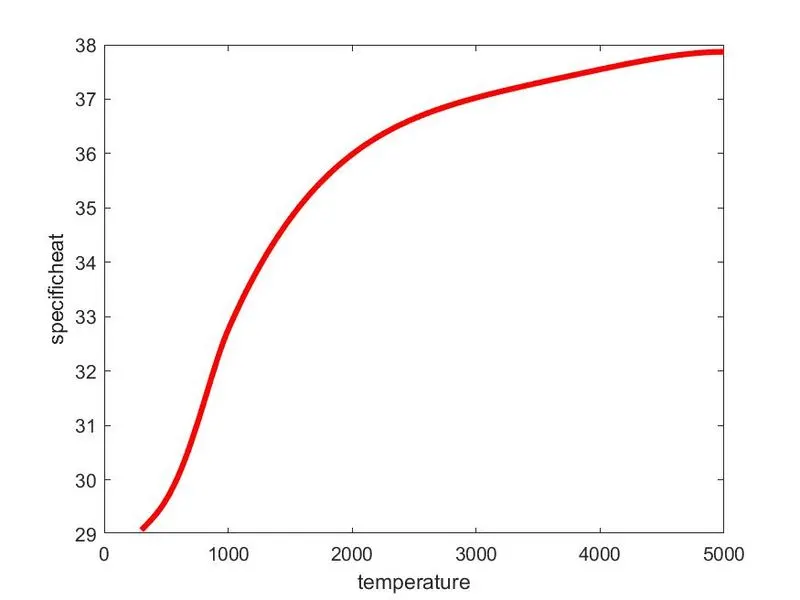
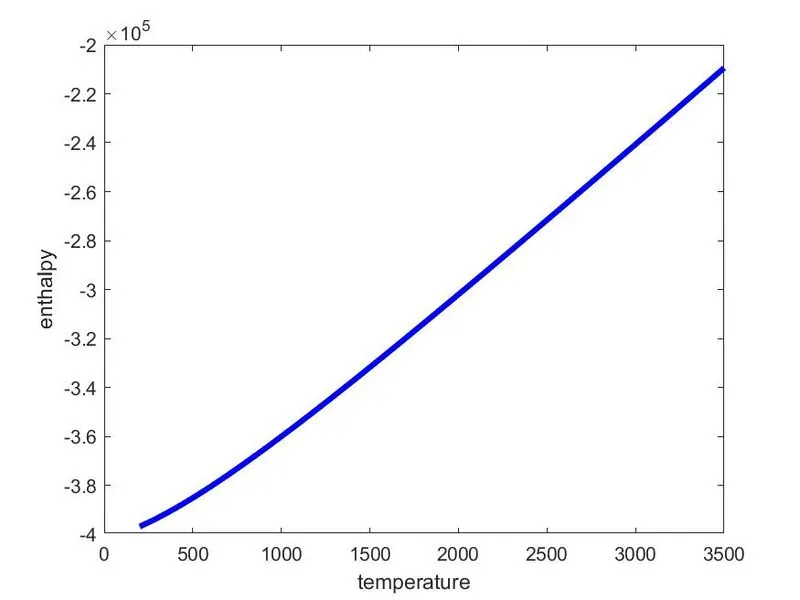
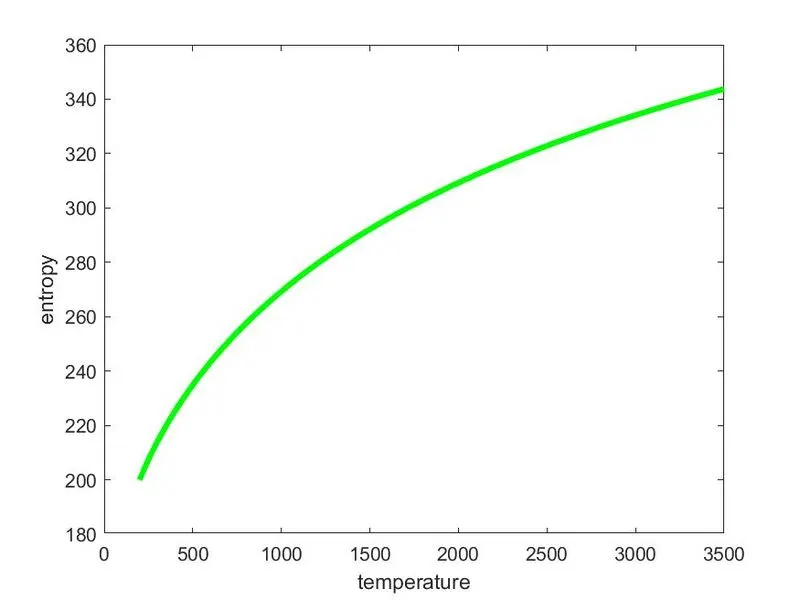
3. Plot the Cp, Enthalpy and Entropy for the local temperature range (low temperature : high temperature) specific for each species.
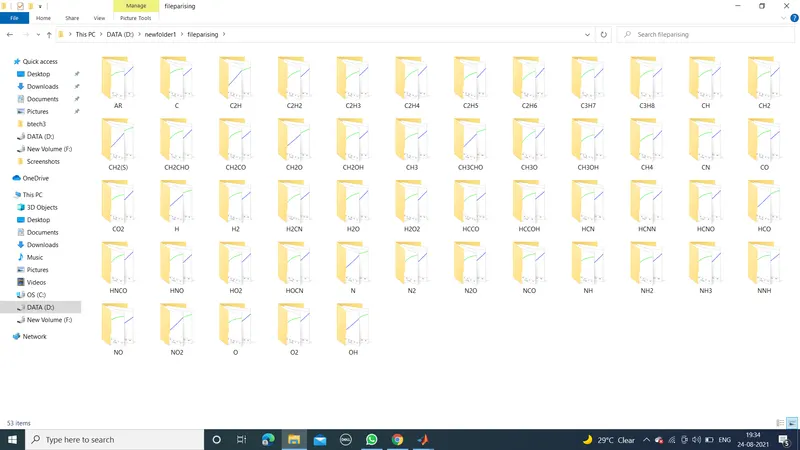
4. Save the plots as images with appropriate names and dump them in separate folders for each species with suitable name. All these should be generated automatically.
5. The main program that you will submit will just take the "THERMO.dat" file as an input and generate Cp, H and S plots.
6. write a detailed report to describe your logic.
complete code:
clear all
close all
clc
%opening of data file
file_1=fopen('THERMO.dat','r');
% header file
header=fgetl(file_1);
%skip comments
c1=fgetl(file_1);
c2=fgetl(file_1);
c3=fgetl(file_1);
c4=fgetl(file_1);
%to find local temperature for each species
for i =1:53

    local_temp=fgetl(file_1);
    l=strsplit(local_temp,' ');
    l_t=str2double(l(length(l)-3));
    h_t=str2double(l(length(l)-2));
    m_t=str2double(l(length(l)-1));
    species_name = l{1};

    line1=fgetl(file_1);
    a=strfind(line1,'E');

     a1=str2double(line1(1:a(1)+3));
     a2=str2double(line1(a(1)+4:a(2)+3));
     a3=str2double(line1(a(2)+4:a(3)+3));
     a4=str2double(line1(a(3)+4:a(4)+3));
     a5=str2double(line1(a(4)+4:a(5)+3));

     line1=fgetl(file_1);
    a=strfind(line1,'E');

     a6=str2double(line1(1:a(1)+3));
     a7=str2double(line1(a(1)+4:a(2)+3));
     a8=str2double(line1(a(2)+4:a(3)+3));
     a9=str2double(line1(a(3)+4:a(4)+3));
     a10=str2double(line1(a(4)+4:a(5)+3));

     line1=fgetl(file_1);
    a=strfind(line1,'E');

     a11=str2double(line1(1:a(1)+3));
     a12=str2double(line1(a(1)+4:a(2)+3));
     a13=str2double(line1(a(2)+4:a(3)+3));
     a14=str2double(line1(a(3)+4:a(4)+3));

 T= linspace(l_t,h_t,1000);
 cp = zeros(1,1000);
 h = zeros(1,1000);
 s = zeros(1,1000);
 for j = 1:length(T)
     [cp(j), h(j), s(j)] = specificheat(a1,a2,a3,a4,a5,a6,a7,a8,a9,a10,a11,a12,a13,a14,m_t,T(j));
 end
 %crearting figures by using plotting
     figure(1)
     plot(T,cp,'linewidth',3,'color','r')
     xlabel('temperature')
     ylabel('specificheat')
     figure(2)
     plot(T,h,'linewidth',3,'color','b')
     xlabel('temperature')
     ylabel('enthalpy')
     figure(3)
     plot(T,s,'linewidth',3,'color','g')
     xlabel('temperature')
     ylabel('entropy')
     %create folder
     mkdir(species_name);
     cd(sprintf(species_name));

     %saving plot
     saveas(1,'specificheat.jpg');
     saveas(2,'enthalpy.jpg');
     saveas(3,'entropy.jpg');
     cd('D:\newfolder1\fileparising')


     %to find molecular mass
     mm=molecular_mass(species_name);
         fprintf('molecular mass of %s is %f',species_name,mm)

end
%function for molecular mass
 function mm=molecular_mass(species_name)
% species=upper(species_name);
constituents=['H','C','N','O','A'];
atomic_weight=[1.000749 12.0107 14.0067 15.9994 39.948];
mm=0;
for i=1:length(species_name)
    for j=1:length(atomic_weight)
        if strcmp(species_name(i),constituents(j))
            mm=mm+atomic_weight(j);
            u=j;
        end
    end
    n=str2double(species_name(i));
    if n>1
        mm=(mm+atomic_weight(u)*(n-1));
    end
end
 end
 %function for finding enthalpy entropy specificheat

function [cp,h,s] = specificheat(a1,a2,a3,a4,a5,a6,a7,a8,a9,a10,a11,a12,a13,a14,m_t,T)
R = 8.314;
if T>m_t
    cp = (a1+a2*T+a3*T^2+a4*T^3+a5*T^4)*R;

    h = (a1+a2*T/2+a3*T^2/3+a4*T^3/4+a5*T^4/5+a6/T)*R*T;

    s = (a1*log(T)+a2*T+a3*T^2/2+a4*T^3/3+a5*T^4/4+a7)*R;
else
    cp= (a8+a9*T+a10*T^2+a11*T^3+a12*T^4)*R;

      h = (a8+a9*T/2+a10*T^2/3+a11*T^3/4+a12*T^4/5+a13/T)*R*T;


    s = (a8*log(T)+a9*T+a10*T^2/2+a11*T^3/3+a12*T^4/4+a14)*R;
end
end
code logic:
first we write clear all close all and clc commands to close the previously running applications
the i followed some steps for main program
step1:
%opening of data file by using fopen command to open the required thermo.dat file to read it and then to include header in thermo file we use fgetl command to access the line and then again we use the fgetl command to obtain next lines with same command used successively if they are not required we can skip them
step2:
for finding local temperature of each species we splited the every line with definite data by using splitstrcommand and then convert the low medium high temperature from string form to double form to process the calculations by using str2double.
and also for we have 14cofficients divided for low med high we have to access them
by using fgetl in each line and also we have a character between two double characters so we have to find the double values to access them we use strfind command by using specific adress
in which we stored stored the strfind variable.so we find out the 14values for each species .
by using linspace command we created the temperature range betwenn low and high temp
step3:
we have to create seperatley the molecularmass function and also function for specificheat entropy and enthaply to cvaliculate and then add them to the main program at the end
in molecular mass it contains the following code to caliculate the molecular mass for ecah species
%function for molecular mass
 function mm=molecular_mass(species_name)
% species=upper(species_name);
constituents=['H','C','N','O','A'];
atomic_weight=[1.000749 12.0107 14.0067 15.9994 39.948];
mm=0;
for i=1:length(species_name)
    for j=1:length(atomic_weight)
        if strcmp(species_name(i),constituents(j))
            mm=mm+atomic_weight(j);
            u=j;
        end
    end
    n=str2double(species_name(i));
    if n>1
        mm=(mm+atomic_weight(u)*(n-1));
    end
and function for caluclating:
specificheat entropy and enthaply to cvaliculate and then add them to the main program at the end
function [cp,h,s] = specificheat(a1,a2,a3,a4,a5,a6,a7,a8,a9,a10,a11,a12,a13,a14,m_t,T)
R = 8.314;
if T>m_t
    c = (a1+a2*T+a3*T^2+a4*T^3+a5*T^4)*R;

    h = (a1+a2*T/2+a3*T^2/3+a4*T^3/4+a5*T^4/5+a6/T)*R*T;

    s = (a1*log(T)+a2*T+a3*T^2/2+a4*T^3/3+a5*T^4/4+a7)*R;
else
    cp= (a8+a9*T+a10*T^2+a11*T^3+a12*T^4)*R;

      h = (a8+a9*T/2+a10*T^2/3+a11*T^3/4+a12*T^4/5+a13/T)*R*T;


    s = (a8*log(T)+a9*T+a10*T^2/2+a11*T^3/3+a12*T^4/4+a14)*R; p
end
end
we divide the cofficiets based on high medium and low temperatures for temperature greater than medium we consider it high temperature and divide as per required formula i.e
The FIRST 7 coefficients are HIGH-temperature coefficients and the SECOND 7 coefficients are LOW-temperature coefficients.
step4:
after that we have to take for loop for each species we have to caliculate the cp,h,s individuavally
step5:
creating plot for enthalphy vs temp
entropy vs temp
specific heat vs temp
for each species we create three figures for plotting above variables by using plotting command
step6:
creating folder and saving plots:
we have to create the folder by using mkdir for which each species with their name is created so that we can accesss it by saving them in that folder with respective graph names.
after we have to write the molecular mass names in command windpow by using fprintf function to be created in the molecular mass function
therfore final output is obtained
errors occured:
error1:
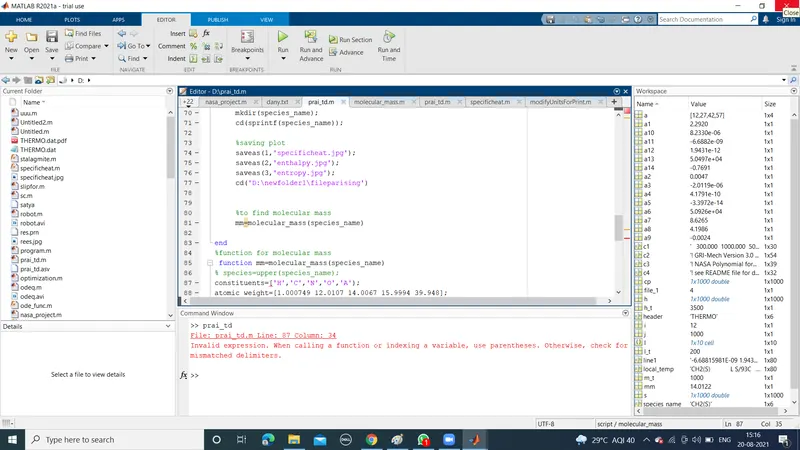
in this stage i missede the paranthesis rather i used square brackets so i found the error
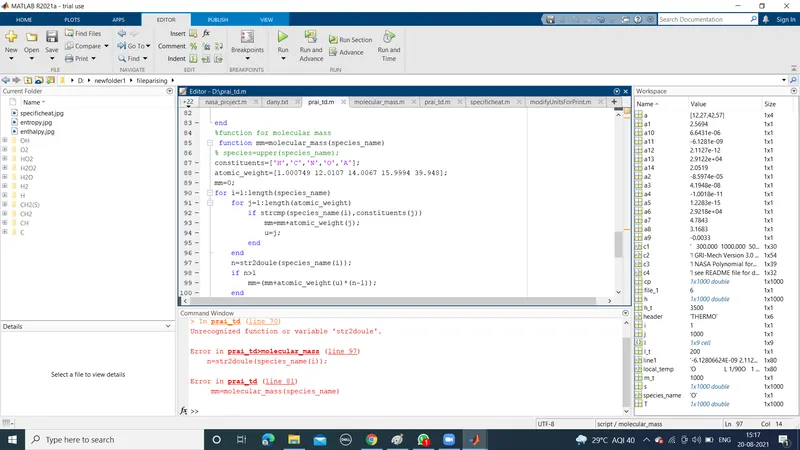
i wrongly write the str2double so i found the error while executing
overcoming errors:
after i found the errors i sucessfully overcome these errors
final outputs:
each and everey molecular mass is caliculated:
folders created for each element automatically:
workspace elements:
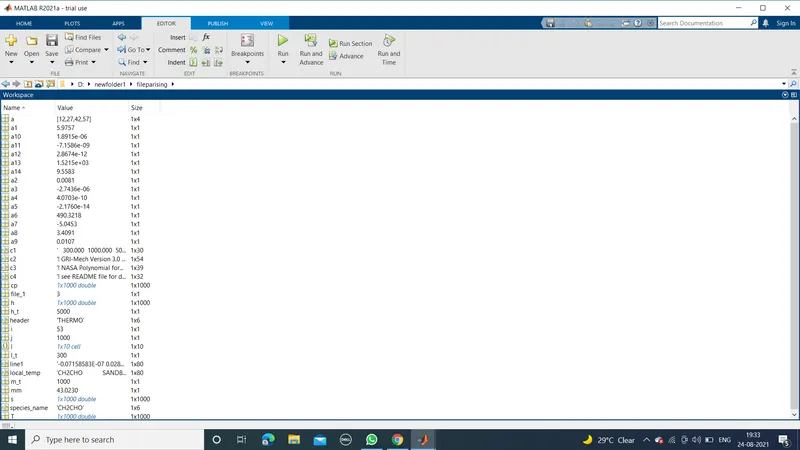
output graphs for O2,N2,CO2
FOR O2:
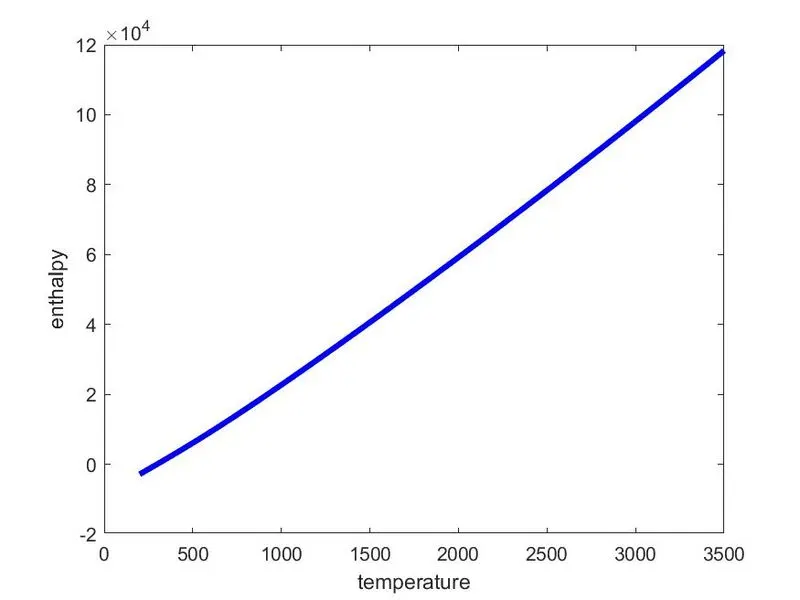
ENTHAPLY VS TEMPERATURE
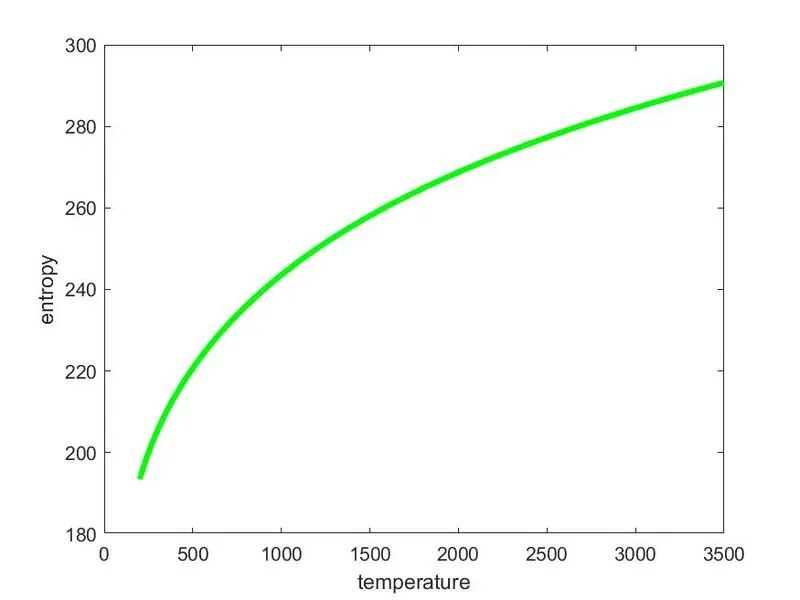
ENTROPY VS TEMPERTURE:
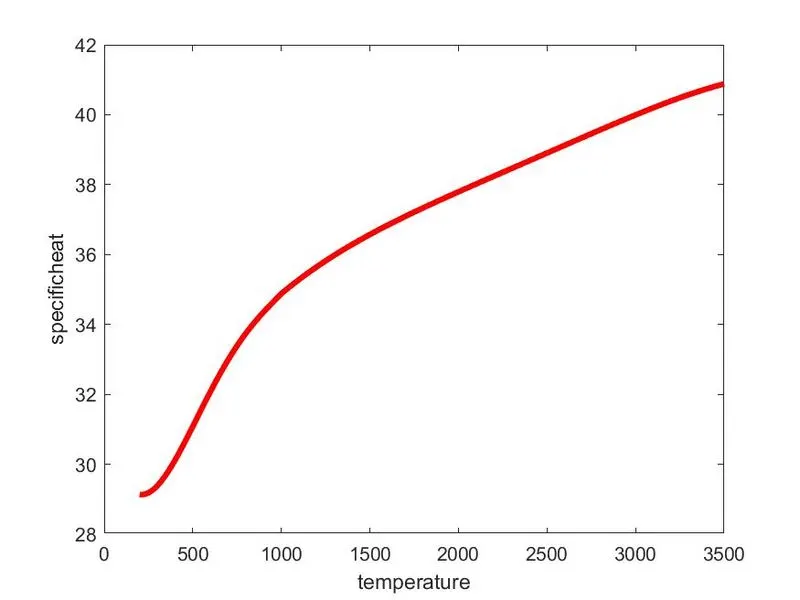
SPECIFIC HEAT VS TEMPERATURE:
FOR N2 GRAPHS
ENTHAPLY VS TEMPERATURE:
ENTROPY VS TEMPERTURE:
SPECIFIC HEAT VS TEMPERATURE:
FOR CO2 SPECIES:
ENTHAPLY VS TEMPERATURE:
ENTROPY VS TEMPERTURE:
SPECIFIC HEAT VS TEMPERATURE: