Week 2 Air standard Cycle
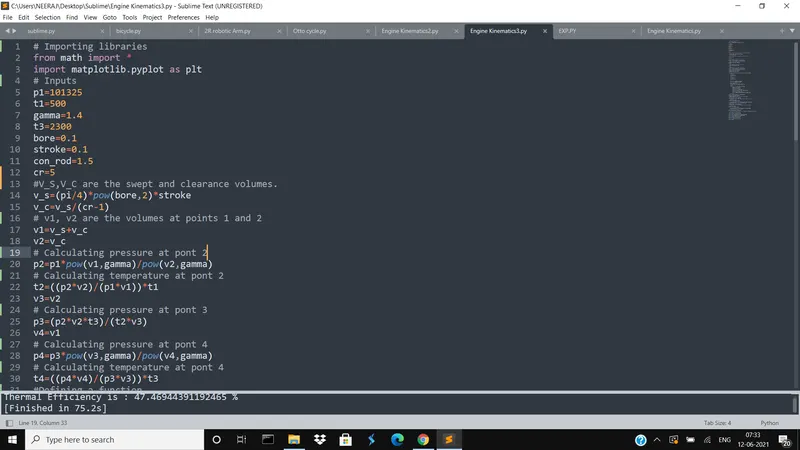
# Importing libraries
from math import *
import matplotlib.pyplot as plt
# Inputs
p1=101325
t1=500
gamma=1.4
t3=2300
bore=0.1
stroke=0.1
con_rod=1.5
cr=5
#V_S,V_C are the swept and clearance volumes.
v_s=(pi/4)*pow(bore,2)*stroke
v_c=v_s/(cr-1)
# v1, v2 are the volumes at points 1 and 2
v1=v_s+v_c
v2=v_c
# Calculating pressure at pont 2
p2=p1*pow(v1,gamma)/pow(v2,gamma)
# Calculating temperature at pont 2
t2=((p2*v2)/(p1*v1))*t1
v3=v2
# Calculating pressure at pont 3
p3=(p2*v2*t3)/(t2*v3)
v4=v1
# Calculating pressure at pont 4
p4=p3*pow(v3,gamma)/pow(v4,gamma)
# Calculating temperature at pont 4
t4=((p4*v4)/(p3*v3))*t3
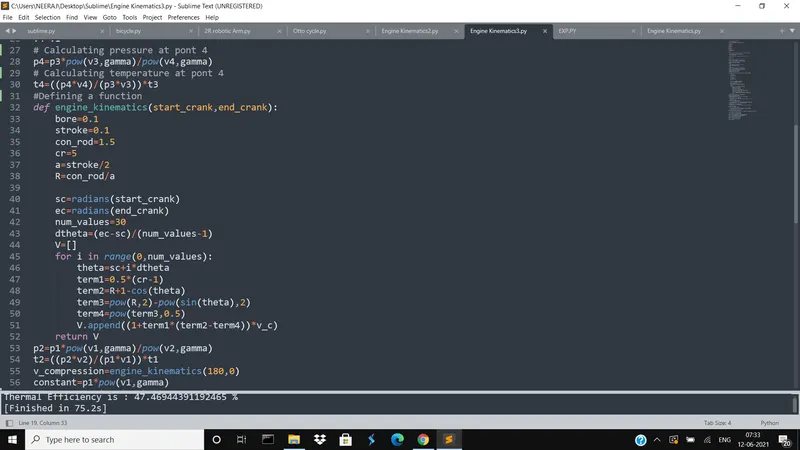
#Defining a function
def engine_kinematics(start_crank,end_crank):
	bore=0.1
	stroke=0.1
	con_rod=1.5
	cr=5
	a=stroke/2
	R=con_rod/a

	sc=radians(start_crank)
	ec=radians(end_crank)
	num_values=30
	dtheta=(ec-sc)/(num_values-1)
	V=[]
	for i in range(0,num_values):
		theta=sc+i*dtheta
		term1=0.5*(cr-1)
		term2=R+1-cos(theta)
		term3=pow(R,2)-pow(sin(theta),2)
		term4=pow(term3,0.5)
		V.append((1+term1*(term2-term4))*v_c)
	return V
p2=p1*pow(v1,gamma)/pow(v2,gamma)
t2=((p2*v2)/(p1*v1))*t1
v_compression=engine_kinematics(180,0)
constant=p1*pow(v1,gamma)
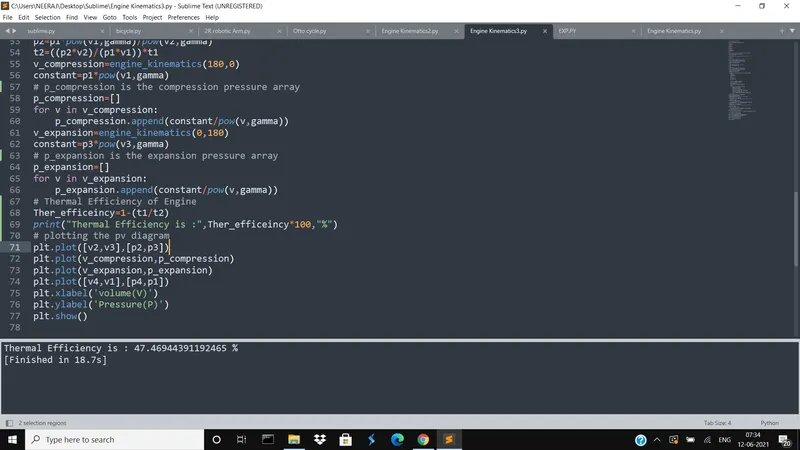
# p_compression is the compression pressure array
p_compression=[]
for v in v_compression:
	p_compression.append(constant/pow(v,gamma))
v_expansion=engine_kinematics(0,180)
constant=p3*pow(v3,gamma)
# p_expansion is the expansion pressure array
p_expansion=[]
for v in v_expansion:
	p_expansion.append(constant/pow(v,gamma))
# Thermal Efficiency of Engine
Ther_efficeincy=1-(t1/t2)
print("Thermal Efficiency is :",Ther_efficeincy*100,"%")
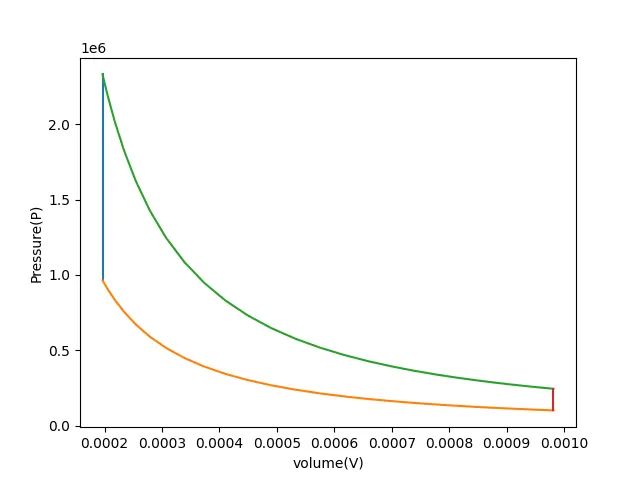
# plotting the pv diagram
plt.plot([v2,v3],[p2,p3])
plt.plot(v_compression,p_compression)
plt.plot(v_expansion,p_expansion)
plt.plot([v4,v1],[p4,p1])
plt.xlabel('volume(V)')
plt.ylabel('Pressure(P)')
plt.show()
CODE EXPLANATION:
1. In Developing this code the first step is importing the math and matplotlib.pyplot modules.
2. p1,v1, and t1 represent the pressure, volume, and temperature at point 1.
3. p2,v2, and t2 represent the pressure, volume, and temperature at point 2.
4. p3,v3, and t3 represent the pressure, volume, and temperature at point 3.
5. p4,v4, and t4 represent the pressure, volume, and temperature at point 4.
5. V_S, V_C represent the swept volume and clearance volume.
6. The Geometrical inputs are also given.
7. Defined a function engine_kinematics to generate different crank angles.
9. Then by using pyplot command plotted the PV diagram.
8. Ther_efficeincy represents the thermal efficiency.