Week 2- 2R Robotic Arm Challenge
Aim:- MATLAB program for simulation of the forward kinematics of 2R robotic arm.
Introduction:- In Industries like automatics industries and aviation all the process like welding & painting are automatics. Theseall process now automatical done by robots. so at the design stage of robots designer need to show the workspace (range upto which robot can be reach or simply possible location where robot can reach), for that sofware like MATLAB help designer to creat a program to know the range of robot by inserting different size of robotic arm & different angle of robotic arm with reference to surface.
In 2R robotic arm contains 2 links, Link-1 & Links-2. Link1 makes an angle theta1 & Link2 make an angle of theta2 with respect to x-axis respectively. Let us say length of Link-1 is L1 & length of Link-2 is L2. If theta1 & theta2 given what is the final position of the manipulator.
Code:-
% A program to simulate the forward kinematics of 2R robotic arm
% Step-1
clear all
close all
clc
% Step-2
% Taking inputs
L1 = 1; % Length of link-1
L2 = 0.5: % Length of link-2
theta1 = linspace(0,90,10); % Angle traced by Link-1
theta2 = linspace(0,90,10); % Angle traced by Link-2
% Step-3
ct=1
for i = 1:length(theta1)
THETA1 = theta1(i) % Taking particular value of angle traced by Link-1
for j = 1:length(theta2)
THETA2 = theta2(j) % Taking particular value of angle traced by Link-2
% Step-4
% Calculate the positions of links
% Initialising starting co-ordinates of Link1
% Starting point of Link-1 is fix
xo = 0;
yo = 0;
% Calculate the co-ordinates of end point of Link-1
x1 = L1*cosd(THETA1);
y1 = L1*sind(THETA1);
% Starting point of Link-2 = end point of Link-1
% Calculate the co-ordinates of end point of Link-2
x2 = x1 + L2*cosd(THETA2);
y2 = y1 + L2*sind(THETA2);
% Step-5
% Plotting the robotics arm for simulation
plot([x0 x1], [y0 y1],'linewidth',3,'color','b', [x1 x2], [y1 y2], 'linewidth',3, 'color','o');
% Step-6
% Set the limits of axis
axis([-0.1 0.5 0 1.5]);
% Step-7
% Puasing the current plot for while before moving % to next plot
Pause(0.03)
% Step-8
% Capture the current plot to combine later
M(ct) = getframe(gcf);
% Step-9
% Incrementing ct to that each frame is capture in M
ct=ct+1
% Step-10
% end all the loops
end
end
% Step-11
% Creating video file in avi formate
Movie(M)
videofile = VideoWriter('forward_kinematics.avi'. Uncompressed AVI)
open(videofile)
writeVideo(videofile, M)
close(videofile)
Explanation:-
Step-1
Clear all the previous value, close all the previous output and clear all the cammands.
Step-2
Insert the known value of input parameter, put value of Link-1 & Link-2 also insert the angles bo both the links with respect to horizontal axis.
by using linspace command, 10 values for theta will be calulated, which is starting from 0 to 90 degrees.
Step-3
for i = 1:length(theta1);
plot can be generated for diffurent value of theta by manually changing the value (if linspace command is not use) but it is trediou work to make it automatica we will use for loop function(it repeats the set of action again & again)
value of i will be change from 1 to the length(theta), length(theta) is nothing but all the 10 theta value between 0 to 90 degree, which is generated by linspace command.
THETA = theta(i);
THETA1 is a variable (contains only one variable), where as theta1 is a array(contains 10 value of theta from 0 to 90 degree), i is loop which determine how many times for loop get executed.
Step-5
To find the value of stating and ending point of Link-1 & Link-2, use trignometric relationship.
Step-6
By this command plot will be generated, in which linewidth and color is specified for particular link
Step-7
This command is used for fixing the work area in the graph.
Step-8
This command is use to pausing the plot to combine later.
Step-9
This command is use to increment the for loop execution.
Step-10
close all the loop
Step-11
Creating a video file of '.avi' formate to save the animation, then write the movie in the videofile created finally close the videofile to end the program.
Errors:-
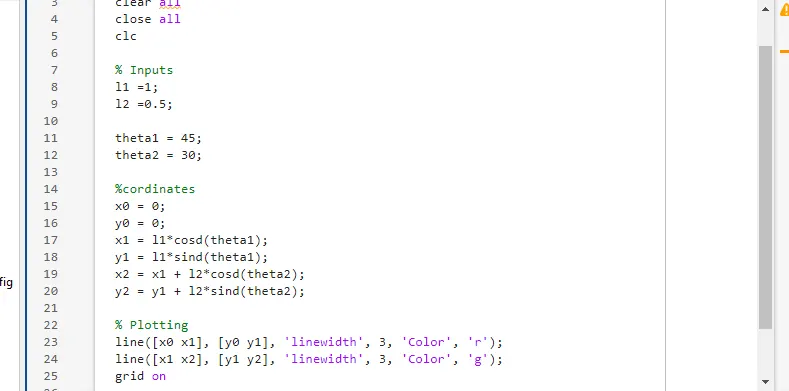
1) Initial type a program link below image, so i get only one plot of 2-links, that is only happend when i change the value of theta1 & theta2 manually. So this in not a prefereble solution so that i decided to use linspace mammand.
2) for i = 1:length(theta1);
plot can be generated for diffurent value of theta by manually changing the value (if linspace command is not use) but it is trediou work to make it automatica we will use for loop function(it repeats the set of action again & again)
value of i will be change from 1 to the length(theta), length(theta) is nothing but all the 10 theta value between 0 to 90 degree, which is generated by linspace command.
THETA = theta(i);
THETA1 is a variable (contains only one variable), where as theta1 is a array(contains 10 value of theta from 0 to 90 degree), i is loop which determine how many times for loop get executed.
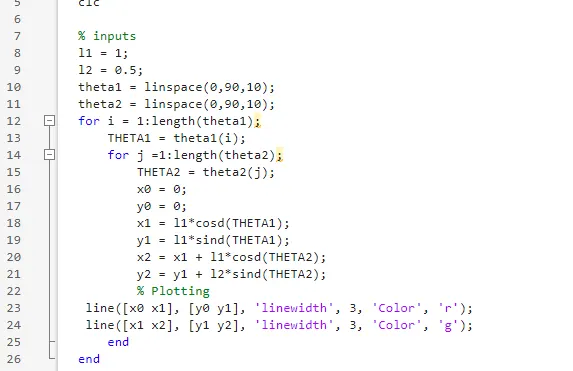
but use of this code again i got the cazy plot & visualizing one specific link in a some plot is very difficult.
3) To overcome above proble i am using figure counter (ct) cammand,
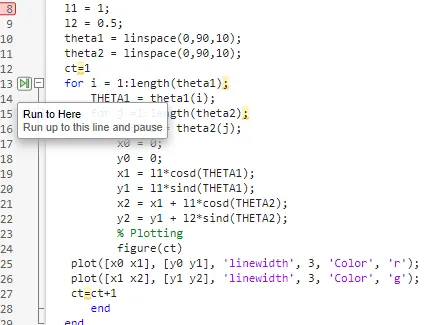
each time counter get excuted it get incremented. But againt i got 10 different plots. so next i do is convert line command into plot command and excuted i got same good solution but again dispaly 10 different plots.
To overcome above proble i used "pause" & "hold on" command, so i got some better plot.
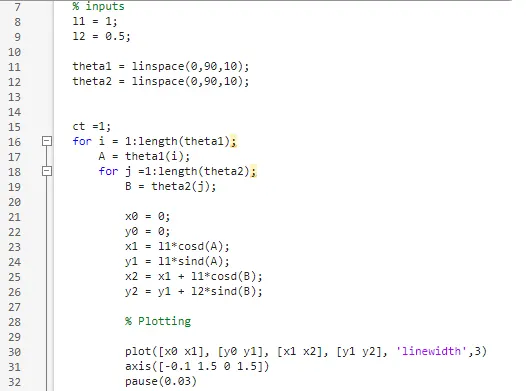
5) finally i decide to use line command and place all starting & ending value of x & y. Then got a better solution. Next i stored this file in .avi formate with use of videowriter cammand.
Youtub link:-
https://youtu.be/COSx-faXWwo