Week 2- 2R Robotic Arm Challenge
ANIMATION FOR 2R ROBOTIC ARM
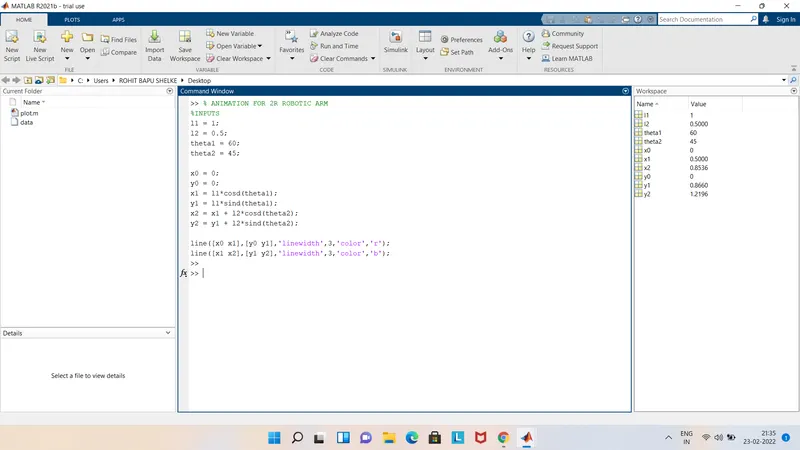
Before animating the robotic arm, we will create a simple plot or graph at some fixed theta or degree. here, theta1 is taken as 60 degree and theta2 is taken as 45 degree
%INPUTS
l1 = 1;
l2 = 0.5;
theta1 = 60;
theta2 = 45;
Below are the positions of starting point of arm1(x0,y0) and ending point of arm1(x1,y1)
and starting point of arm2(x1,y1) and ending point of arm2(x2,y2); but start point of arm2 is same as end point of arm1.
x0 = 0;
y0 = 0;
x1 = l1*cosd(theta1);
y1 = l1*sind(theta1);
x2 = x1 + l2*cosd(theta2);
y2 = y1 + l2*sind(theta2);
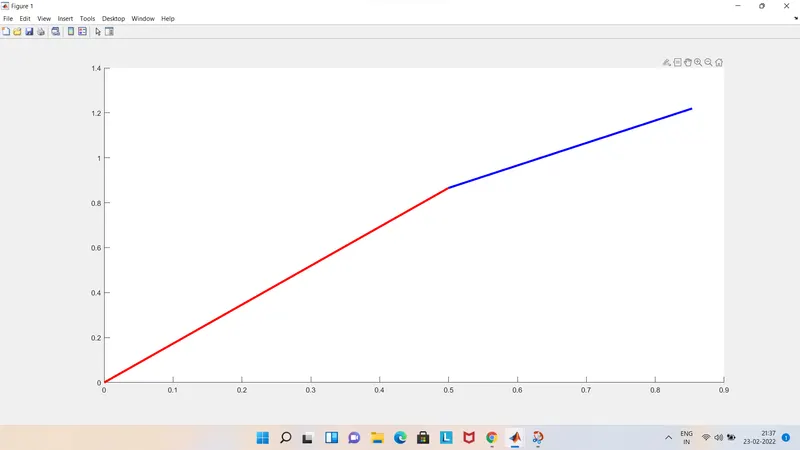
Plotting lines on graph in order to observe positions of (arm 1) and (arm 2) at 60 and 45 degree.
line([x0 x1],[y0 y1],'linewidth',3,'color','r');
line([x1 x2],[y1 y2],'linewidth',3,'color','b');
after running above code, the result obtained is recorded as screenshot attached below.
ANIMATION CODE
we have created a plot only for one fixed angle of arm1 and arm2. but if we want to study how arms will be moving , what all positions it can take. we will have to create animation for it.
the folllowing code helps us to observe various positions of arms .
%INPUTS
l1 = 1;
l2 = 0.5;
theta1 = linspace(0,90,10);
theta2 = linspace(0,90,10);
we have taken values for theta 1 and theta 2 between 0 to 90 degree.
ct = 1;
for i = 1:length(theta1);
THETA1 = theta1(i);
for j = 1:length(theta2);
THETA2 = theta2(j);
we have used here loop syntax, because we want to obsereve various positions of arms. firstly we have loop for theta1. so for all 10 values of theta1 between 0 to 90 are created, but we have arm2 also, using loop again, we will able to observe next 10 values between 0 to 90 for theta2. we have loop for theta2 in loop of theta1. it means we can study every possible position of arms due to this code.
x0 = 0;
y0 = 0;
x1 = l1*cosd(THETA1);
y1 = l1*sind(THETA1);
x2 = x1 + l2*cosd(THETA2);
y2 = y1 + l2*sind(THETA2);
now finally, we have to plot. we cant use line syntax because we want animation. so using plot syntax we will able to see animation. plotting various points(start and end) of arm1 and arm2, and fixing axis to a certain length and setting time interval are the important parameters used for animating.
plot([x0 x1],[y0 y1], [x1 x2],[y1 y2],'linewidth',3);
axis([-0.1 1.5 0 1.5]);
pause(0.1);
end
end
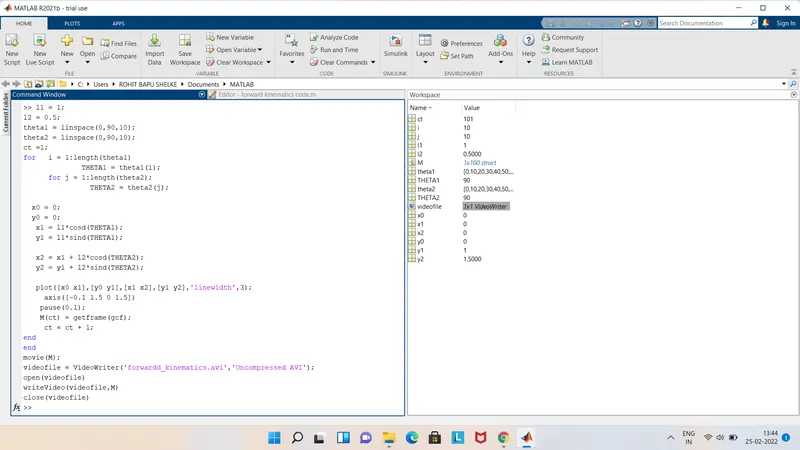
the following screenshot shows the ,above code ran in matlab for animation!
>>> >>> LINK FOR YOU TUBE: https://youtu.be/yfzfOoA_hPw