Week 12 - Validation studies of Symmetry BC vs Wedge BC in OpenFOAM vs Analytical H.P equation
Introduction :-
As said, the work done here is the second part of our project about the simulation of flow through a pipe. Thus, the numerical set-up is done using appropriate initial conditions which are same as the one in the first part. The simulation is done using both symmetry and wedge boundary conditions and the results are validated using Hagen Poiseuille’s equation. The only difference is that the wedge angles are 10°, 25° and 45°. In order to run the simulation for all wedge angles, MATLAB is used to generate a blockMesh file with vertices corresponding to wedge angle value.The case is run using icoFoam in OpenFOAM and post-processed in paraview.
The objectives pursued in this part are same as in the first part added to the fact that we have to highlight the difference between in both boundary conditions in terms of their usage and application.
Post-processing :-
For 45°
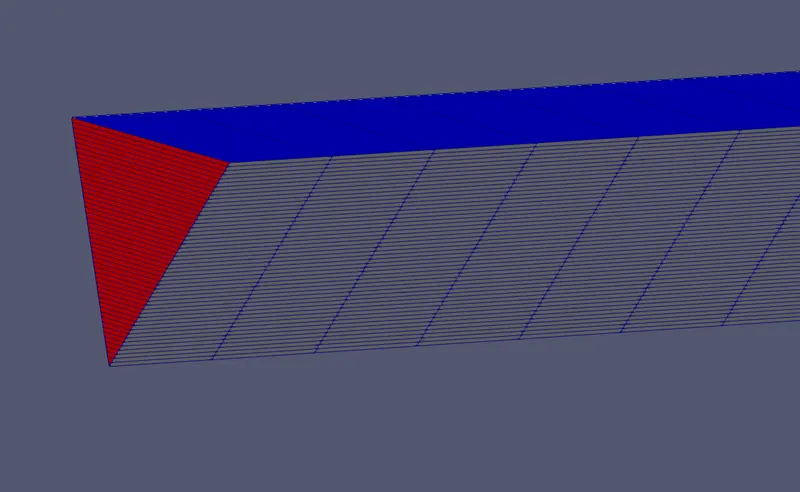
- Mesh
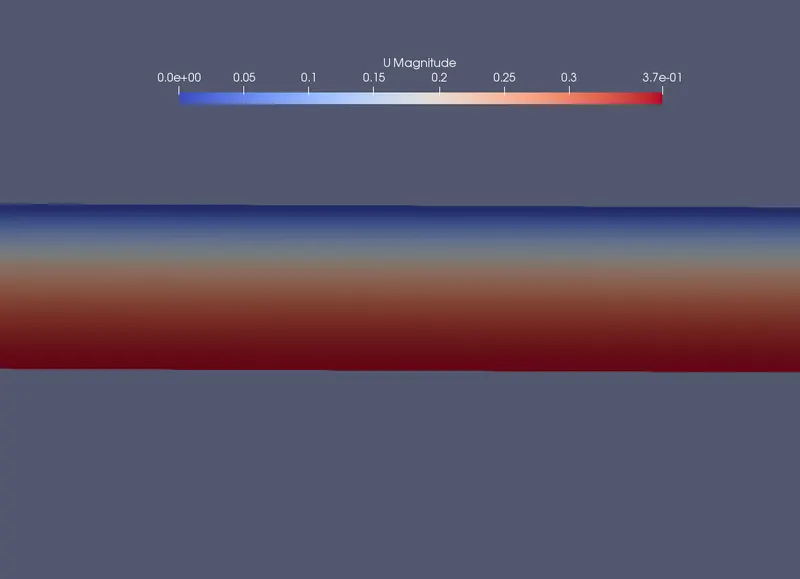
- Velocity distribution along the Pipe
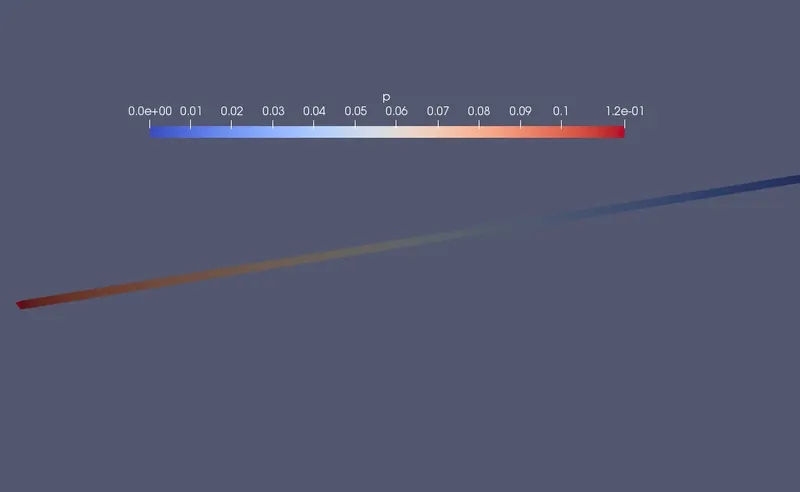
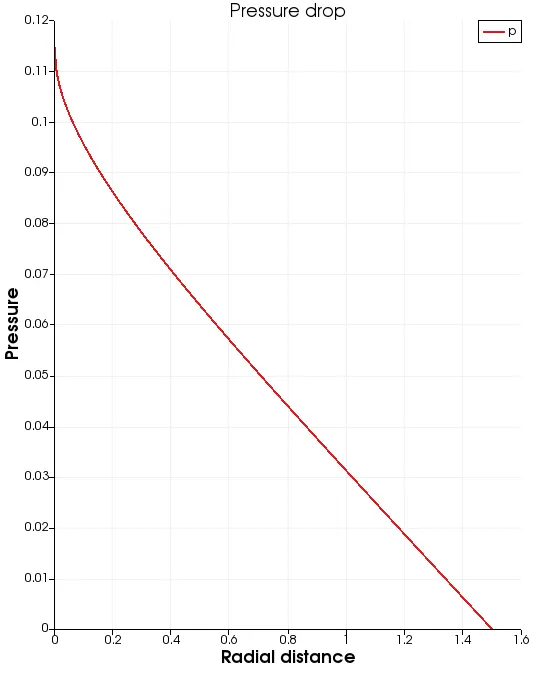
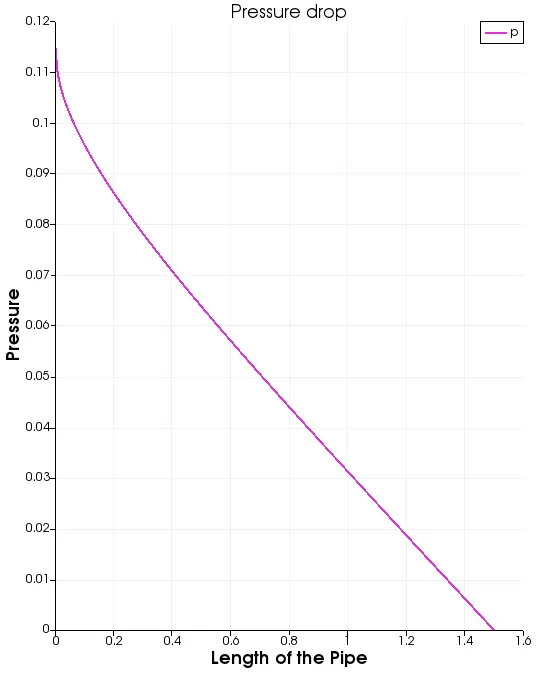
- Pressure distribution along the pipe
For 25°
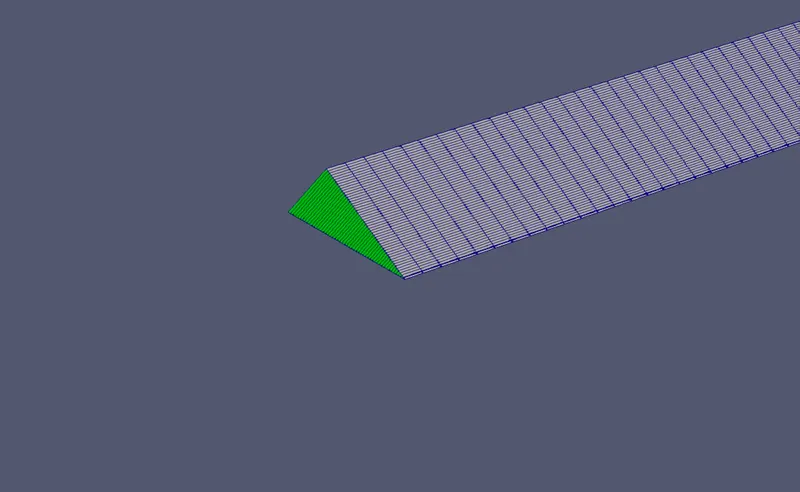
- Mesh
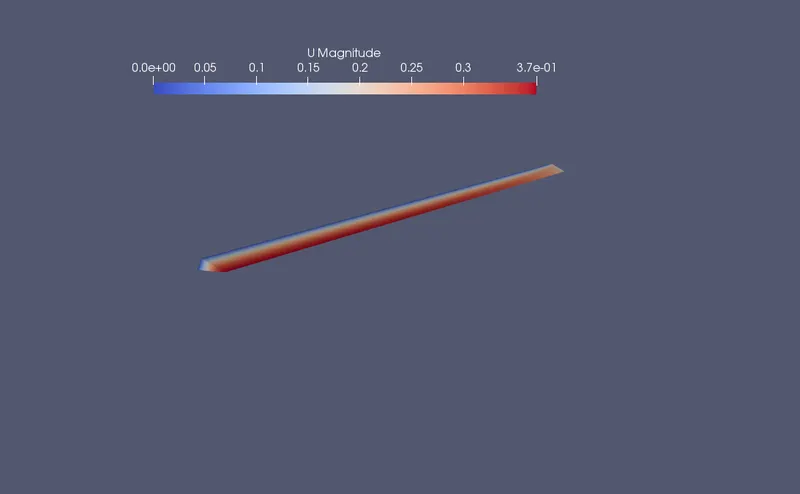
- Velocity distribution along the Pipe
- Pressure distribution along the pipe
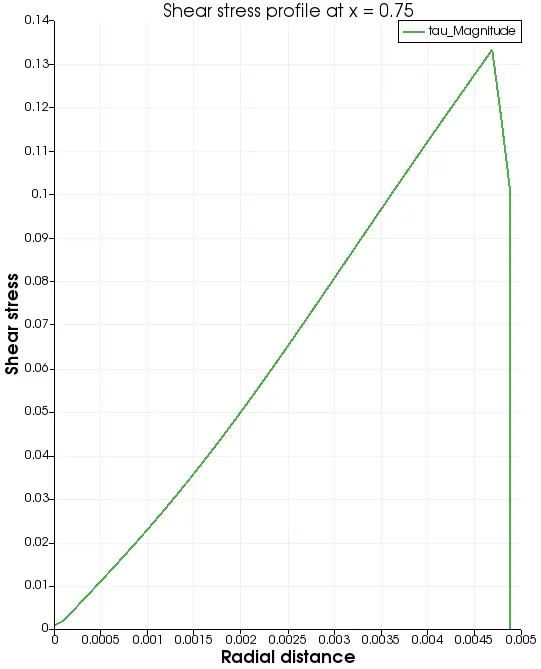
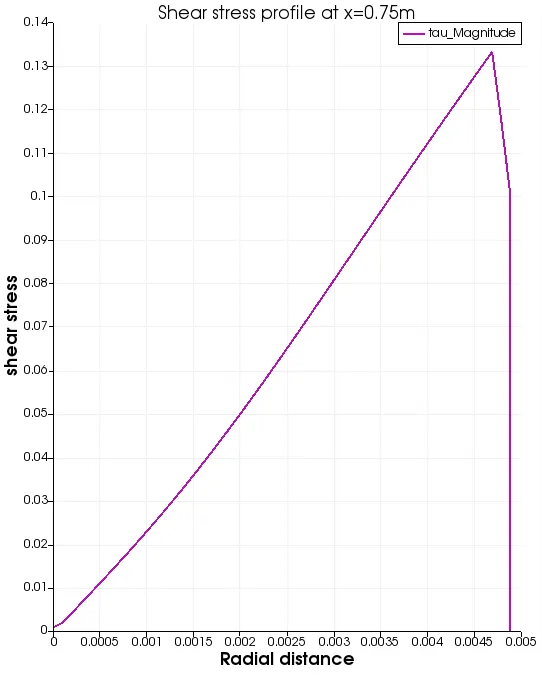
For 10°
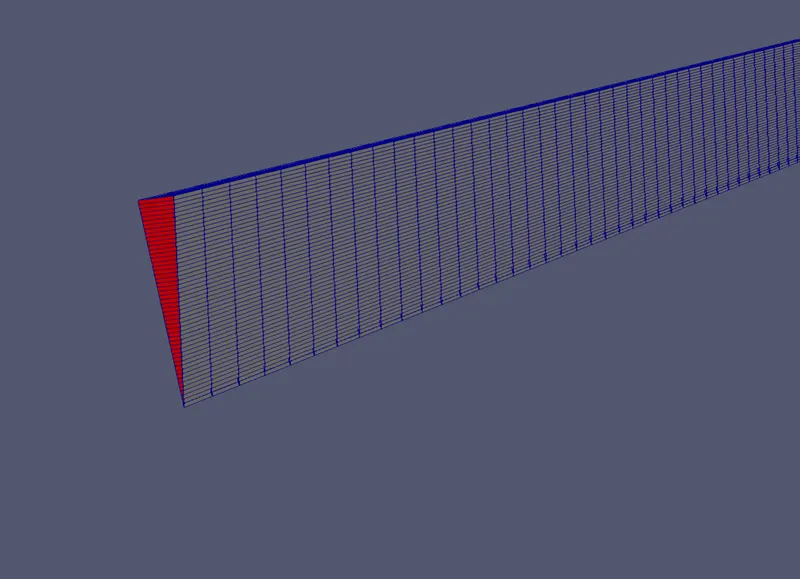
- Mesh
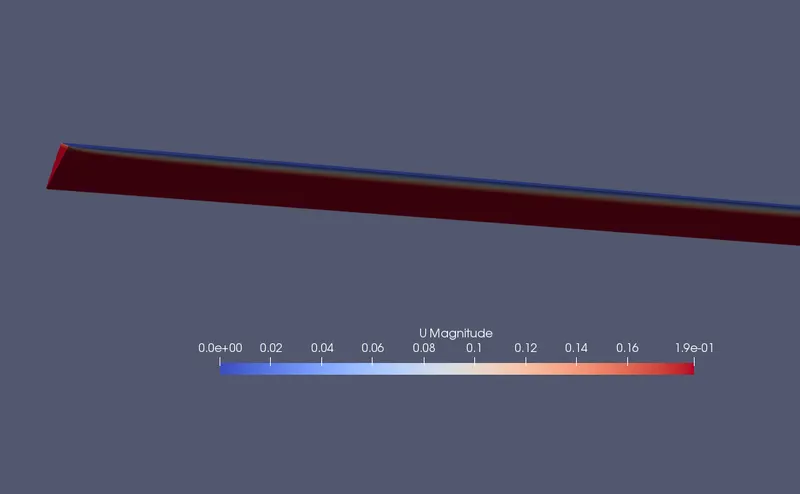
- Velocity distribution along the Pipe
- Pressure distribution along the pipe
Discussion :-
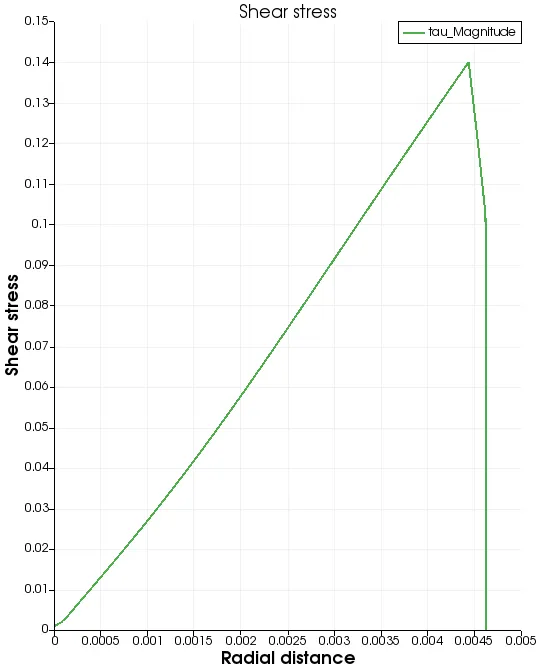
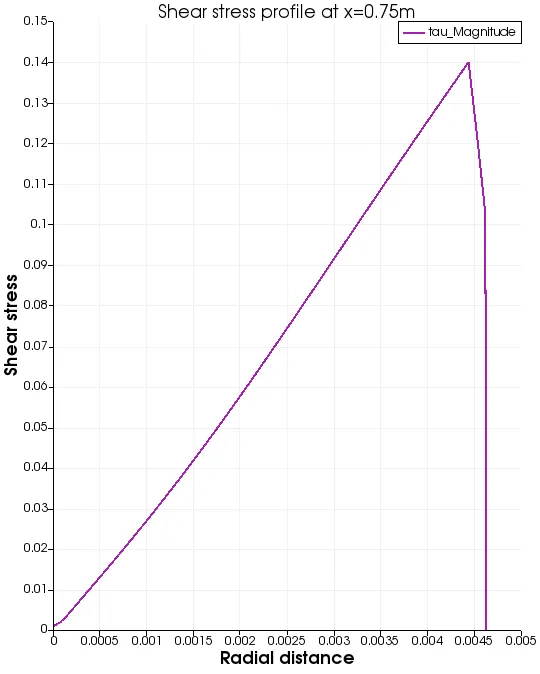
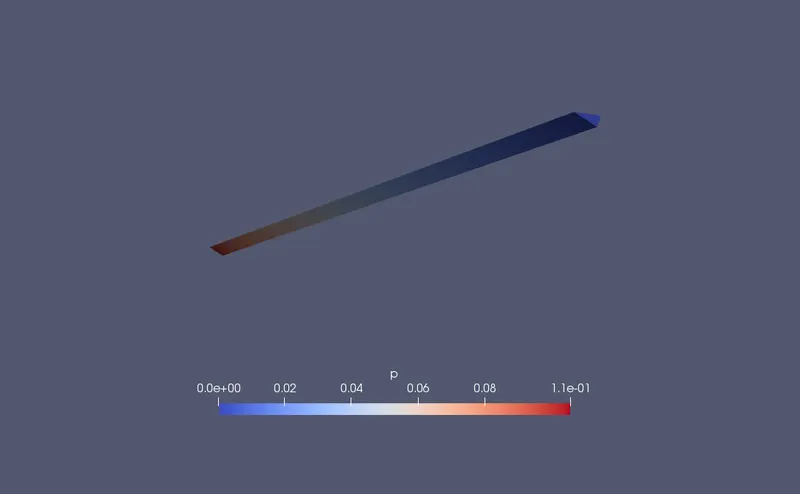
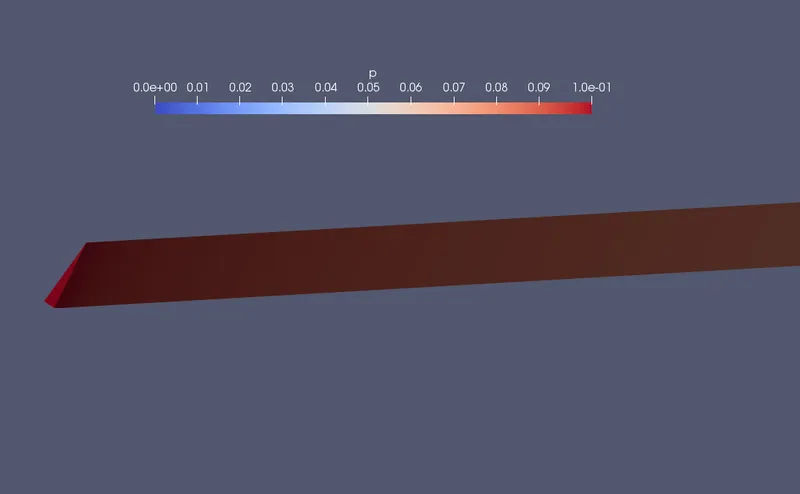
The above figures and graphs are the post-processing results in paraview. A look comparative look to the corresponding results to the three different wedge angle values let us notice some little difference hence it urges to discuss each type of results.
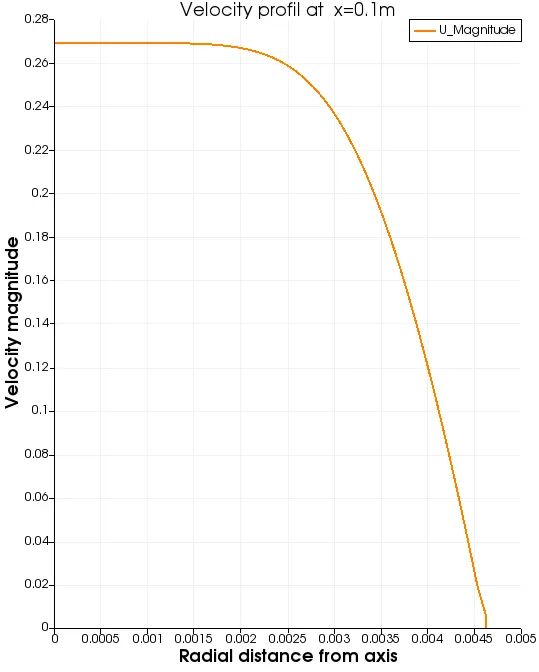
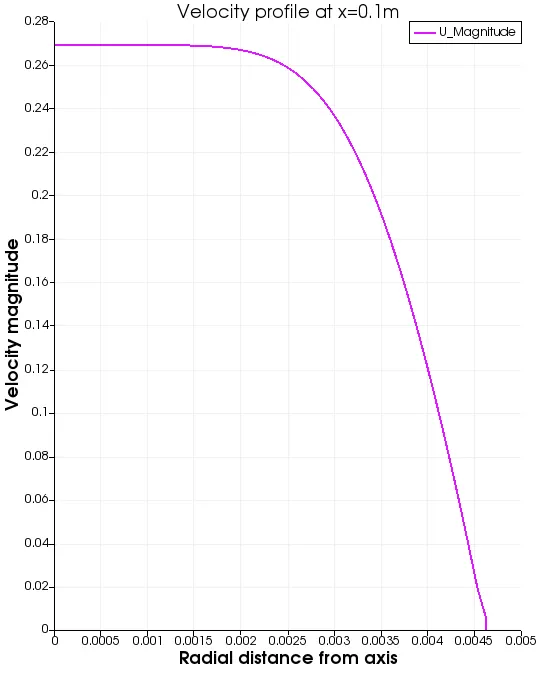
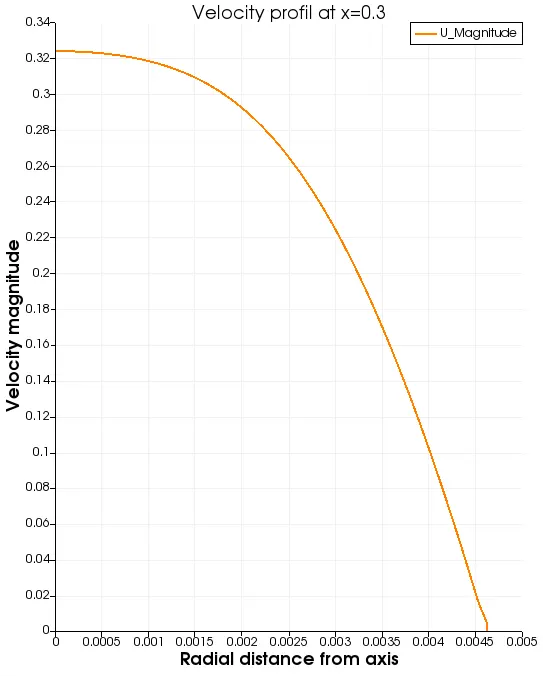
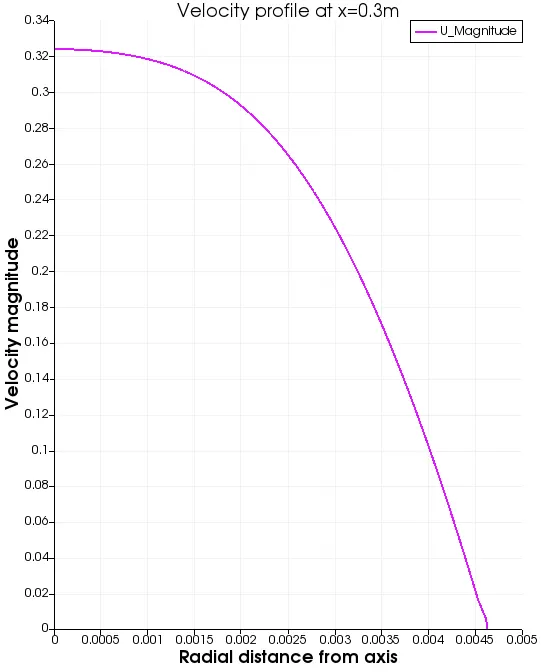
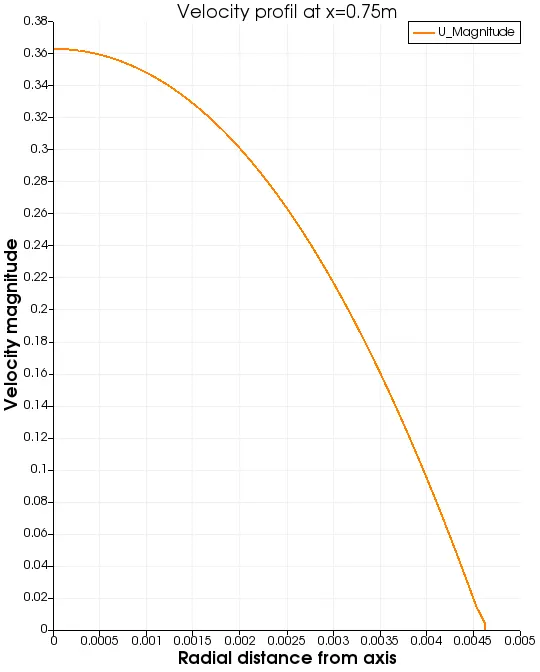
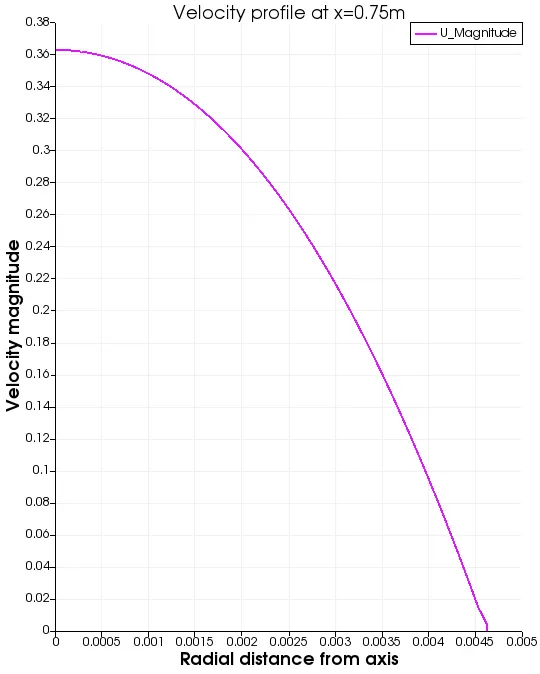
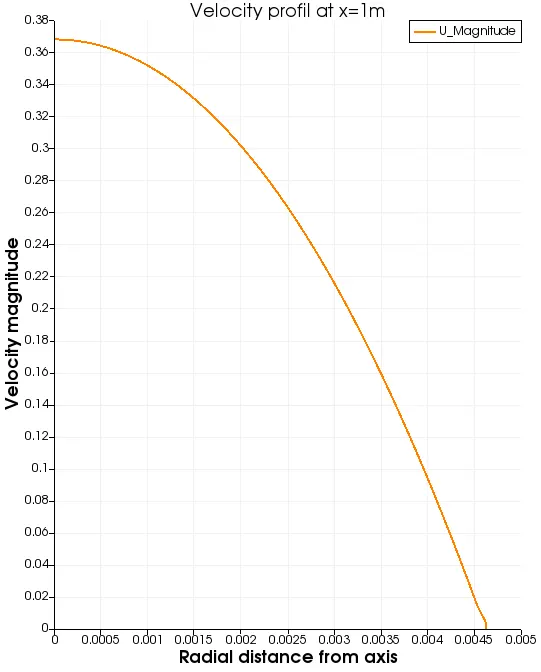
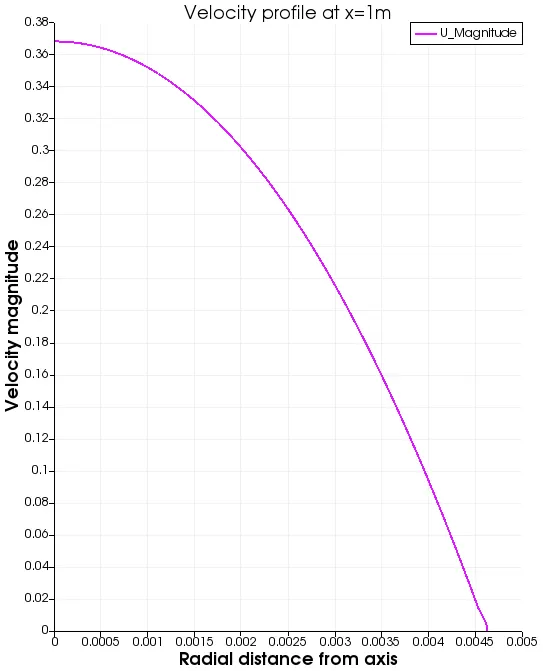
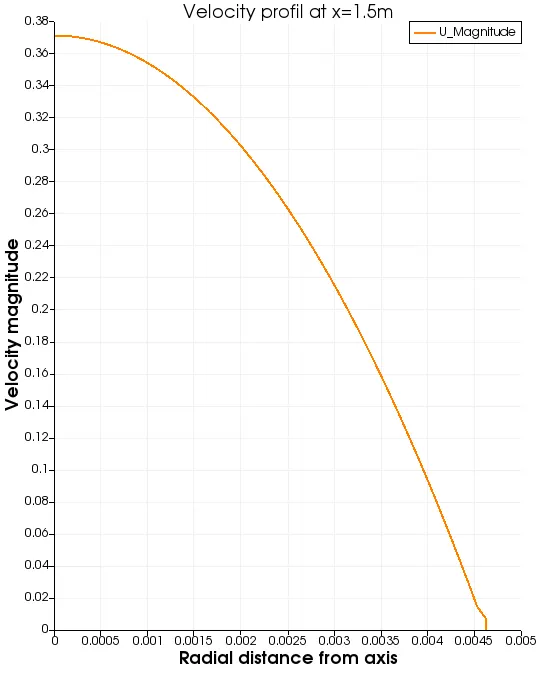
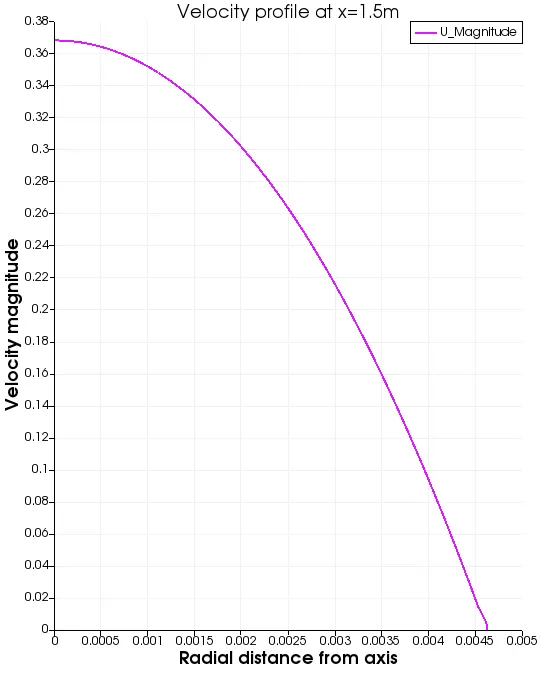
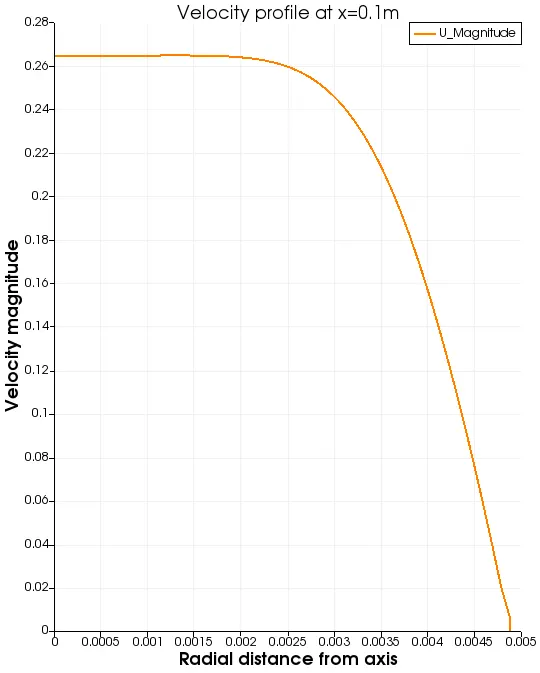
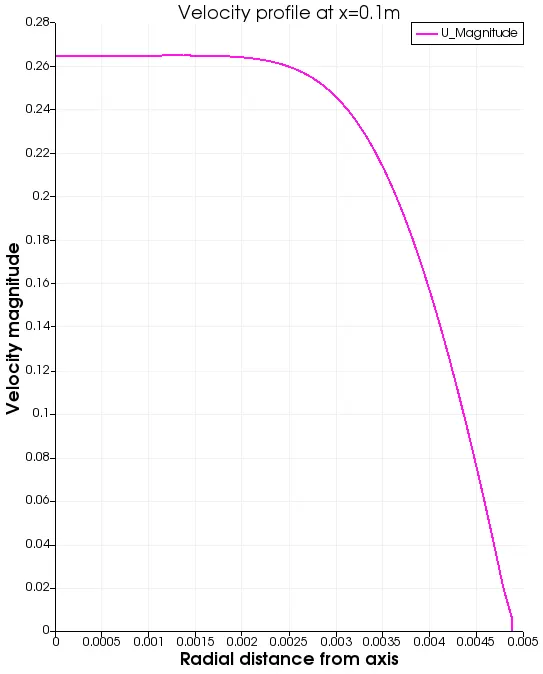
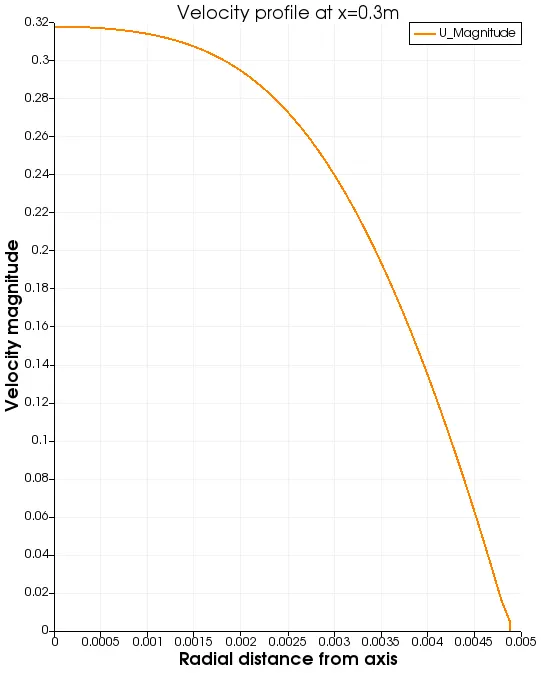
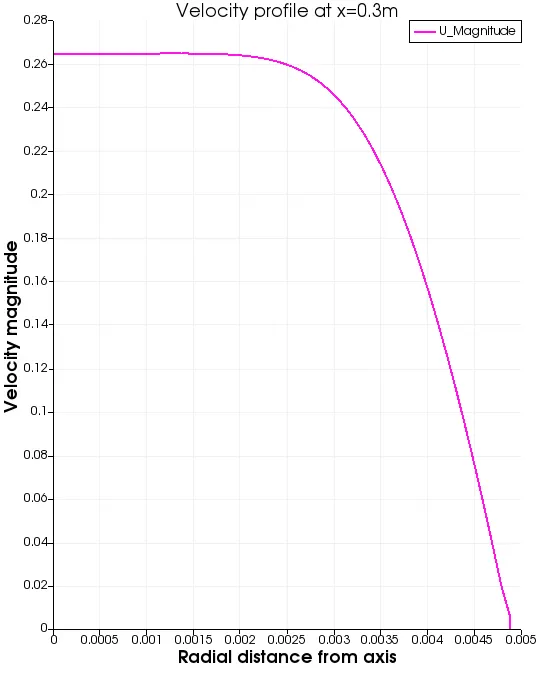
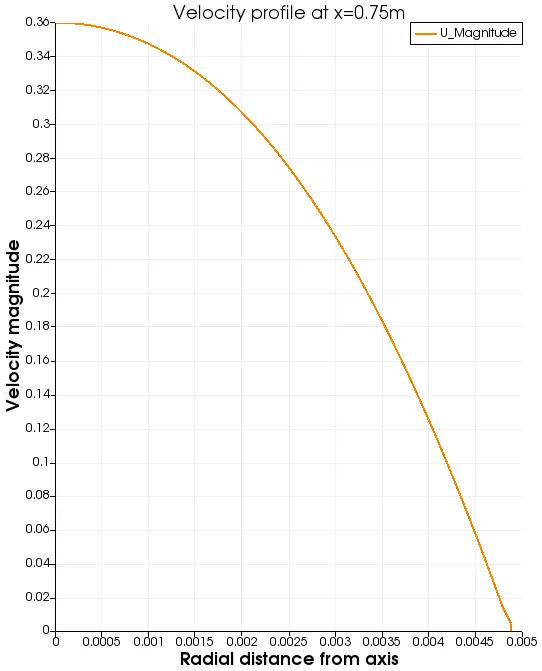
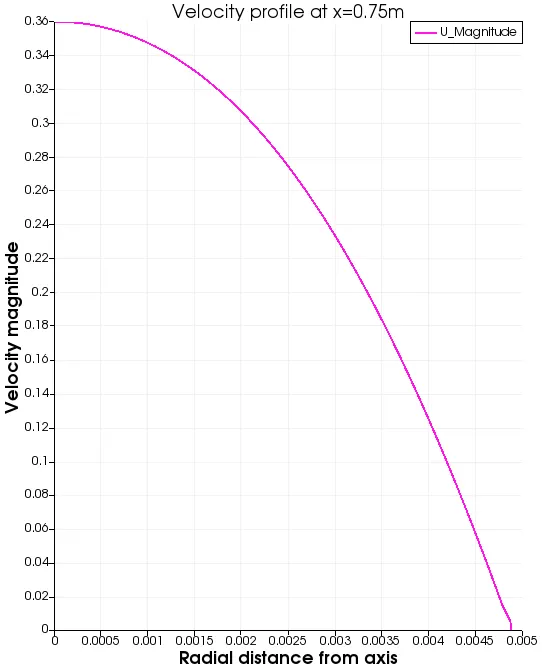
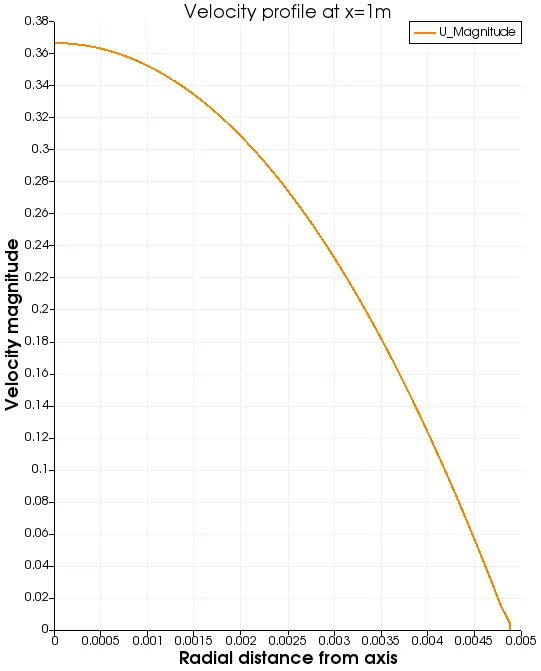
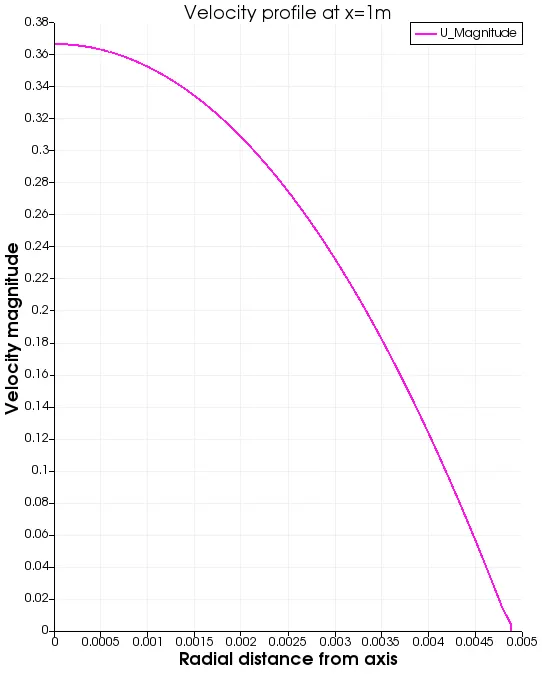
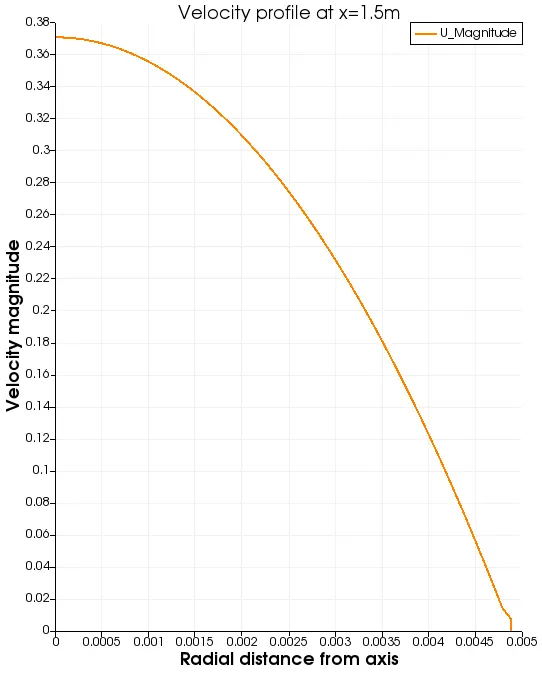
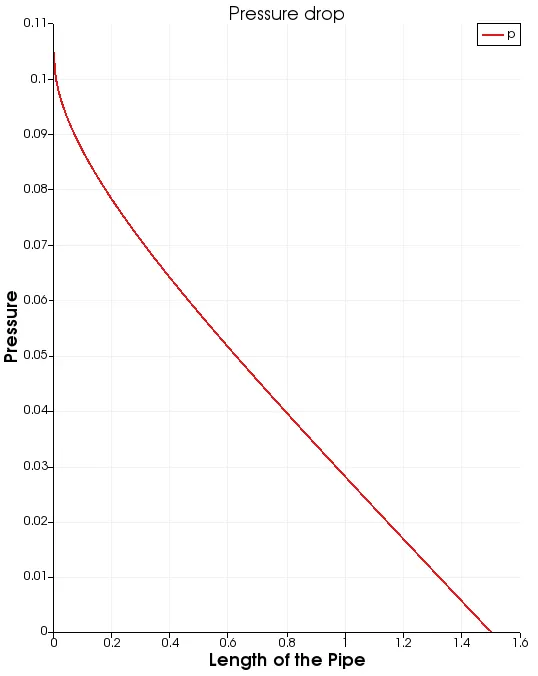
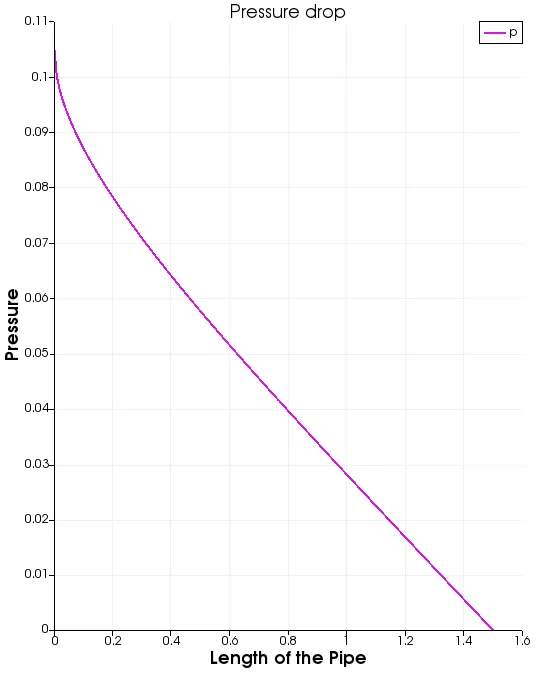
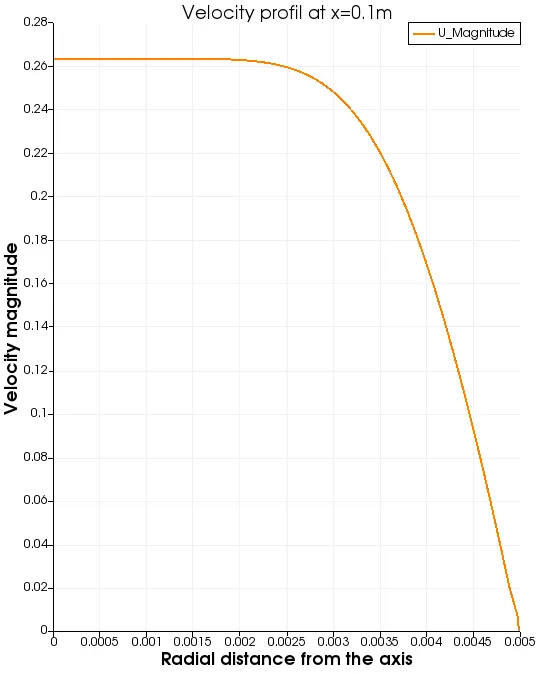
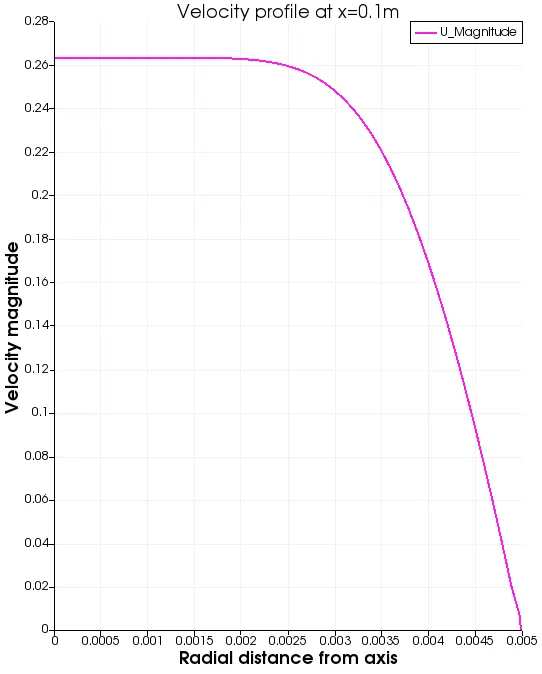
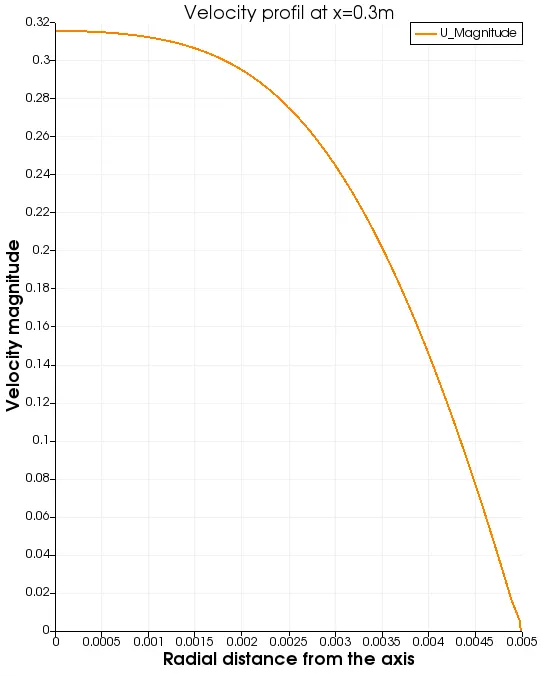
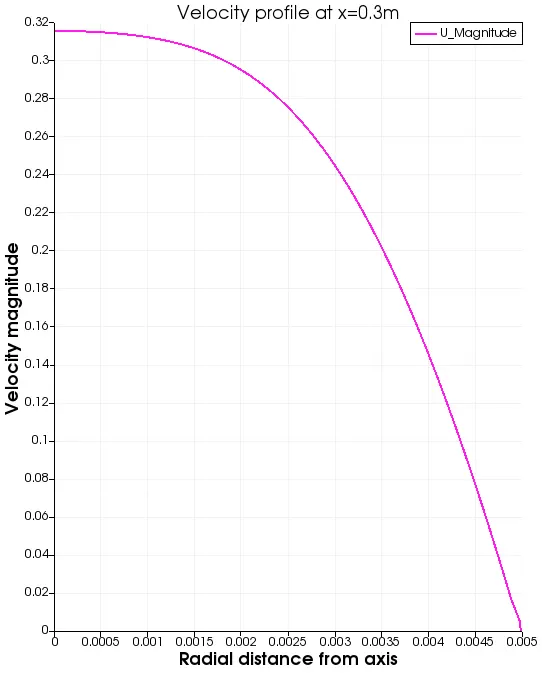
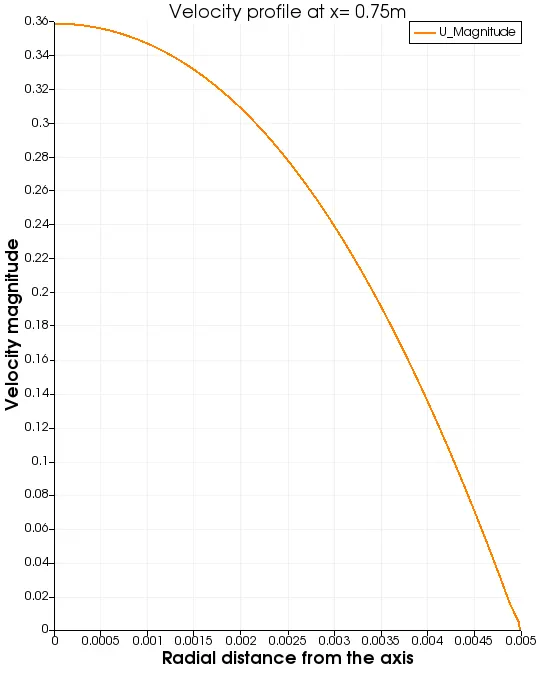
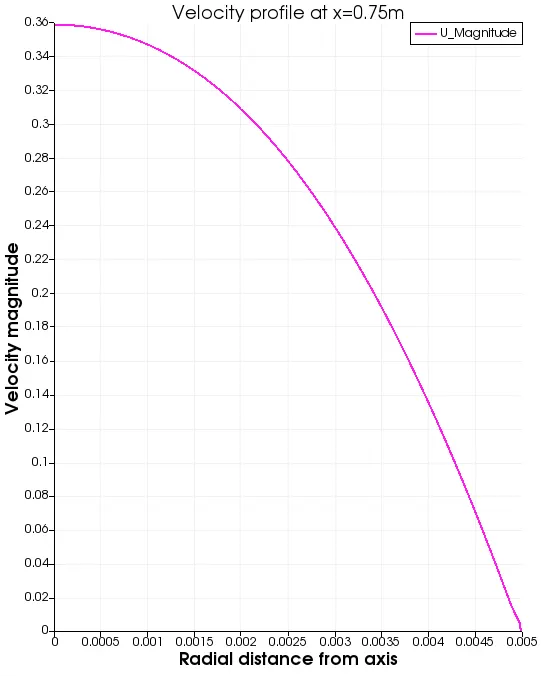
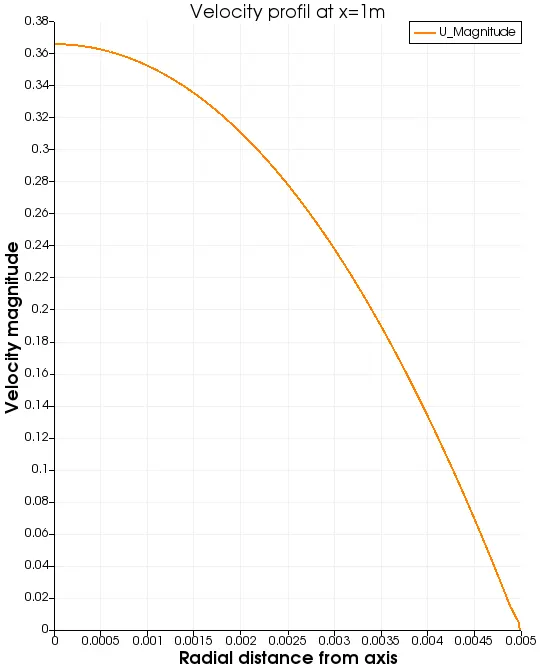
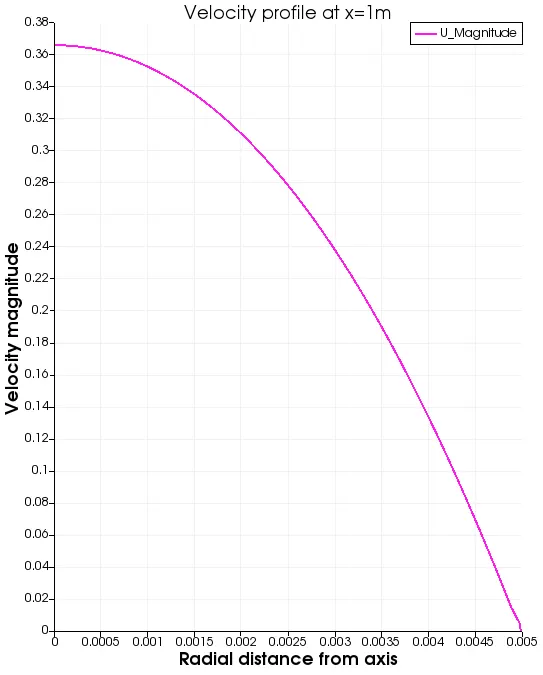
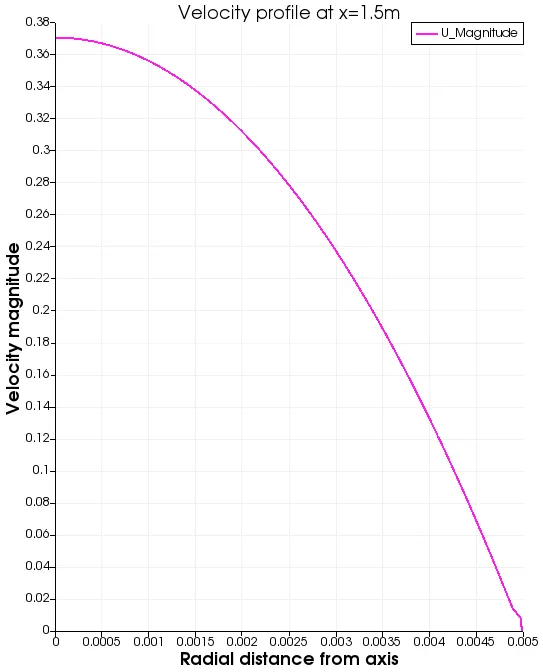
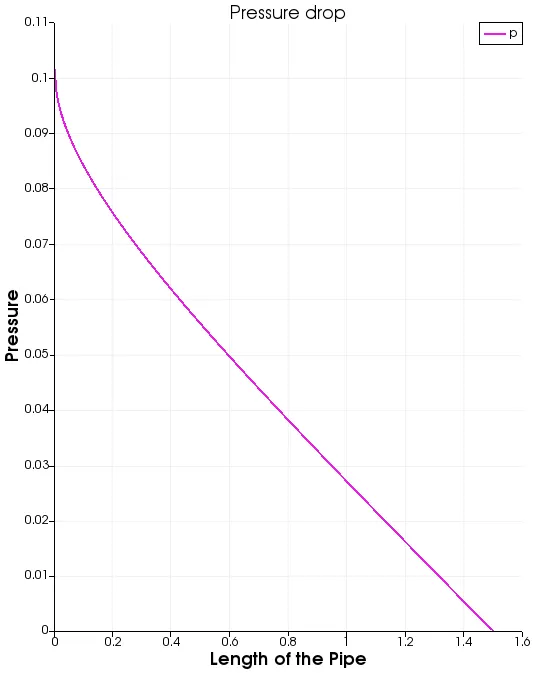
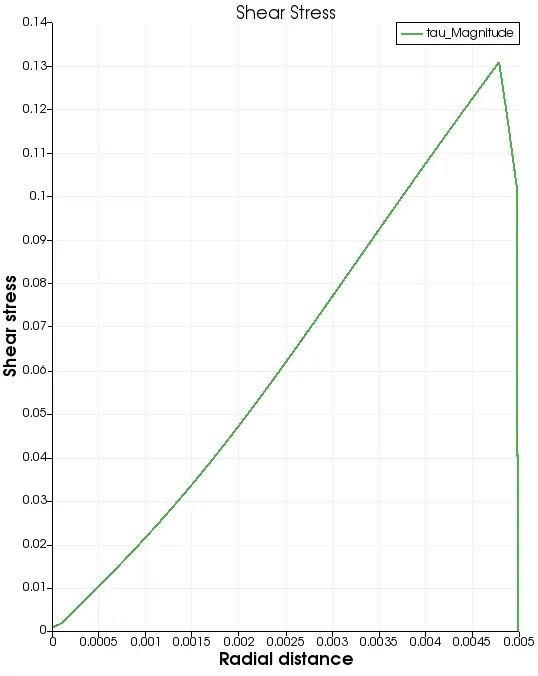
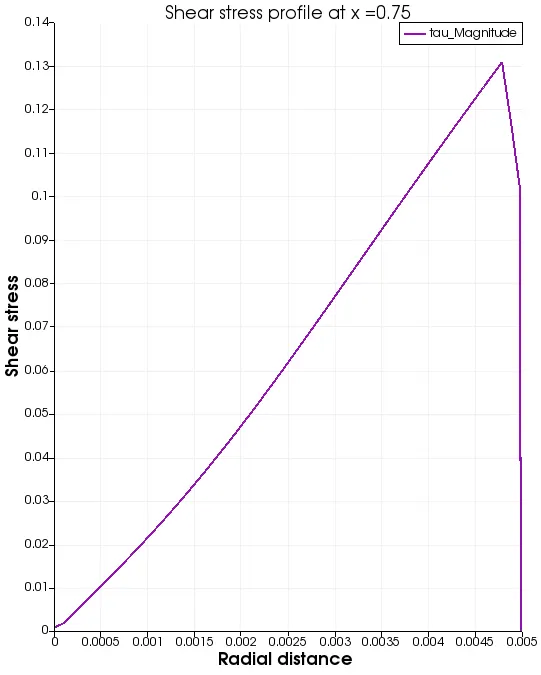
The graphs in pink colour correspond to the wedge boundary condition & the remaining are for symmetry boundary condition.
Thus, on the graphs showing the velocity contours, we can clearly see the velocity distribution along the pipe. The fluid enters the pipe and distributes all along the pipe we can also notice the formation of a boundary layer in the hydrodynamically entrance region which is 1.26m.
The same graphs show a hydrodynamically fully developed region that is numerically from x=1.26m to the outlet of the pipe where we can see a uniform velocity gradient along the radial distance.
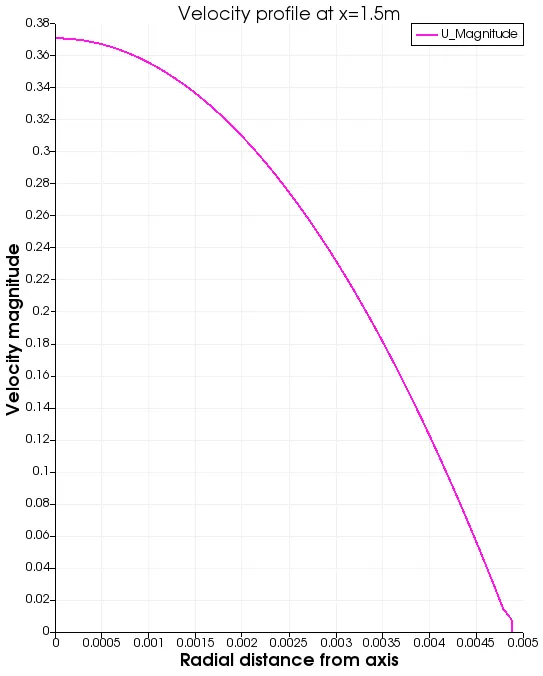
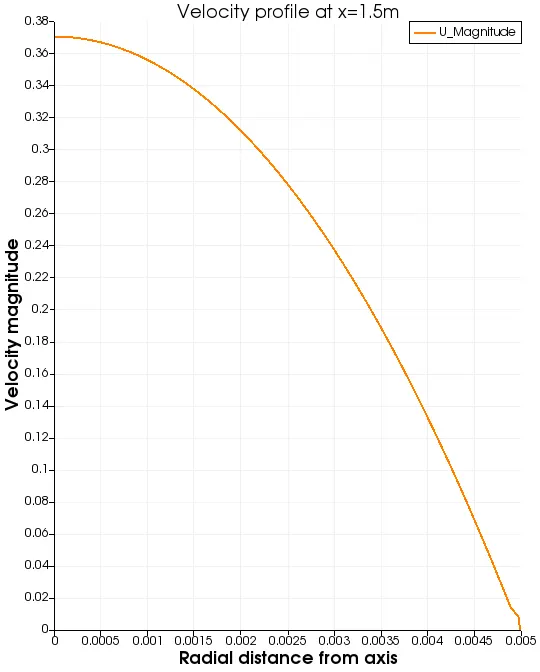
This is clearly seen on the graphs showing the velocity profiles at different locations of the pipe (x=0.1, 0.3, 0.75, 1 and 1.5).
The velocity profile captured at x=0.1m,0.3m,0.75m and 1m come under the hydrodynamically region and we can see a variation in the velocity profile. The maximum velocity at the centre is increasing as we approach the end of hydrodynamic region. One thing to be noticed is that the velocity varies as a function of radial distance. The velocity keeps decreasing as the radial distance increases. At the wall, where the radial distance is maximum the flow is restricted decreasing considerably the velocity.
Now looking especially to the velocity profile corresponding to x=1 we can see that the profile seems parabolic in nature, this is because the hydrodynamic entrance length is approaching to its end. Now the profile captured at x=1.5m comes under a hydrodynamically fully developed flow hence the velocity profile is parabolic in nature.
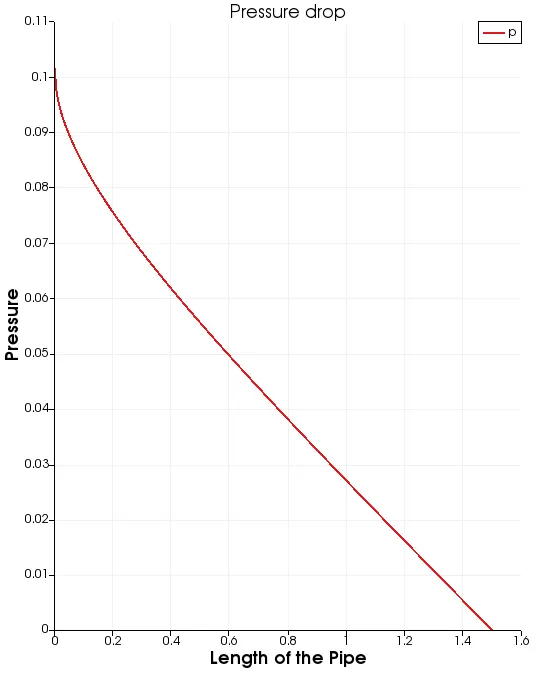
As far as pressure drop is concerned, the pressure distribution across the pipe is plotted. And as it can be seen on the graphs, the pressure decreases with increase in pipe length. A look to the corresponding graphs let us notice that the pressure gradient is not uniform under hydrodynamic entrance region whereas it is uniform(linear) under fully developed flow region.
As for shear stress, the captured profiles show that the shear stress is maximum at the wall and minimum at the centre of the pipe.
Comparison of simulation results with analytical results
Using Symmetry BC :
|
Wedge Angle (Degrees) |
Maximum Velocity obtained through(m/s) |
Maximum Velocity obtained by Hagen Poiseuille Equation(m/s) |
Error Percentage |
|
10 |
0.370533 |
0.3738 |
0.874 |
|
25 |
0.37075 |
0.3738 |
0.816 |
|
45 |
0.371195 |
0.3738 |
0.697 |
Using Wedge BC :
It is to be noted that the results obtained in case of wedge boundary condition are the same as the one obtained in symmetry boundary conditions.
This can be confirmed by taking a look to the above graphs.
Moreover, we come to realise that both boundary conditions can do the same job. But referring to the first part of our project, we can say that the difference between the two boundary conditions is that, the wedge boundary condition can be applied to very small angles and the symmetry boundary condition can be applied to very large angles. Another facet of their difference is that the wedge boundary condition requires only a single cell between the boundary pairs whereas the symmetry boundary condition can be discretized in multiple cells.
CONCLUSION :-
To conclude, we were able to simulate the flow through a pipe and different results are discussed. MATLAB was successfully used to automate the generation of blockMeshDict file which was imported in OpenFOAM for simulations. Considering the results from the two parts of our project, we can say that, for small angles wedge boundary condition is preferred over symmetry boundary conditions.