Week 12 Challenge
- Question: What is difference in active and passive earth pressure?
Answer:
- Difference between Active and Passive Earth Pressure:
Active and passive earth pressure are two types of lateral earth pressure that occur in soil mechanics and geotechnical engineering when a soil mass is subjected to external forces. They represent the soil's resistance to these forces and have different characteristics:
Active Earth Pressure:
Ø Active earth pressure occurs when the soil mass is being pushed away from a retaining structure, such as a retaining wall or a bulkhead.
Ø It is characterized by a lateral force that acts in the direction away from the structure, putting pressure on the structure.
Ø Active earth pressure is typically higher and mobilizes when the soil mass is allowed to move away from the structure. It is often associated with conditions where the wall is moving away from the soil, creating potential sliding or overturning of the structure.
Ø It is represented by the Rankine or Coulomb earth pressure theories, which provide equations to calculate the magnitude of this lateral force.
Passive Earth Pressure:
Ø Passive earth pressure occurs when the soil mass is being pushed toward a retaining structure, such as a foundation or a sheet pile wall.
Ø It is characterized by a lateral force that acts in the direction towards the structure, resisting the movement of the structure or the applied load.
Ø Passive earth pressure is generally lower than active earth pressure and mobilizes when the structure tries to move closer to the soil, potentially leading to bearing capacity failure of the structure.
Ø It is also represented by the Rankine or Coulomb earth pressure theories, with different equations to calculate the magnitude of this lateral force.
Summary:
In both cases, the forces depend on various factors, including the angle of internal friction of the soil, the wall's geometry, the depth of the wall or foundation, and the backfill material properties. Engineers use these theories to design and analyze retaining walls, sheet piles, and other structures that interact with soil masses.
In practical engineering applications, the difference between active and passive earth pressures is essential for designing stable and safe structures, as they help determine the structural integrity and overall stability of the system. The interaction between the structure and the soil must be carefully considered to prevent failure, especially in geotechnical and foundation engineering projects.
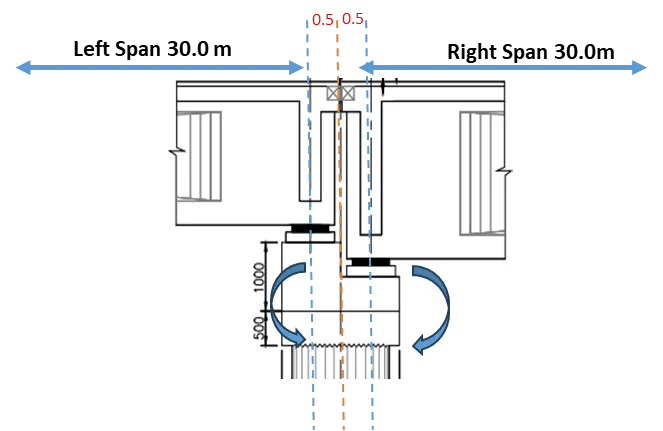
| 2.9 | Sub-structure Data | |
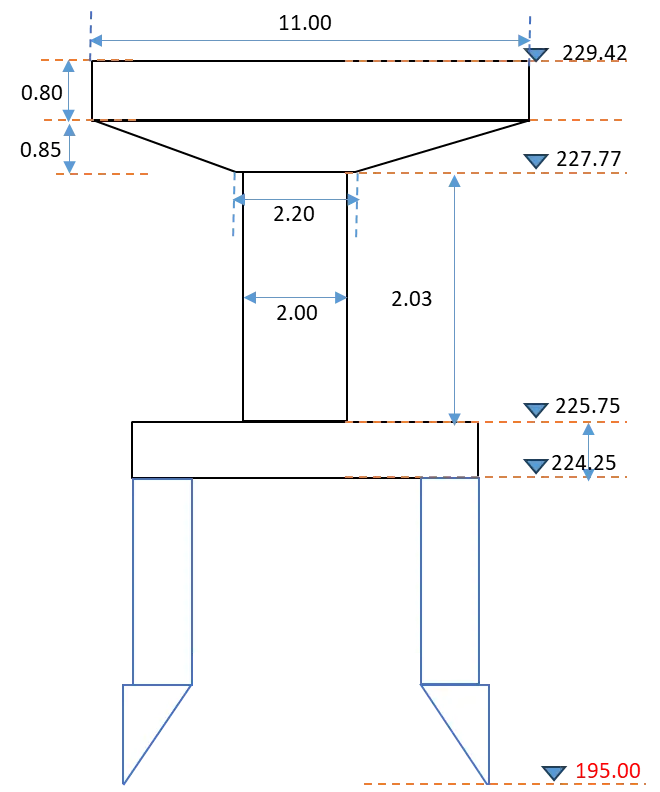
| Type of sub structure | = | Circular pier | ||||||
| No of Pier Shaft | = | 1 | no | |||||
| Transverse eccentricity of sub structure with footing /cap C/L | = | 0 | m | |||||
| Pedestal | ||||||||
| Length | = | 0.9 | m | |||||
| Width | = | 0.9 | m | |||||
| Height | = | 0.15 | m | |||||
| Nos | = | 4 | Nos | |||||
| Volume | = | 0.49 | m3 | |||||
| Unit Weight | = | 2.5 | t/m3 | |||||
| Weight | = | 1.22 | t | |||||
| Pier Cap | ||||||||
| Rectangular Part | ||||||||
| Length (T-T Direction) | = | 11 | m | |||||
| Width (L-L Direction) | = | 3.8 | m | |||||
| Height | = | 0.80 | m | |||||
| Nos | = | 1 | Nos | |||||
| Volume | = | 33.44 | m3 | |||||
| Unit Weight | = | 2.5 | t/m3 | |||||
| Weight | = | 83.60 | t | |||||
| Trapezoidal Part | ||||||||
| Length (T-T Direction) | = | 11 | m | |||||
| Top Width (L-L Direction) | = | 3.8 | m | |||||
| Bottom Width (L-L Direction) | = | 2.20 | m | |||||
| Height | = | 0.85 | m | |||||
| Nos | = | 1 | Nos | |||||
| Volume | = | 21.32 | m3 | |||||
| Unit Weight | = | 2.5 | t/m3 | |||||
| Weight | = | 53.30 | t | |||||
| Total weight of Pier cap | = | 136.90 | t | |||||
| Pier Shaft | ||||||||
| Length (T-T Direction) | = | 2.00 | m | |||||
| Width (L-L Direction) | = | 2.00 | m | |||||
| Height | = | 2.03 | m | |||||
| Nos | = | 1 | Nos | |||||
| Volume | = | 6.36 | m3 | |||||
| Unit Weight | = | 2.5 | t/m3 | |||||
| Weight | = | 15.91 | t | |||||
| Total weight of Sub-structure | Pedestal+Pier cap+Shaft | = | 154.02 | t | ||||
| 2.10. | Foundation Data | |||||||
| Type of Foundation | = | Well Foundation | ||||||
| Well Cap | ||||||||
| Length (T-T Direction) | = | 6.00 | m | |||||
| Width (L-L Direction) | = | 6.00 | m | |||||
| Height | = | 1.50 | m | |||||
| Volume | = | 42.41 | m3 | |||||
| Unit Weight | = | 2.5 | t/m3 | |||||
| Weight Well cap | = | 106.03 | t | |||||
| LWL Case | ||||||||
| Total weight of footing | = | 106.03 | t | |||||
| Longitudinal movement | ML | = | 0 | t-m | ||||
| Transverse moment | MT | = | 0 | t-m | ||||
| Calculation of weight of soil on footing under full scour condition | ||||||||
| Scour Level | = | 217.84 | m | |||||
| Volume of earth | = | 14.14 | m | |||||
| Unit Weight of earth | = | 2 | t/m3 | |||||
| weight of earth | = | 28.27 | t | |||||
| Type of foundation | = | Well foundation | ||||||
| Total No. Of circular wells | = | 1.00 | ||||||
| Dia of well cap | = | 6 | m | |||||
| External dia of well | = | 6 | m | |||||
| Thickness of well cap | = | 1.5 | m | |||||
| Thickness of steining required | = | .973 | m | |||||
| Thickness of steining | Provided | = | 1.0 | m | ||||
| Thickness of top plug | = | 0 | m | |||||
| Thickness of intermediate plug | = | 0 | m | |||||
| Thickness of bottom plug (top cylindrical portion) | = | 0.3 | m | |||||
| Thickness of bottom plug (bottom conical portion) | = | 1.4 | m | |||||
| Height of well curb | = | 1.7 | m | |||||
| Projection of well curb from outer face of steining | = | 0.075 | m | |||||
| Thickness of well curb at bottom | = | 0.15 | m | |||||
| Depth of Bottom Plug above Well Curb top | = | 0.3 | m | |||||
| Grip length of well | = | 3.62 | m | |||||
| Height of water fill | = | 22.5 | m | |||||
| Height of sand fill | = | 0 | m | |||||
| 2.11 | Clear Cover | |||||||
| Pier Cap | = | 50 | mm | |||||
| Pier Shaft | = | 50 | mm | |||||
| Foundation | = | 75 | mm | |||||
| Load Summary of Sub-structure | Values | Unit | ||||||
| Pedestal | = | 1.22 | t | |||||
| Pier Cap | = | 136.90 | t | |||||
| Pier Shaft | = | 15.91 | t | |||||
| Total weight of Sub-structure | Pedestal+Pier cap+Shaft | = | 154.02 | t | ||||
| Well cap weight | = | 106.03 | ||||||
| weight of soil on Well cap | = | 28.27 | ||||||
| Summary forces at Well cap bottom level of Sub-structure | ||||||||
| Load item | Pmax | Pmin | ML | MT | HL | HT | ||
| t | t | t-m | t-m | t | t | |||
| Weight of Sub-structure | 154.02 | 154.02 | - | - | - | - | ||
| Weight of Well Cap | 106.03 | 106.03 | - | - | - | - | ||
| Weight of Soil on Well cap | 28.27 | 28.27 | - | - | - | - | ||
| 209 Calculation of Wind Force | ||||||||||||
| 1 | Super-Structure ( DL+SIDL) | IRC:6-2017,Cl.209.3.3 | ||||||||||
| 1 | Design Wind Force Calculation without Live load | |||||||||||
| Design data | ||||||||||||
| Left Span | ||||||||||||
| Type of terrain | = | Plain | ||||||||||
| Basic Wind Speed as per code | VBasic | = | 33.00 | m/s | ||||||||
| Basic Wind speed at bridge location | V | = | 47.00 | m/s | ||||||||
| Average Height from Ground. Level to Crash Barrier Top Level | H | = | 6.76 | m | ||||||||
| Hourly Wind Speed | As per Height ,H | Vz | = | 30.33 | m/s | |||||||
| Hourly Wind Pressure | As per Height ,H | Pz | = | 551.84 | N/m2 | |||||||
| Total Length of Superstructure | L | = | 30.00 | m | ||||||||
| Total height of Superstructure in T-T | Depth of Superstr.+C/B | h | = | 3.187 | m | |||||||
| Width of Structure | B | = | 12.00 | m | ||||||||
| Exposed depth of superstructure to Wind | d | = | 3.19 | m | ||||||||
| 1.1.1 | Wind Force in Transverse Direction | IRC:6-2017,Cl.209.3.3 | ||||||||||
| Wind Force in T-T | FT | = | PzxAxGxCD | = | 205.77 | kN | ||||||
| Exposed area in T-T | L=30/2 | for one end | A | = | 95.61 | m2 | ||||||
| Gust Factor | as per code | Span<150m | G | = | 2.00 | |||||||
| Width/Depth of Cross-Section | b/d | = | 3.77 | |||||||||
| Drag Co-efficient | b/d<7 | CD | = | 1.95 | ||||||||
| Wind Force | PzxAxGxCD | FT | = | 205.77 | kN | |||||||
| Point of Application at exposed height centroid | 3.19/2 | = | 1.59 | m | ||||||||
| Acting at RL above Pier cap top | RL | = | 231.22 | m | ||||||||
| lever arm at shaft bottom level | Zshaft | = | 5.47 | m | ||||||||
| lever arm at foundation bottom level | Zfoundation | = | 6.97 | m | ||||||||
| Moment at shaft bottom level | Mshaft | = | 1125.46 | kN-m | ||||||||
| Moment at foundation bottom level | Mfoundation | = | 1434.11 | kN-m | ||||||||
| 1.1.2 | Wind Force in Longitudinal Direction | IRC:6-2017,Cl.209.3.4 | ||||||||||
| Winf force in L-L | 25% of FT | FL | = | 51.44 | kN | |||||||
| Moment at shaft bottom level | Mshaft | = | 281.36 | kN-m | ||||||||
| Moment at foundation bottom level | Mfoundation | = | 358.53 | kN-m | ||||||||
| Acting at RL above Pier cap top | RL | = | 231.22 | m | ||||||||
| 1.1.2 | Wind Force in Vertical Direction | IRC:6-2017,Cl.209.3.5 | ||||||||||
| Wind Force | FV | = | PzxAxGxCL | |||||||||
| Plan Area | A | = | 360.00 | m2 | ||||||||
| Gust Factor | as per code | Span<150m | G | = | 2.00 | |||||||
| Lift Co-efficient | CL | = | 0.75 | |||||||||
| Wind Force | Taking force Uplift is "-", Downward is "+" | PzxAxGxCL | FV | = | 297.99 | kN | ||||||
| Moment at shaft bottom level | Lever arm | = | 0 | Mshaft | = | 0.00 | kN-m | |||||
| Moment at foundation bottom level | Lever arm | = | 0 | Mfoundation | = | 0.00 | kN-m | |||||
| 1 | Super-Structure | IRC:6-2017,Cl.209.3.3 | ||||||||||
| 1 | Design Wind Force Calculation with Live load | |||||||||||
| Design data | ||||||||||||
| Wind speed at deck level | = | 30.33 | m/s | |||||||||
| Type of terrain | = | Plain | ||||||||||
| Basic Wind Speed as per code | VBasic | = | 33 | m/s | ||||||||
| Basic Wind speed at bridge location | V | = | 36 | m/s | ||||||||
| Average Height from Foundation Btm. Level to Crash Barrier Top Level | H | = | 6.763 | m | ||||||||
| Hourly Wind Speed | As per Height ,H | Vz | = | 34.25 | m/s | |||||||
| Hourly Wind Pressure | As per Height ,H | Pz | = | 702.39 | N/m2 | |||||||
| Total Length of Superstructure | L | = | 30.00 | m | ||||||||
| Total height of Superstructure in T-T | h | = | 3.19 | m | ||||||||
| Width of Structure | B | = | 12.00 | m | ||||||||
| Exposed depth of superstructure to Wind | d | = | 3.19 | m | ||||||||
| Height of Live load above roadway surface | IRC:6-2017,Cl.209.3.6 | h1 | = | 3.00 | m | |||||||
| Height of Crash Barrier | h2 | = | 0.90 | m | ||||||||
| Wind load considering when live load is present | = | wind force consider | ||||||||||
| 1.1.1 | Wind Force in Transverse Direction | IRC:6-2017,Cl.209.3.3 | ||||||||||
| Wind Force in T-T | FT | = | PzxAxGxCD | = | 0.00 | kN | ||||||
| Exposed area in T-T | 30/2 | For one side | A | = | 0.00 | m2 | ||||||
| Gust Factor | as per code | Span<150m | G | = | 2.00 | |||||||
| Width/Depth of Cross-Section | b/d | = | 3.77 | |||||||||
| Drag Co-efficient | b/d<7 | CD | = | 1.20 | ||||||||
| Wind Force | PzxAxGxCD | FT | = | 0.00 | kN | |||||||
| Point of Application at exposed height centroid | 3.18700000000001/2 | = | 1.50 | m | ||||||||
| Acting at RL | RL | = | 233.61 | m | ||||||||
| lever arm at shaft bottom level | Zshaft | = | 6.06 | m | ||||||||
| lever arm at foundation bottom level | Zfoundation | = | 7.86 | m | ||||||||
| Moment at shaft bottom level | Mshaft | = | 0.00 | kN-m | ||||||||
| Moment at foundation bottom level | Mfoundation | = | 0.00 | kN-m | ||||||||
| 1.1.2 | Wind Force in Longitudinal Direction | IRC:6-2017,Cl.209.3.4 | ||||||||||
| Winf force in L-L | 25% of FT | FL | = | 0.00 | kN | |||||||
| Acting at RL | RL | = | 233.61 | m | ||||||||
| Moment at shaft bottom level | Mshaft | = | 0.00 | kN-m | ||||||||
| Moment at foundation bottom level | Mfoundation | = | 0.00 | kN-m | ||||||||
| Total Wind forces at bearing level from superstructure | ||||||||||||
| One span is present( left Span) | 50% of span | 100% of Span | ||||||||||
| FL | (DL+SIDL+LL)/2 | HL | = | 25.72 | 51.44 | t | ||||||
| FT | (DL+SIDL+LL)/3 | HT | = | 102.89 | 205.77 | t | ||||||
| FV | P-wind | = | 149.00 | 297.99 | t | |||||||
| 2 | Sub-Structure no live load is present | IRC:6-2017,Cl.209.4 | ||||||||||
| 2.1 | Wind Force in Transverse Direction | IRC:6-2017,Cl.209.3.3 | ||||||||||
| Pier Cap | ||||||||||||
| Clear height of Abutment(shaft+cap) | = | 3.176 | m | |||||||||
| Height of Pier Cap | = | 1.61 | m | |||||||||
| Breadth of shaft in L-L | b | = | 3.8 | m | ||||||||
| Width of Pier Cap | B | = | 11 | m | ||||||||
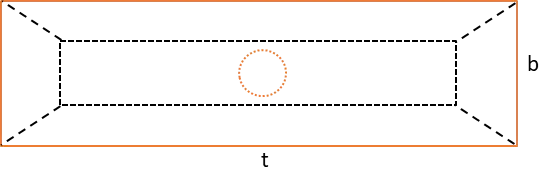
| Ratio | Plan shape | Width in T-T/Width of Shaft in L-L | t/b | = | 2.89 | |||||||
| Ratio | H/b | = | 0.4 | |||||||||
| Hourly Wind Speed | As per Height ,H | Vz | = | 30.33 | m/s | |||||||
| Hourly Wind Pressure | As per Height ,H | Pz | = | 551.84 | N/m2 | |||||||
| Drag Co-efficient | Circular shape, with rough surface or projection | CD | = | 0.7 | ||||||||
| Gust Factor | as per code | Span<150m | G | = | 2.00 | |||||||
| Exposed area | A | = | 5.58 | m2 | ||||||||
| Wind Force |
|
PzxAxGxCD | FT | = | 4.31 | kN | ||||||
| Point of Application | y | = | 0.75 | m | ||||||||
| Acting at RL above Pier cap top | RL | = | 228.67 | m | ||||||||
| lever arm at shaft bottom level | Zshaft | = | 1.876 | m | ||||||||
| lever arm at foundation bottom level | Zfoundation | = | 3.676 | m | ||||||||
| Moment at shaft bottom level | Mshaft | = | 8.09 | kN-m | ||||||||
| Moment at foundation bottom level | Mfoundation | = | 15.84 | kN-m | ||||||||
| 2.2 | Wind Force in Longitudinal Direction | IRC:6-2017,Cl.209.3.4 | ||||||||||
| Winf force in L-L | 25% of FT | FL | = | 1.08 | kN | |||||||
| Moment at shaft bottom level | Mshaft | = | 2.02 | kN-m | ||||||||
| Moment at foundation bottom level | Mfoundation | = | 3.96 | kN-m | ||||||||
| Pier shaft | ||||||||||||
| Clear height of Abutment(shaft+cap) | = | 1.566 | m | |||||||||
| Height of Pier shaft | = | 0.266 | m | |||||||||
| Breadth of shaft in L-L | Circular shape | d | = | 2.5 | m | |||||||
| Width of Pier Cap | CL | = | 11 | 0 | ||||||||
| Ratio | Plan shape | Width in T-T/Width of Shaft in L-L | t/b | = | 0.3 | |||||||
| Ratio | H/b | = | 0.1 | |||||||||
| Hourly Wind Speed | As per Height ,H | Vz | = | 30.33 | m/s | |||||||
| Hourly Wind Pressure | As per Height ,H | Pz | = | 551.84 | N/m2 | |||||||
| Drag Co-efficient | Circular shape, with rough surface or projection | CD | = | 1 | ||||||||
| Gust Factor | as per code | Span<150m | G | = | 2.00 | |||||||
| Exposed area | A | = | 46.50 | m2 | ||||||||
| Wind Force |
|
PzxAxGxCD | FT | = | 51.32 | kN | ||||||
| Point of Application | y | = | 0.13 | m | ||||||||
| Acting at RL | RL | = | 227.68 | m | ||||||||
| Width of Pier Cap | Zshaft | = | 0.13 | m | ||||||||
| Ratio | Zfoundation | = | 1.93 | m | ||||||||
| Ratio | Mshaft | = | 6.83 | kN-m | ||||||||
| Hourly Wind Speed | Mfoundation | = | 99.20 | kN-m | ||||||||
| 2.2 | Wind Force in Longitudinal Direction | IRC:6-2017,Cl.209.3.4 | ||||||||||
| Winf force in L-L | 25% of FT | FL | = | 12.83 | kN | |||||||
| Moment at shaft bottom level | Mshaft | = | 1.71 | kN-m | ||||||||
| Moment at foundation bottom level | Mfoundation | = | 24.80 | kN-m | ||||||||
| 2 | Sub-Structure with live load | IRC:6-2017,Cl.209.4 | ||||||||||
| 2.1 | Wind Force in Transverse Direction | IRC:6-2017,Cl.209.3.3 | ||||||||||
| Clear height of Abutment(shaft+cap) | = | 3.176 | m | |||||||||
| Breadth of shaft in L-L | b | = | 3.8 | m | ||||||||
| Ratio | Plan shape | Width in T-T/Width of Shaft in L-L | t/b | = | 3.16 | |||||||
| Ratio | H/b | = | 2.9 | |||||||||
| Drag Co-efficient | Table 13,Note:4 | CD | = | 0.8 | ||||||||
| Gust Factor | as per code | Span<150m | G | = | 2.00 | |||||||
| Exposed area | A | = | 6.16 | m2 | ||||||||
| Wind Force | PzxAxGxCD | FT | = | 6.92 | kN | |||||||
| Point of Application |
|
y | = | 0.75 | m | |||||||
| lever arm at shaft bottom level | Zshaft | = | 2.2 | m | ||||||||
| lever arm at foundation bottom level | Zfoundation | = | 3.35 | m | ||||||||
| Moment at shaft bottom level | Mshaft | = | 15.22 | kN-m | ||||||||
| Moment at foundation bottom level | Mfoundation | = | 23.18 | kN-m | ||||||||
| 2.2 | Wind Force in Longitudinal Direction | IRC:6-2017,Cl.209.3.4 | ||||||||||
| Winf force in L-L | 25% of FT | FL | = | 1.73 | kN | |||||||
| Moment at shaft bottom level | Mshaft | = | 3.81 | kN-m | ||||||||
| Moment at foundation bottom level | Mfoundation | = | 5.79 | kN-m | ||||||||
| Case-1 Summary of Wind forces for no live load is present | ||||||||||||
| Direction | Super-structure | Sub-structure | ||||||||||
| Force | Mshaft | Mfoundation | Force | Mshaft | Mfoundation | |||||||
| kN | kN-m | kN-m | kN | kN-m | kN-m | |||||||
| Transverse | 205.77 | 1125.46 | 1434.11 | 4.31 | 8.09 | 15.84 | ||||||
| Longitudinal | 51.44 | 281.36 | 358.53 | 1.08 | 2.02 | 3.96 | ||||||
| Vertical | 297.99 | - | - | - | - | - | ||||||
| Case-2 Summary of Wind forces for live load is present | ||||||||||||
| Direction | Super-structure | Sub-structure | Live load | |||||||||
| Force | Mshaft | Mfoundation | Force | Mshaft | Mfoundation | Force | Mshaft | Mfoundation | ||||
| kN | kN-m | kN-m | kN | kN-m | kN-m | kN | kN-m | kN-m | ||||
| Transverse | 0.00 | 0.00 | 0.00 | 6.92 | 15.22 | 23.18 | 53.10 | 321.95 | 417.53 | |||
| Longitudinal | 0.00 | 0.00 | 0.00 | 1.73 | 3.81 | 5.79 | 13.28 | 80.49 | 104.38 | |||
| Vertical | 297.99 | - | - | - | - | - | # | - | - | |||
| Left Span | ||||||||||||
| Maximum Transverse force | = | 210.08 | kN | |||||||||
| Maximum Longitudinal force | = | 52.52 | kN | |||||||||
| Maximum Vertical force | = | 297.99 | kN | |||||||||
| Maximum at Abutment Bottom Level | ||||||||||||
| Maximum Moment along T-T | = | 1133.54 | kN-m | |||||||||
| Maximum Moment along L-L | = | 283.39 | kN-m | |||||||||
| Maximum at Foundation Bottom Level | ||||||||||||
| Maximum Moment along T-T | = | 1449.96 | kN-m | |||||||||
| Maximum Moment along L-L | = | 362.49 | kN-m | |||||||||