Week 12.1: 2D Cavitation simulation
JORGE LOZANO
Advanced Turbomachinery Simulation using Converge
2D Cavitation simulation
1) Set up and run 3 cases for Winkl Hoffer Nozzle to study Cavitation,
- Case 1: Set up the case for Pressure difference of 30 bars
- Case 2: Set up the case for Pressure difference of 70 bars
- Case 3: Set up the case for Pressure difference of 100 bars
2) Post process results in Paraview:
- Plot contours for Velocity
- Plot contour for void fraction
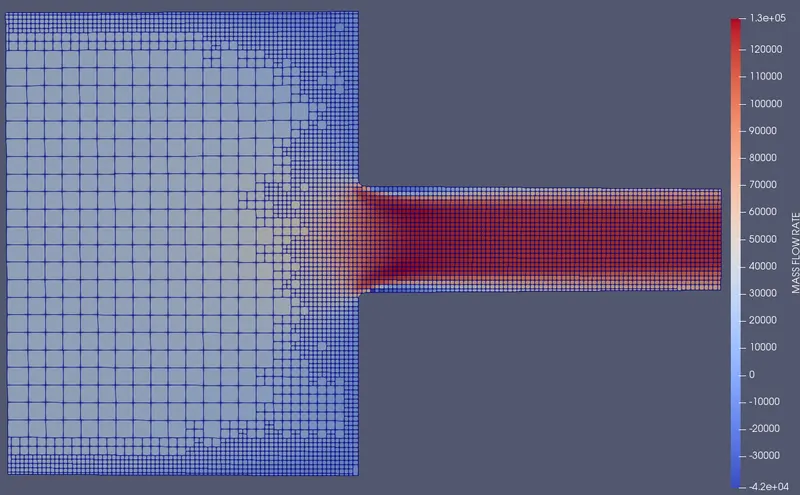
- Plot contour for mass flow rate
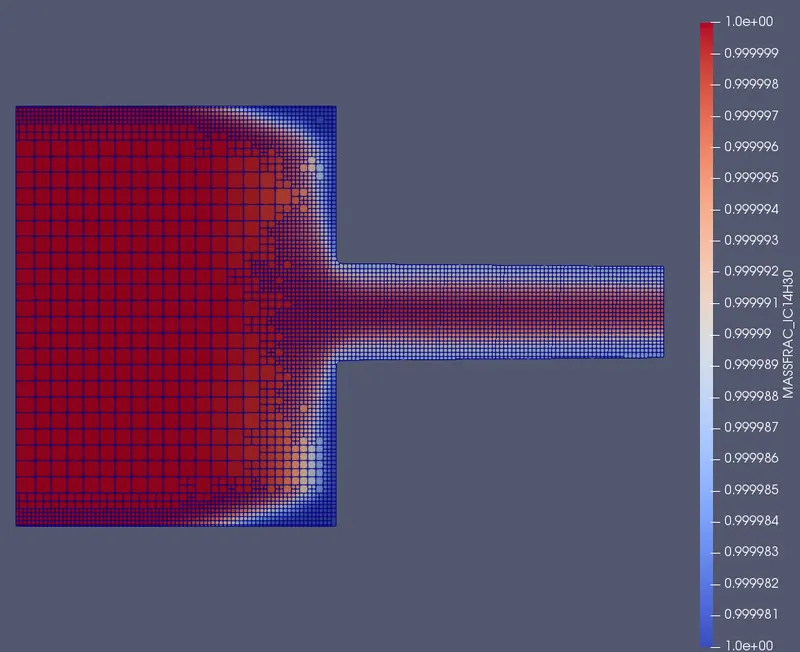
- plot contour for mass fraction
3) For all the 3 cases, create a LINE PROBE (i.e plot over line) at outlet and plot "mass flow rate" over this LINE PROBE.
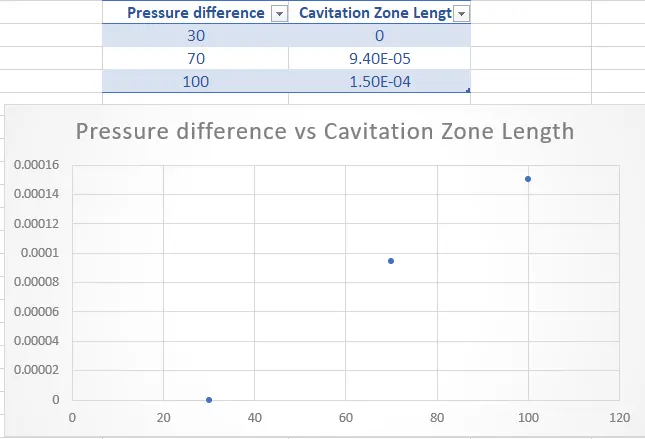
4) Make a plot in excel for Pressure difference Vs Cavitation zone length i.e plot cavitation zone length for pressure difference of 30 bars, 70 bars and 100 bars.
Documentation [1] [2]
Cavitation in pu]mps is the rapid creation and subsequent collapse of air bubbles in a fluid.
When the Net Positive Suction Head Available (NPSHa) is lower than the Net Positive Suction Head Required (NPSHr), cavitation will begin to occur.
In many cases, the force of cavitation is strong enough to pit metal components of the pump, like the impeller, and damage pump seals.
Pumps are designed to work with a full flowing water supply, but in some cases a flooded inlet is not enough to maintain pressure required to prevent cavitation. The inlet, or suction side of a pump is the point of lowest pressure in each pump. For positive displacement pumps, the lowest pressure occurs just prior to rotor meshing; for centrifugal pumps, lowest pressure is near the eye of the impeller.
Cavitation is possible in all pump types and since its principles are essentially the same, we will focus on centrifugal pumps. The eye is where fluid is drawn into the impeller and where the rotation of the impeller begins to act on the fluid. When pressure acting on the liquid (Net Positive Suction Head Available) is too low, bubbles form, and as the liquid accelerates because of impeller rotation, pressure increases and the bubbles collapse.
Under normal atmospheric pressure conditions, fluids have predictable vapor pressure. As the pressure inside the pump falls below the liquid's vapor pressure, bubbles form. The bubbles collapse when they reach areas of the liquid where the pressure is above the vapor pressure. In the case of cavitation, this formation and collapse is both rapid and violent. Disrupted or poorly executed processing lines can cause suction or discharge pressure to fall, which leads to cavitation.
Disruptions to flow may have several causes, from system design to component degradation. Common causes of flow disruption that result in cavitation:
- Excessively long inlet piping
- Higher than expected fluid viscosity
- Clogged inlet
- Clogged filters and strainers
- Restricted or collapsed inlet hoses
- Poorly specified pump
Cavitation sounds like marbles or gravel circulating through the pump, pipes, or hoses. The effects of prolonged cavitation are visible on the pump impeller and other components.
Typical indications of cavitation:
- Noise
- Vibration
- Seal/bearing failure
- Impeller erosion
- Higher than usual power consumption
Many areas in hydraulic systems are prone to cavitation wear, such as:
- Downstream of control valves that have high pressure differentials,
- In the suction chambers of pumps where starved inlet conditions exist,
- In rapidly moving actuators (both linear and rotary types) where negative load conditions occur,
- In leakage paths (across seals, valve seats and spool lands) where high velocities cause pressure levels to drop below the vapor pressure of the fluid (a cavitation condition often referred to as wiredrawing) and
- In all devices where fluid flow is subjected to sharp turns, reduction in cross-sections with subsequent expansions (in cocks, flaps, valves, diaphragms) and other deformations.
Cavitation disturbs the normal operating conditions of fluid-type mechanical systems and destroys the surfaces of components. The process consists of cavities forming when pressures are low, the growth of subsequent bubbles as pressure stabilizes and finally the collapse of the bubbles when the cavities (gaseous or vaporous bubbles) are exposed to high-pressure. Note that the pressure drop across the component is the driving force for cavitation wear.
Preprocessing
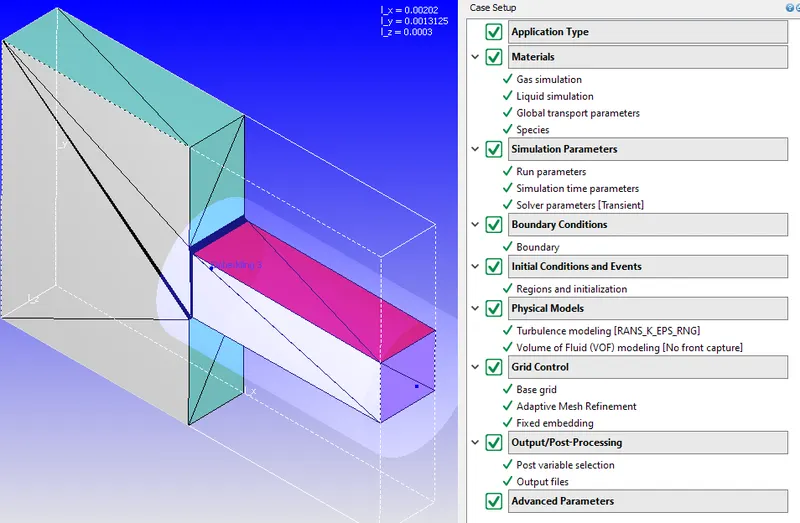
The next most important selections will condition the simulation to a certain kind of flow, main material as mixture with oxygen and nitrogen, simulation parameters as what kind of simulation is, how many iterations, algorithm used, initial conditions with the boundaries, grid control, physical models and the post processing variables obtained from the simulation.
The pre-processing was realized in Converge Simple, while the processing of the simulation will be using the software Cygwin which allows systems to be recompiled and run natively on Windows that by using several processors the simulation will be run using the Converge Studio initial conditions.
After having all boundaries and geometry correct the general flow simulation is set to as in the right side in the image to generate and apply the equations needed.
Simulation case
Processing
Simulations
The following images present the overall timing of the simulation, containing the load balance and section time recording to see and be able to optimize the simulation if needed.
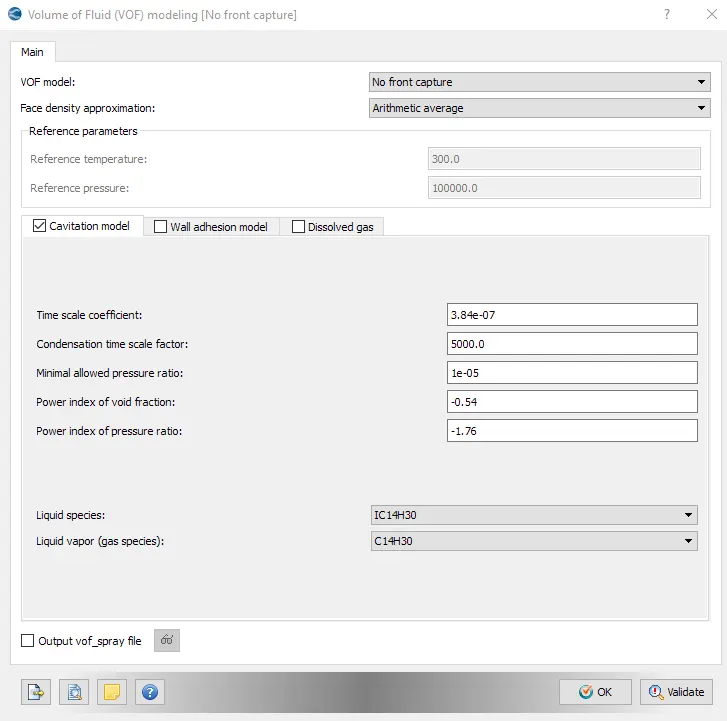
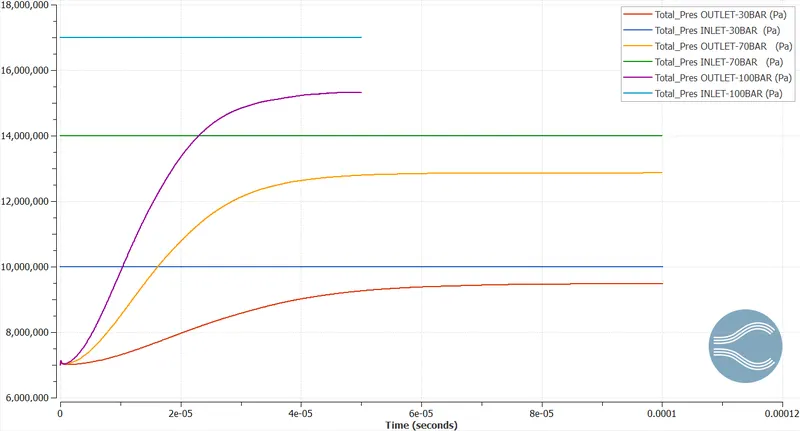
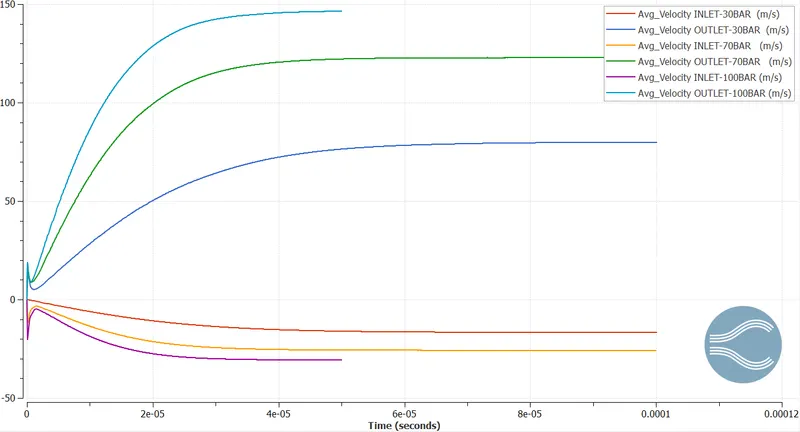
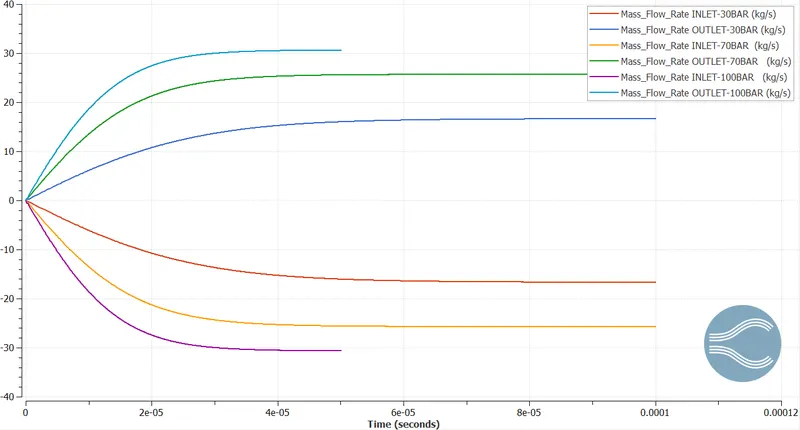
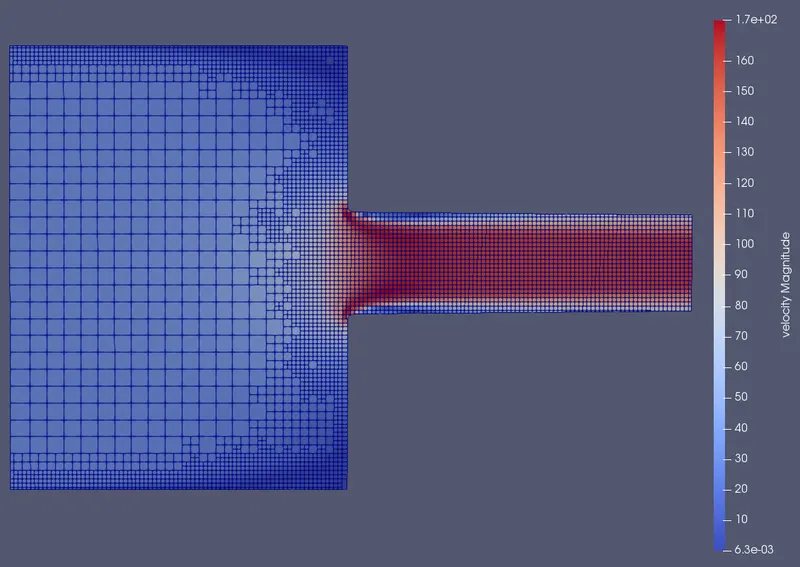
The idea for this simulation is to increase the pressure difference from 30 to 70 and 100 bar to be able to compare and see the effect of cavitation in velocity, mass flow rate, pressures, and volume fraction of the liquid and gas phases materials.
Postprocessing
The post processing was carried out using the Para view software and converge plot generation as required comparing the three cases simulated.
Pressure inlet and outlet Converge graph:
Velocity inlet and outlet Converge graph:
Mass flow rate inlet and outlet Converge graph:
Paraview postprocessing:
Velocity Paraview:
30 BAR
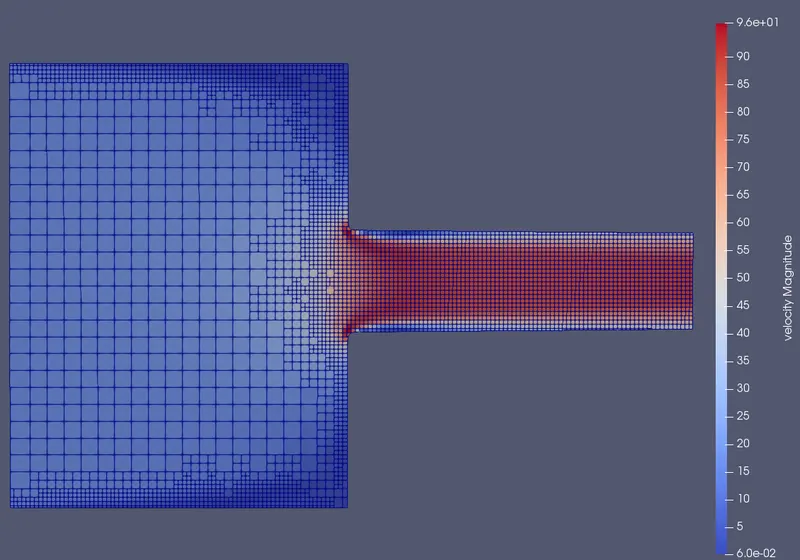
70 BAR
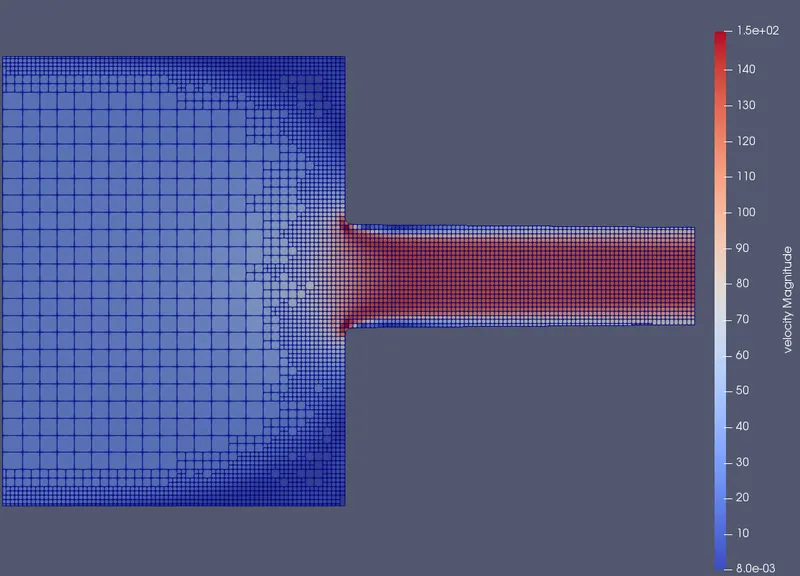
100 BAR
Alpha Paraview:
30 BAR
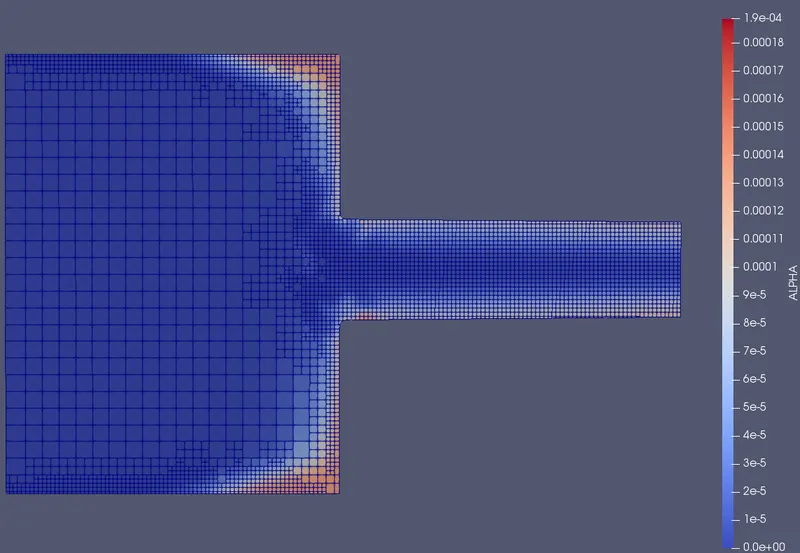
70 BAR
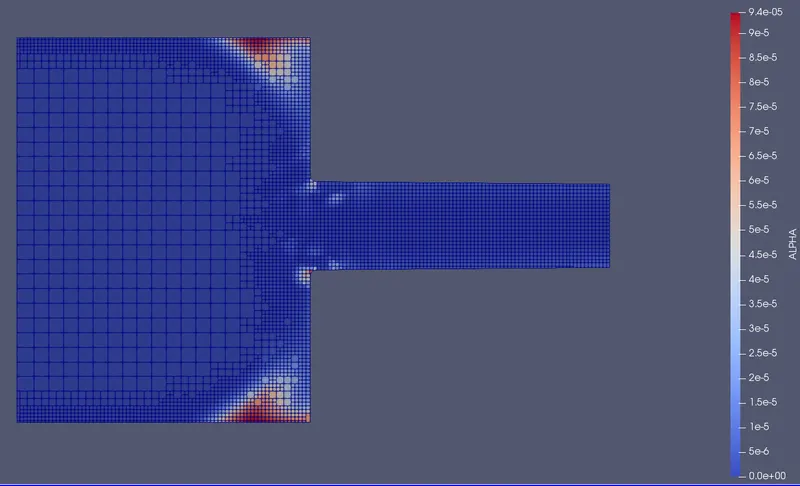
100 BAR
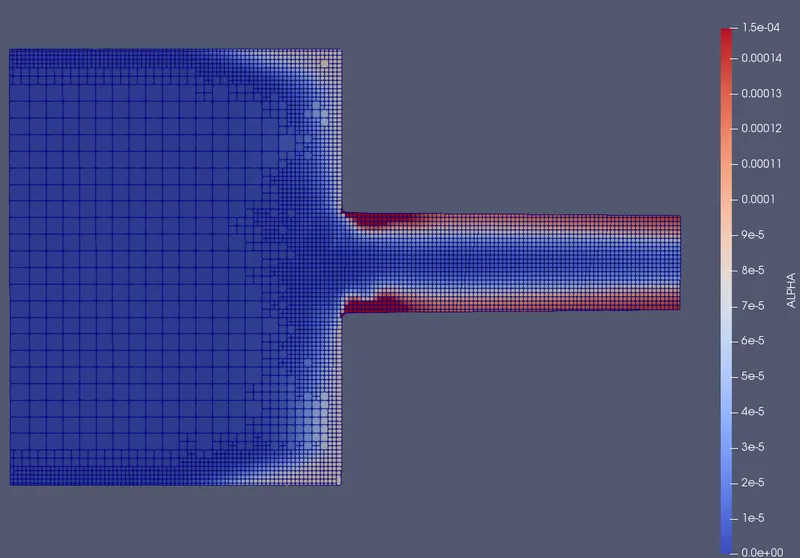
Mass flow rate fraction Paraview:
30 BAR
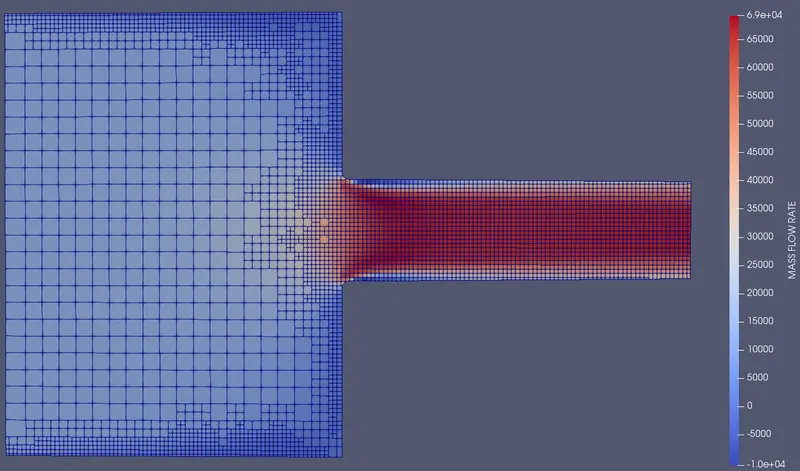
70 BAR
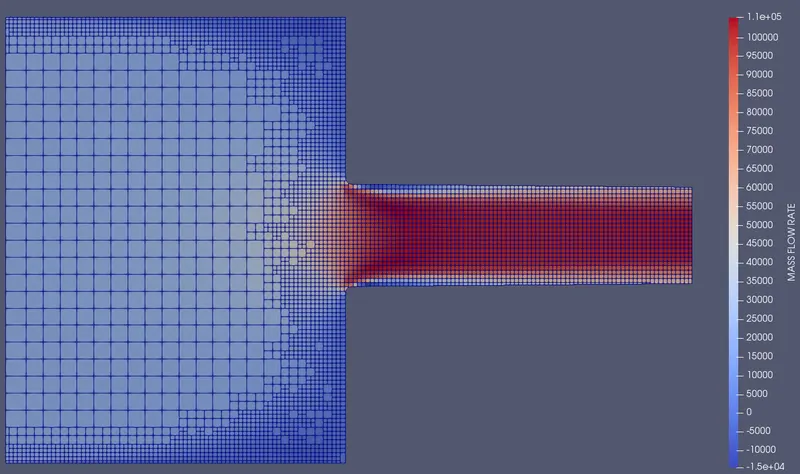
100 BAR
Mass fraction Paraview:
30 BAR
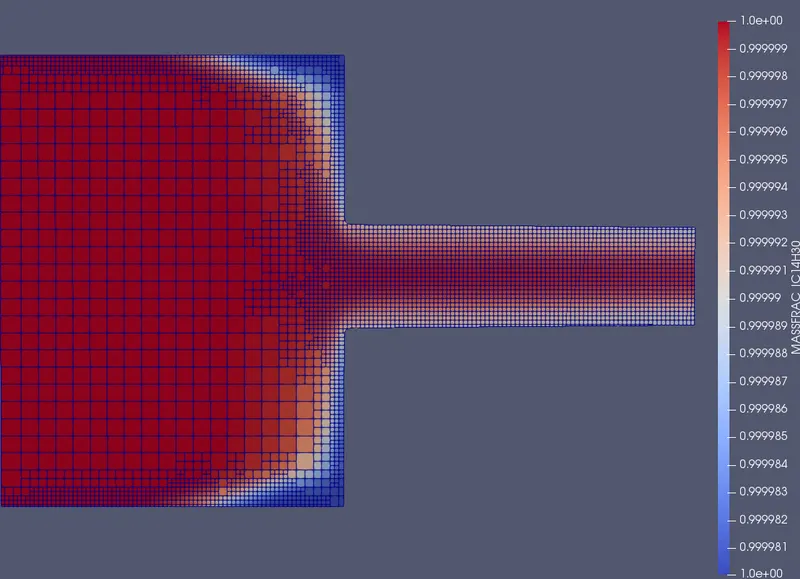
70 BAR
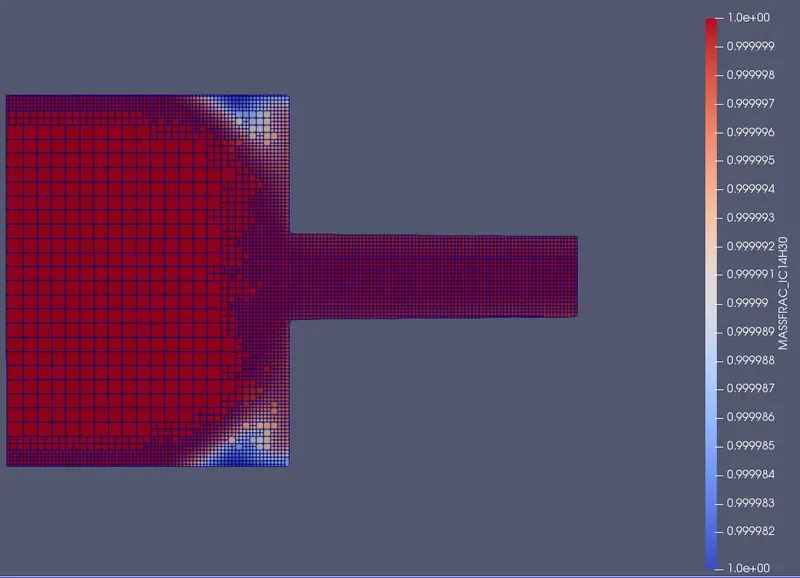
100 BAR
Pressure difference Vs Cavitation zone length
Conclusion
Three variant pressure difference simulation cases were performed obtaining cavitation and postprocessing the result files using Paraview. Seeing that it is a very critical phenomenon that occurs in injectors, hydraulic pumps and affect directly in the performance and failure of the components of the system. Appearing mostly when increasing the pressure difference.
References
- https://www.csidesigns.com/blog/articles/what-is-pump-cavitation-and-how-to-prevent-it
- https://www.machinerylubrication.com/Read/380/cavitation-wear-hydraulic