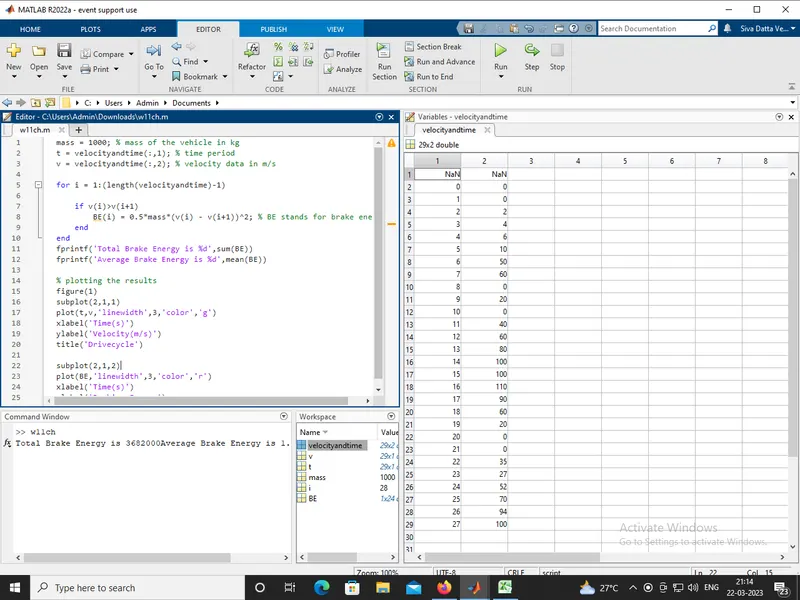
mass = 1000; % mass of the vehicle in kg
t = velocityandtime(:,1); % time period
v = velocityandtime(:,2); % velocity data in m/s
for i = 1:(length(velocityandtime)-1)
if v(i)>v(i+1)
BE(i) = 0.5*mass*(v(i) - v(i+1))^2; % BE stands for brake energy
end
end
fprintf('Total Brake Energy is %d',sum(BE))
fprintf('Average Brake Energy is %d',mean(BE))
% plotting the results
figure(1)
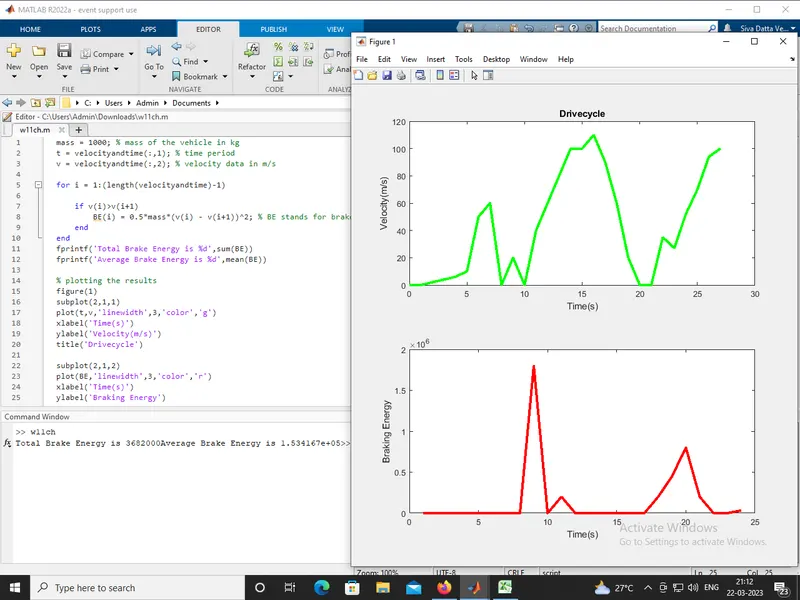
subplot(2,1,1)
plot(t,v,'linewidth',3,'color','g')
xlabel('Time(s)')
ylabel('Velocity(m/s)')
title('Drivecycle')
subplot(2,1,2)
plot(BE,'linewidth',3,'color','r')
xlabel('Time(s)')
ylabel('Braking Energy')
Output results:-
Total Brake Energy is 3682000Average Brake Energy is 1.534167e+05>>
(2).Ans:-
Electric motor can’t develop braking torque at high speed similar to starting:-
* So Electric motor can't develop braking torque at high speed similar to starting, because Braking
torque of an EV Motor is not as high as the Acceleration Torque.
* Therefore Regenerative braking is cannot happen so effectively that we can get all the power back
to the battery.
* The electric motor can't develop braking torque at high speed similiar to starting because once the
electric supply is pulled off from the motor,it acts as a generator.
* And due to the flux weakening effect of the electric generator,the generator produces low torque as
expected.
Regerative Braking:-
* Regenerative braking is a mechanism found on most hybrid and full electric vehicles.
* It captures the kinetic energy from braking and converts it into the electrical power that charges
the vehicle’s high voltage battery.
* Regenerative braking also slows the car down, which assists the use of traditional brakes.
* Regenerative braking is an energy recovery mechanism that slows down a moving vehicle or object by
converting its kinetic energy into a form that can be either used immediately or stored until needed.
* In this mechanism, the electric traction motor uses the vehicle's momentum to recover energy that
would otherwise be lost to the brake discs as heat.
* The most common form of regenerative brake involves an electric motor functioning as an electric generator.
* In electric railways, the electricity generated is fed back into the traction power supply.
* In battery electric and hybrid electric vehicles, the energy is stored chemically in a battery, electrically
in a bank of capacitors, or mechanically in a rotating flywheel.
* The working of the regenerative braking system depends upon the working principle of an electric motor, which is an important component of the system.
* When the applying the breaks the electric motor the free wheeling was occurs in the motor and the electric energy was producted from the motor.
* These produced energy was stored in the battery these procuss was called the regenerative breaking.
Coordination of Electric and Mechanical Brake :-
* In an electric Motor, the Total Brake distribution is in two aspects which are Electrical Brake which is
called Regenerative Brake.
* And Mechanical Brake or Classical Brake with a hydraulic cylindrical system. Brake Force distribution
must be uniform.
* If the Regenerative braking power requirement is more than the charging limit of the battery or
more than the regenerative capacity of the machine we must apply Mechanical brakes as well.
* The reason for how this braking force is combined, that particular phenomena are called Brake Control
Strategies.
* There are two Brake Control Strategies, which are Series - In case of Series, we apply Mechanical brake
and Regenerative electric brake one after another.
* The Series Brake Control Strategy has a further classification, that is based on whether we want the
comfort of driver or Brake behavior compared to energy efficiency.
* Parallel, In the case of Parallel, we apply both brakes simultaneously.
* This Particular Parallel braking is going to happen both at a time.
* The Control criteria such that at low speed use regenerative braking higher and at high speed or
during the initial braking period we actually combine the both.
(3).Ans:-
* Various losses was occur in the electrical vehicle to plot contour line for a given Motor are
(a).iron losses
(b).copper losses
(c).windage losses
(d).Total losses.
MATLAB program for plots contour of given motor speed, torque and efficiency values:-
% A program for plotting efficiency contours for electric motor.
% The X axis corresponds to motor speed(W) and Y axis to torque (T).
% First, setup arrays for range
X = linspace(1,1000); %speed,N.m rad/sec Not rpm
Y = linspace (1,250); %0to40 N.m
% Allocate motor loss constants
Kc = 0.2; %For copper losses
Ki = 0.008; % For iron losses
Kw = 0.00001; % For windage losses
conL = 20; %For constant motor losses
%Now make mesh
[X,Y]= meshgrid(X,Y);
Outputpower = (X.*Y); % Torque*speed= power
B = (Y.^2)*Kc; % copper losses
C = X*Ki; % iron losses
D = (X.^3)*Kw; % windage losses
Inputpower= Outputpower+B+C+D+conL;
Z = Outputpower./Inputpower;
% we now set the efficiencies for which a contour will be plotted
V = [0.70,0.80,0.85,0.90,0.91,0.92,0.925,0.93];
box off
grid off
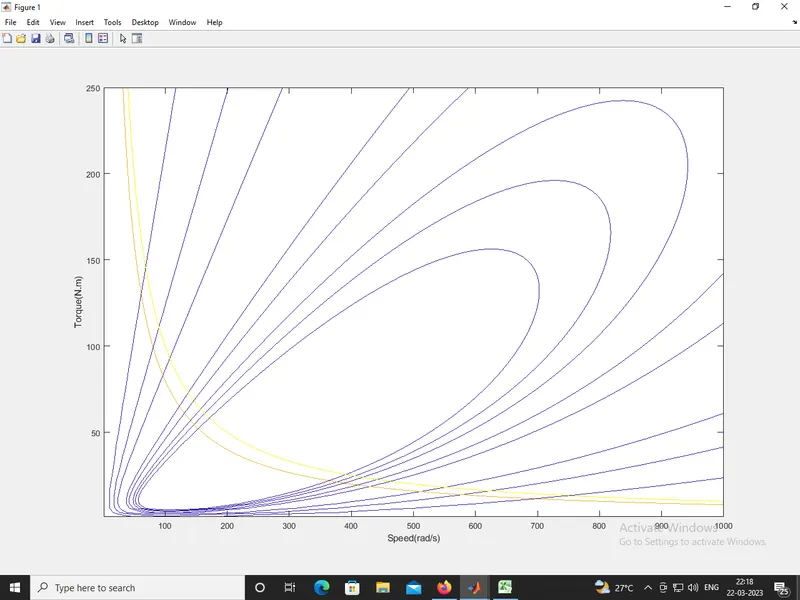
contour(X,Y,Z,V);
xlabel('Speed(rad/s)'),ylabel('Torque(N.m)');
hold on
%Now plot a contour of the power output
% The array output power has already calculated
%We draw contours at 3 and 5 kw
V = [8000,10000];
contour(X,Y,Outputpower,V);
Output results:-