Week-11 Challenge: Braking
AIM : 1. To calculate the energy required for braking.
2. To explain electric and mechanical brakes and how they are co-ordinated also explain why electric motor can’t develop braking torque at high speed similar to starting.
3. To make a MATLAB program which plots contour of given motor speed, torque and efficiency values.
SOLUTION :
1.
* In the images (fig1-3) given below for a drive cycle of 55 seconds and corresponding speed, the energy required for braking is calculated.
* E=(1/2)*m*V^2 is used where E is energy,m is mass and v is velocity that is V2-V1.
* V2 & V1 be final and initial velocities at a specific time while deceleration occurs.
* time is taken is seconds and speed is taken in kmph and then converted into mps while carrying out calculation.
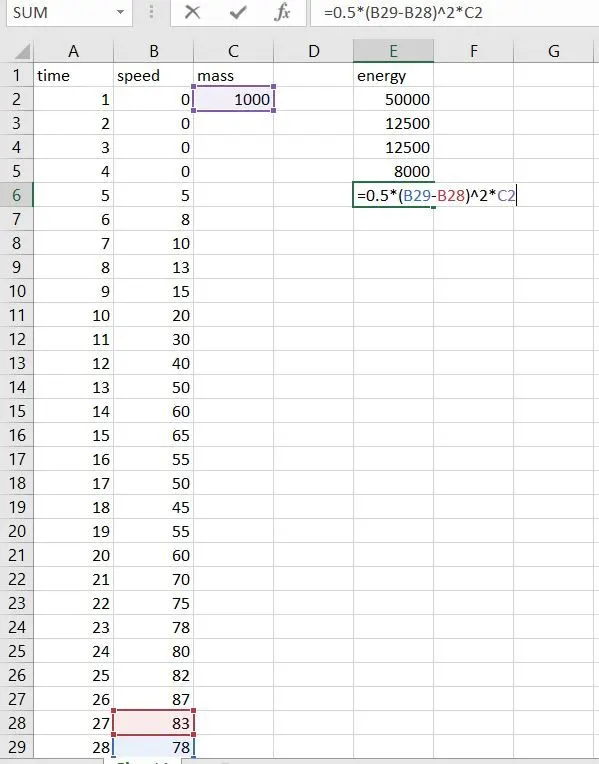
fig1
*The total values of energy are added and converted into KJ.
* We need 139.583 KJ of braking energy for causing deceleration or stopping the vehicle.
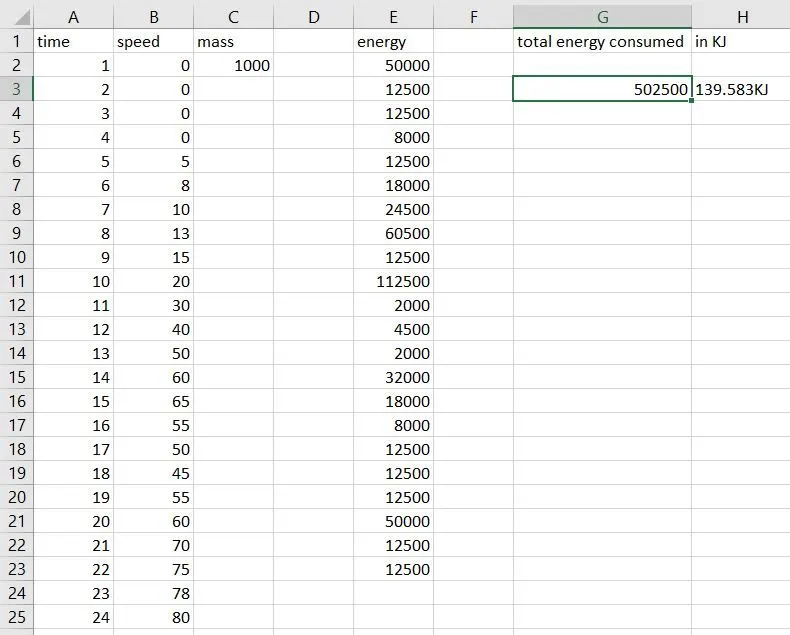
fig2
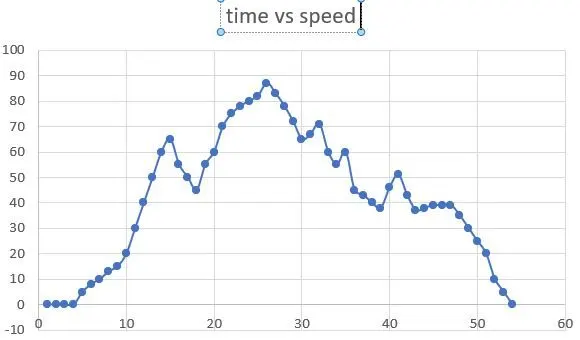
fig3 (time x axis & speed y axis)
2. Brake torque is the force applied at the wheels to stop motion of a moving body.
It is difficult for us to reach maximum torque while accelerating because Vmotor is too close to Vbemf and current cannot be increased further more.
When friction torque and additional loads are equal to motor torque then the system remains in equillibrium position or in constant speed. when friction torque and additional loads are lesser than motor torque then system accelerate and when torque reduces the system decelerates.
The working principle is high speed is achieved with low torque and low speed is achieved with high torque. When a moving system is in rest , a higher amount of torque is need to change its state from rest to motion and thus initially higher torque is needed and speed increases gradually. There is a peak point where torque stops to increase as the working system has already acquired necessary force needed to operate. Next speed increases gradually to a certain point while torque drops down. So here high speed is achieved with lesser torque.
Braking is an important phenomenon in a vehicle system. The system helps us to stop the vehicle whenever it is necessary. There are two different braking systems,conventional and regenerative brakings.
Conventional brakings or mechanical brakings, stop the vehicle through supplying a load to the wheels by use of brake shoes. Brake pedal is connected with a push rod. The push rod is connected with break cyclinder consisting of fluid.When the mechanical brake pedal is pushed , through spring actions the fluid is made pass through brake chamber or pipe line which is connected with brake calipers. This fluid acts as a hydraulic press and pushes breake calipers towards the wheels. The force acts opposite to the movement of vehicle causing a higher frictional load. The kinetic energy is left as heat to ambient.
In regenerative system, an elctrical energy is used in producing frictional braking. unlike conventional braking system, the kinetic energy is used to charge the battery while brakes are applied. The back emf becomes higher and this charges the source. A generator is used to do the charging operation.
There are actually two control strategies , series and parallel.
In series either Conventional brakings or egenerative system is used one at a time
In parallel both systems work simultaneously.
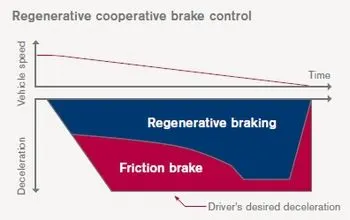
fig4
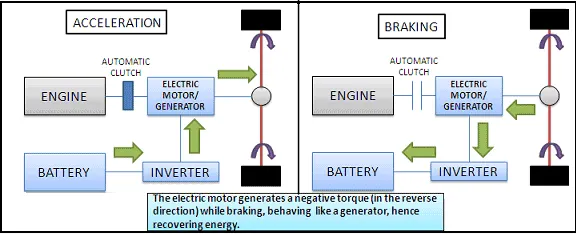
fig5
3.
The given code plots motor speed, torque and efficiency values.
clear all
close all
clc

%program for plotting efficiency contours for electric motors
%setting up arrays

x = linspace(1,1000);
y = linspace(1,250);

%allocating motor loss constants
kc = 0.2;
ki = 0.008;
kw = 0.00001;
ConL = 20;

% Making mesh
[X,Y] = meshgrid(x,y);

%Torque x Speed = power
Outputpower = (X.*Y);

% Copper losses
B = (Y.^2)*kc;
% Iron losses
C = X*ki;
%Windage losses
D = (X.^3)*kw;

Inputpower = Outputpower + B + C + D + ConL;
Z = Outputpower./Inputpower;

% plotting and setting the efficiencies
V = [0.70,0.80,0.90,0.91,0.92,0.925,0.93];
box off
grid on
contour(X,Y,Z,V);
xlabel('speed/rad.s^-1');
ylabel('Torque/N.m');
hold on
% the array output power has been calculated
V = [8000,10000];
contour(X,Y,Outputpower,V);
* The image represents motor speed and torque and its corresponding efficiency.
* As we could see when speed decreases the torque increases and when speed increases torque decreases. At an optimum speed torque the efficiency is higher. Maintaining a lower or higher speed always may result in fall in efficiency. As the contour falls in the middle, there is an increase in efficiency.
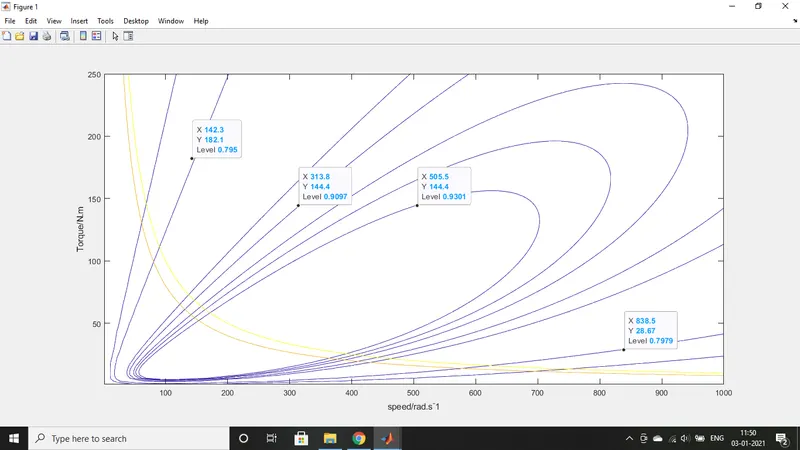
fig6