Week-11 Challenge: Braking
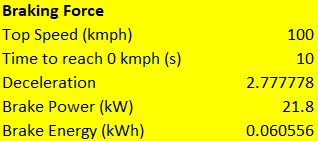
1) For a defined driving cycle, calculate the energy required for braking.
The work done by the brake is equal to the change in kinetic energy.
W.D_Brakes = 1/2*m(v2^2 - v1^2);
Assume m = 1000kg
Hence, assuming in the drive cycle, the brakes are applied to bring the velocity from 15 m/s to 5 m/s, then,
Energy required for braking = 0.5 * 1000 * (15^2 - 5^2)
= 100 kJ
= 0.028 kWh.
2) Why electric motor can’t develop braking torque at high speed similar to starting? How electric and mechanical brakes are coordinated?
An electric motor cannot develop high braking torque at high speeds, since generally at high speeds, the speed-torque characteristic will be in the constant power region, and not in the constant torque region. This occurs because we are operating the motor at speeds above the base speed where the torque output is compromised. This is why braking torques are lower than acceleration torques, and in general, torque output from the motor at high speed is less than the torque output at lower speeds for an AC induction motor.
Considering the total brake force distribution in EVs and HEVs, the regenerative and friction brake distribution is a choice.
There are two common brake control strategies - series (one at a time, either regenerative or mechanical) and parallel - (both simultaneously).
The amount of each of the brake method used depends on the design of the brakes, motor and power electronics. Generally, a control law is developed, and a compromise between maximum regeneration, brake force, deceleration time, comfort, etc. is made.
These strategies have further bifurcations, and these are divided on the basis of the compromise between brake behaviors and comfort versus brake efficiency.
3)
The contour plot has been made using certain assumptions. It has been made by subtracting the losses from the input power to obtain the output power. Eff is then output/input.
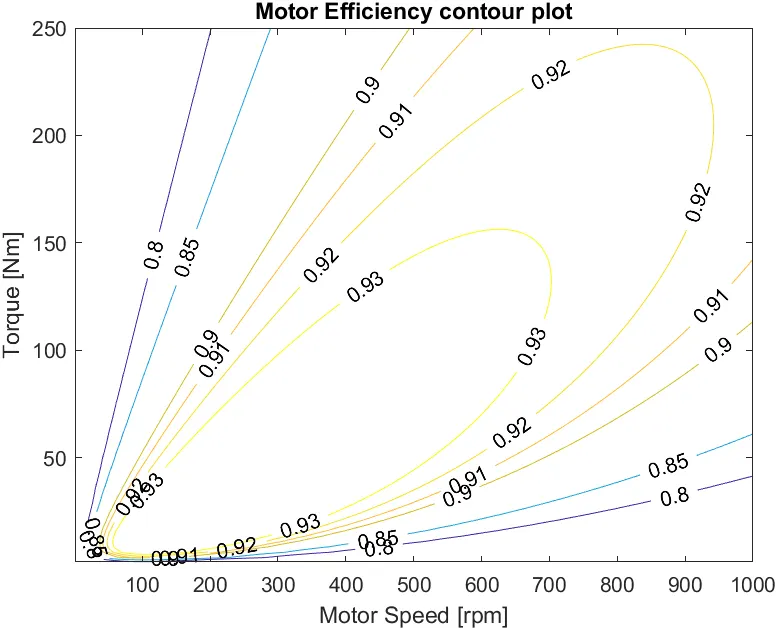
The MATLAB file has been attached.
Code -
% Program to plot efficiency contours for electric motors.

% x, y = w, T

% Set up arrays for range.
x = linspace(1,1000); %Speed in rad/s not RPM.
y = linspace(1,250); % 0 to 40 Nm

% Initialise motor loss constants
kc = 0.2; % Copper Losses
ki = 0.008; % Iron Losses
kw = 0.00001; % Windage Losses
Const_Losses = 20; % Constant motor losses

% making the mesh
[X, Y] = meshgrid(x,y);
output_power = (X.*Y); % Torque * Speed = Power
B = (Y.^2)*kc;
C = X*ki;
D = (X.^3)*kw;
input_power = output_power + B + C + D + Const_Losses;
Z = output_power./input_power;

% We can not set the efficiencies for which the contours will be plotted
V = [0.80, 0.85, 0.90, 0.91, 0.92, 0.93];
box off
grid off
contour(X, Y, Z, V, 'ShowText','on');
xlabel('Motor Speed [rpm]')
ylabel('Torque [Nm]')
title('Motor Efficiency contour plot')