Week-11 Challenge: Braking
A. For a defined driving cycle, calculate the energy required for braking
Calculating the energy required for braking of UDDS Drive Cycle-
Braking: Braking is a condition to slow down or stops a moving vehicle as required. There are several techniques to apply brakes, which can be mechanical or electrical. The most commonly used technique is by applying friction. It consumes energy. The consumed kinetic Energy can be derived as the following equation-
Braking Energy = (1/2)*m*v^2
Where Braking Energy is the kinetic energy in a unit of Joule.
m= Total Mass of the Vehicle (Vehicle Mass + Pay Load) in a unit of Kg.
v= (Initial Velocity-final Velocity) in unit m/s.
For Example, if the Initial speed of a vehicle is 20m/s and the final speed is 10m/s. The mass of the vehicle is 500kg. Then the required kinetic energy for Braking is (1/2)*500*(20-10)^2 = 25000 J =25KJ
Here for a Drive cycle, the required braking energy is calculated for each second of time to slow down or stop the vehicle- Braking Energy Calculation for UDDS Driving Cycle
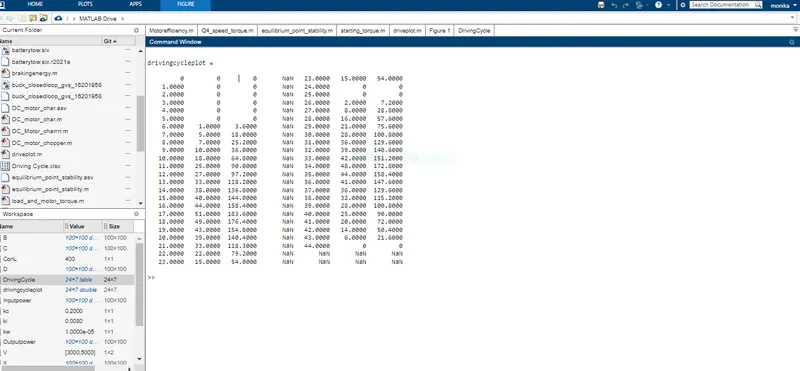
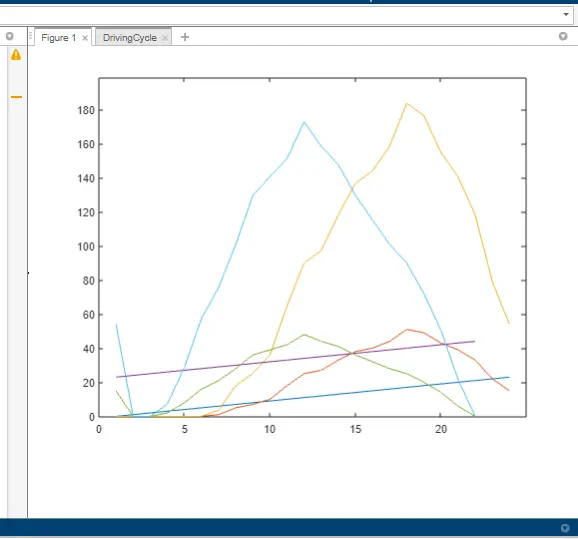
using that drive cycle plot, the values from the braking regions of the vehicle are taken. The plot of the drive cycle is given below.
| Vehicle weight - 1000kg | |||||||
| No. of Braking | Initial velocity (kmph) | Final velocity (kmph) | Time required (s) | Deceleration (m/s^2) | Energy required (J) | Braking power (W) | Braking energy (Wh) |
| 1 | 60 | 40 | 3 | 1.85 | 277778 | 92592.6 | 25.7 |
| 2 | 50 | 30 | 3 | 1.85 | 222222 | 74074.1 | 20.6 |
| 3 | 80 | 20 | 11 | 1.52 | 833333 | 75757.6 | 21.0 |
| 4 | 60 | 40 | 3 | 1.85 | 277778 | 92592.6 | 25.7 |
| 5 | 50 | 30 | 3 | 1.85 | 222222 | 74074.1 | 20.6 |
| 6 | 80 | 0 | 7 | 3.17 | 888889 | 126984.1 | 35.3 |
| Total braking energy required (Wh) | 148.9 | ||||||
B. Why electric motor can’t develop braking torque at a high speed similar to starting? How electric and mechanical brakes are coordinated?
Let us consider the torque speed characteristics.
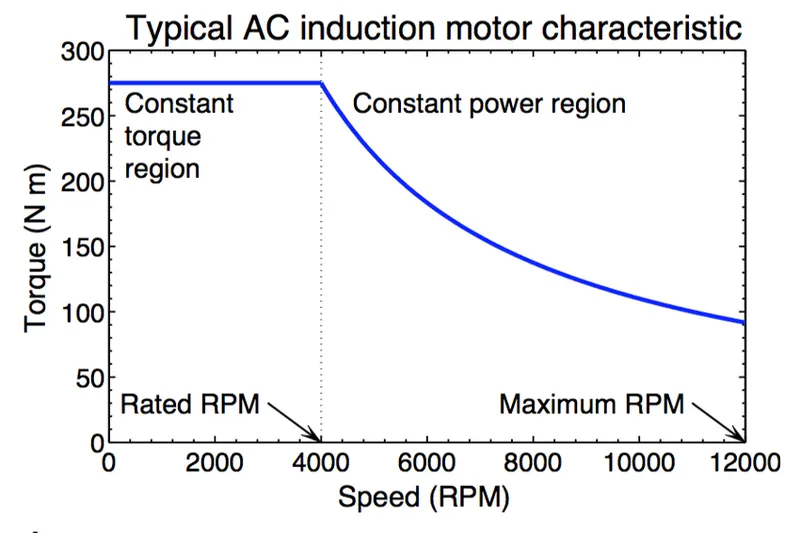
From this curve, we have two regions, the constant torque, and the constant power region. At the start, the motor achieves peak torque till it reaches a certain motor speed range from where it will rapidly drop. The reason due to drop in torque is due to the motor shaft reaching critical speed and the area where the peak torque is constant is known as the constant torque region of the motor. The region where the torque decreases is known as the constant power region as the power generated by the motor will be at its peak.
Since the torque produced at the constant power region is very low, it is not possible to develop enough braking torque in this region. The braking torque produced increases as the speed decreases.
How are electric brakes and mechanical brakes coordinated?
In electric vehicles, two types of braking systems are used electric brake system and a mechanical brake system.
Electric Braking System: In electrical braking, the winding of the motor is used to produce a braking torque. Braking torque is developed during the braking operation. This braking torque opposes the motion of the rotating member or shaft. This is achieved by suitably changing the electrical connections of the motor. The motor operates on a speed–torque characteristic, depending upon the method of braking employed.
Mechanical Braking System: In mechanical braking, the frictional force between the rotating parts and the brake drums produces the required braking. To achieve this, mechanical equipment, such as brake linings and brake drums, are required. Whether electrical or mechanical, the braking of the drive should stop the motor at the specified point of time and position.
The electric braking system used in EVs and HEVs is regenerative braking. This method uses the motor as a generator during braking, developing a retarding torque, which acts on the running motor and halts it. The kinetic energy and potential energy, minus the losses of the motor are returned to the mains and the motor runs at a constant speed. Thus, regenerative braking eliminates the tendency of the load to accelerate the motor.
Mechanical braking systems used can be either disc or drum brake systems. Where in the case of a disc brake system friction pads rub against a disc when the brake pedal is applied and the kinetic energy is converted to heat and slows the vehicle down. In a drum brake system, a set of brake shoes which are the friction materials press against a drum.
Since the braking torque is very less at high speeds, mechanical brakes are applied to slow down the vehicle. As the motor reaches the constant torque region the regenerative braking system takes effect where the motor acts as a generator and the negative torque produced charges the battery pack.
C. Make a MATLAB program that plots the contour of given motor speed, torque, and efficiency values. Attach the code as a .m file and attach a screenshot of all the plots.
MATLAB Code:
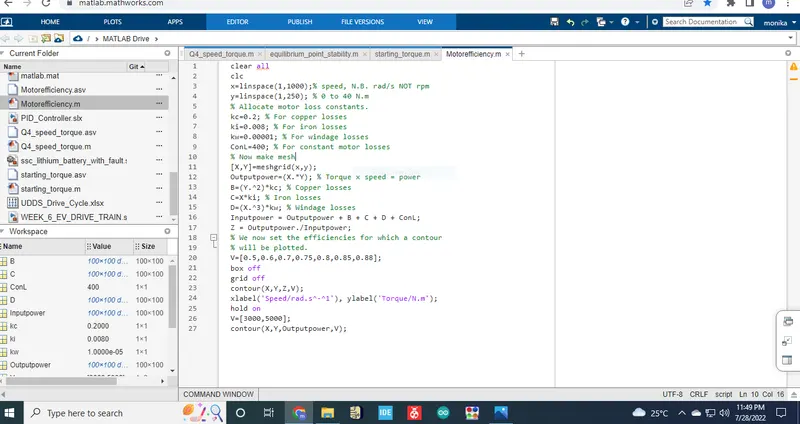
In this MATLAB script, we create arrays for the speed and the torque of the motor using the ‘space’ command. For the speed, consider a range of values from 0 to 2000 radians per second whereas for the torque, consider a range of values from 0 to 300Nm. These arrays are then used to create 2D grid coordinates using the ‘mesh grid’ command. These coordinates will help in the creation of the contour plot. In order to find the efficiency of the motor, we need to consider the various losses that occur in the motor’s operation. These are:
Copper losses
Iron losses
Windage losses
Conduction losses
These various losses are dependent on the speed and the torque of the motor. They each also have a characteristic constant of proportionality which are all assumed for the following calculations and represented as 'K'. In each calculation, the speed and the torque are represented respectively as: ω and T.
Copper losses = KCu⋅ω2
Iron losses =KFe⋅T2
Windage losses =Kw⋅T3
The values of coefficients are taken as general values. Conduction losses are assumed to be 18 Joules.
Finally, we plot the contour with the 'contour' command. In addition, an array for the efficiency values we want to plot for is created called 'W' and is assigned for values ranging from an efficiency level of 0.75 to 0.95. This array is used in the creation of the contour. Axis labels and a title is also made for better readability.
Output: