Week - 4
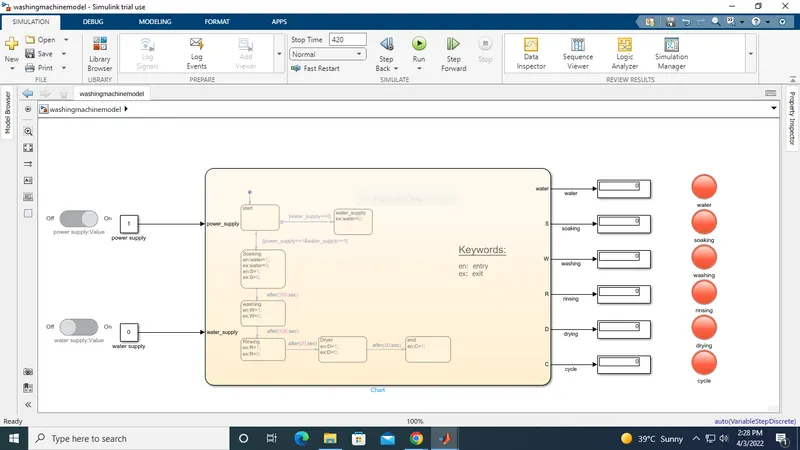
A: To impliment the control logic of a washing machine.
Ans here we are use various block set i.e.
chart block, slider switch, constant, display, lamp.
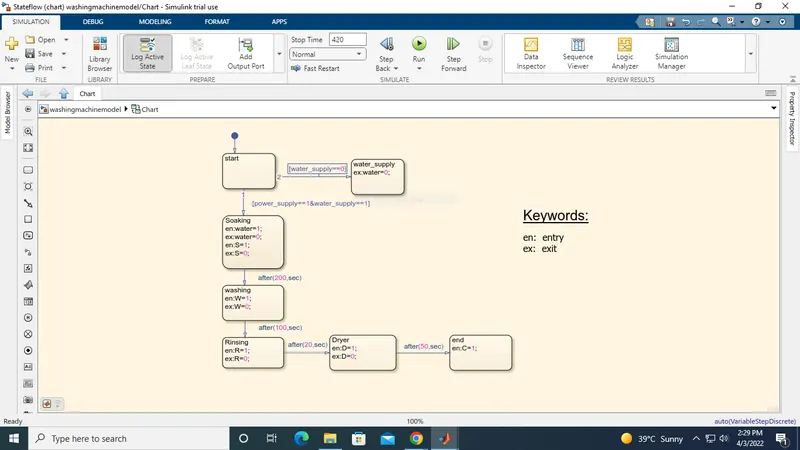
1. To create a chart block for defining the state flow as per given condition.
2. inside it circular junction is create to terminal signal flow of returns.
3. if power is off i.e. 0. the process is terminated junction else the 1c carry forwarded.
4. after 300 sec of soaking, washing blocks gets activated and washing process is takes place.
5. after 320 sec the washing, the rinsing block gets activated and process takes place.
6. after 370 sec the washing , the drying block gets activated and washing process takes place.
after that signals flow in process and exist the chart. defined the power and water input and soaking, washing, drying and rinsing the output.
Representation of block diagram of model:
Working
The working of washing machine is centrifugal. it means a separation process that uses the action of centrifugal force to promote accelerated setting of a particles in a solid -liquid mixture.
here various processes during washing.
soaking: Light wispy soaking coming from the bottom of washing machine indicates a problem with the transmission shitting solenoid. smoke coming from upper block of the machine indicates a bad fill value solenoid and smoke coming from control panel indicates a bad timer motor.
washing: During the wash cycle a large plastic sturns around moving your cloths through the water.
Rinsing: the dirty , scopy water is drained through waist water pipe, then machine is refill water and rewashed the cloths with clean water.
Dryer: Dryer work by pushing warm dry air through wet washing to extract moisture then cooling and humid air in a heat exchange to condence the machine.
Control Logic:
It checks for the extent of drift and grease the amount of soap and water. To add water, time of process direction of spin . if machine unbalanced for washing load to ensure correct spinning else we reduces spinning speed it comes in balance condition. then washing load reduces spinning noise.
the system are observed to sometimes , check and proceed to completed by system. the green light as displayed on result on the screen.
Stateflow block:
Symbol pane: power supply, water supply, water, D, R, S, W, C.
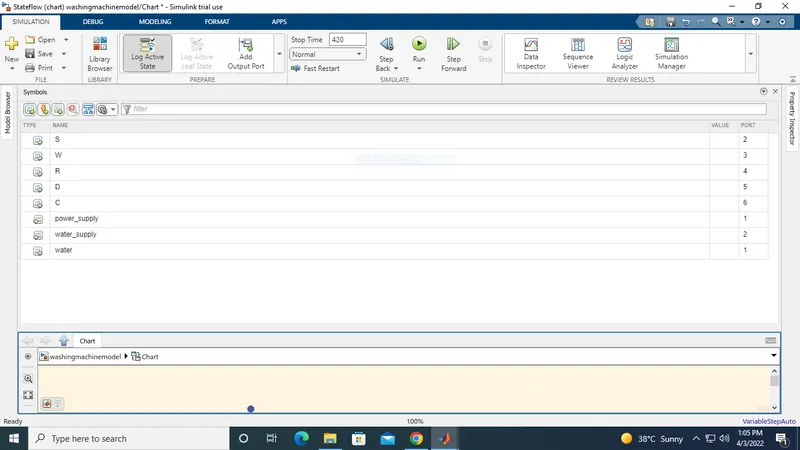
irrespective outputs which are connected to the displays which are assigns and switch which is also assign for input for ON and OFF operations.
output:
there are two condition i.e.
Condition 1: when water supply is OFF
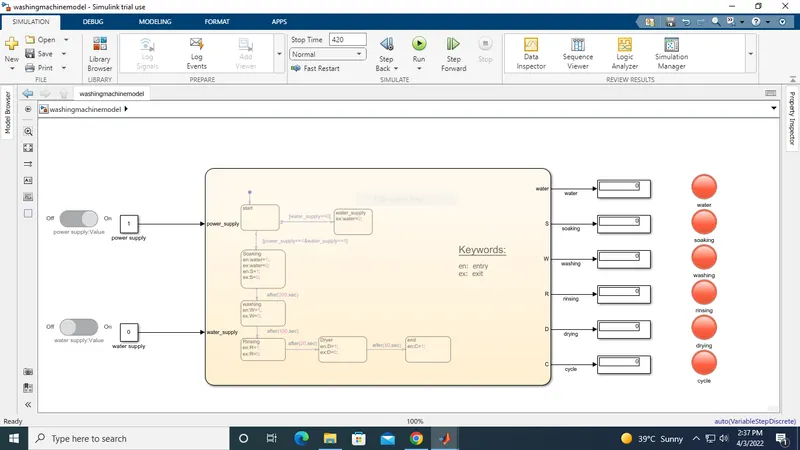
from above diagram, we can see in indicator of water is showing is RED i.e. when there is no water supply the process is terminated.
Condition 2: when water supply is ON
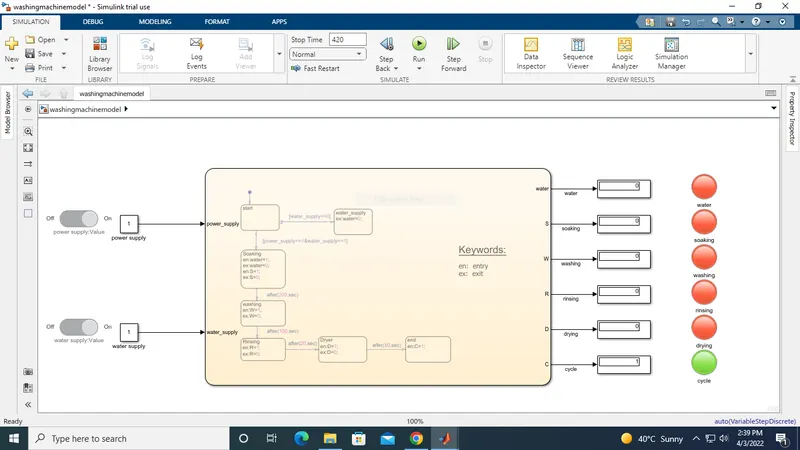
here we can observe ,all the states have been executed and after that indicates the process completion indicator i.e. GREEN light.
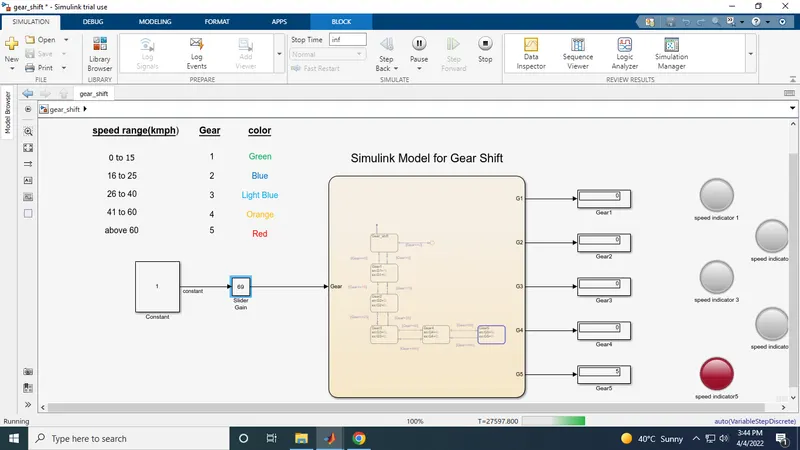
B: To make a simulink chart for gear shift.
Block which are used in control logic
slider block, Constant, display, chart Block.
here we give input while the simulation is running and display the gear no:
1. Condition: speed Range(kmph) gear
0 to 15 1
16 to 25 2
26 to 40 3
41 to 60 4
above 61 5
Stepwise Procedure: To Create a chart block for defining the stateflow as per given condition.
1. if speed is less than equal to 0 flow is terminated and gear 0 is activated and junction 1 is carry forwarded.
2. if speed is greater than 0 and equal to 15 flow is terminated and gear 1 is activated.
3. if speed is greater than 15 and equal to 25 flow is terminated and gear 2 is activated.
4. if speed is greater than 25 and equal to 40 flow is terminated and gear 3 is activated.
5. if speed is greater than 40 and equal to 60 flow is terminated and gear 4 is activated.
6. if speed is greater than 60 flow is terminated and gear 5 is activated.
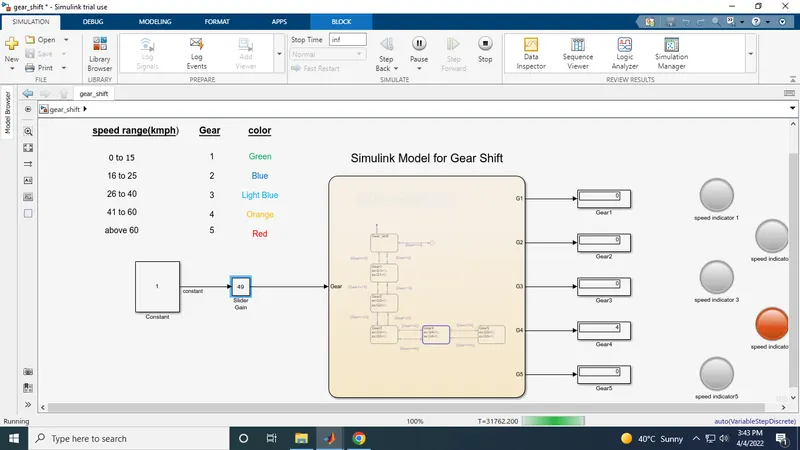
Representation of block diagram of model:
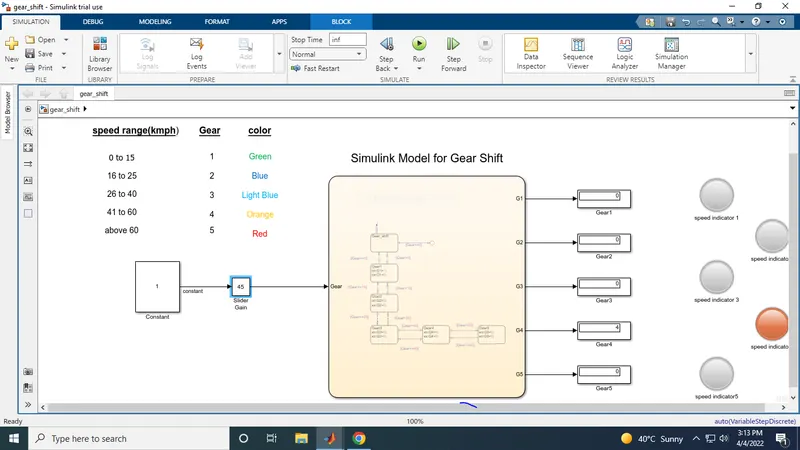
Working:
In this System gives the speed range is 0-100 so, we use slider block for the given input speed. the first gear speed range is 0-15 so entry state for the 1st gear is 0<=speed range and the 15>=speed range.it is existing condition of gear in speed. in 2nd gear entry state 16<=speed range and 25>= speed. it is existing condition of gear in speed.then at same time we have remaining three gears are left.in each gear have a different speed. so we can set the chart box enter values like speed is the input and the gear is the output.
control Logic: In stateflow Charts shows the conditions of gear is respectively 1,2,3,4,5 etc.
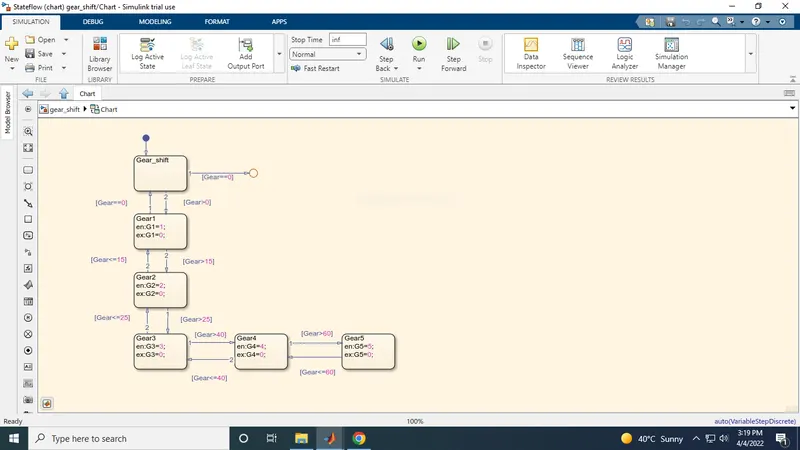
Symbol Pane: In this, Gear means speed is input and G1,G2,G3,G4,G5 are output
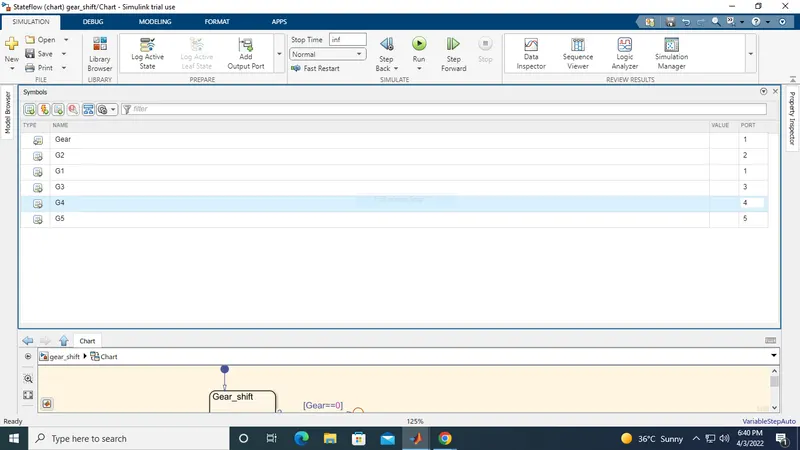
simulation time is infinite
Input: Input of speed in the form of slider gain
output:
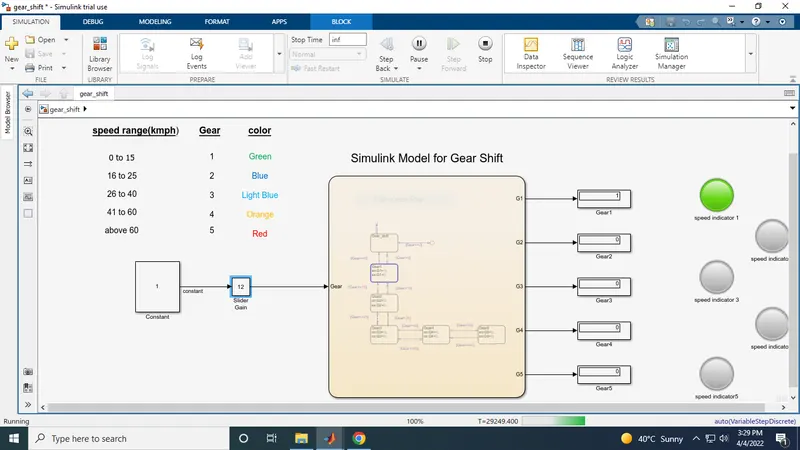
Condition 1: speed range 0 to 15 (kmph)
when the speed in between 0 to 15, that time in display block gear no.1 shows and in lamp indicator Green light is blow.
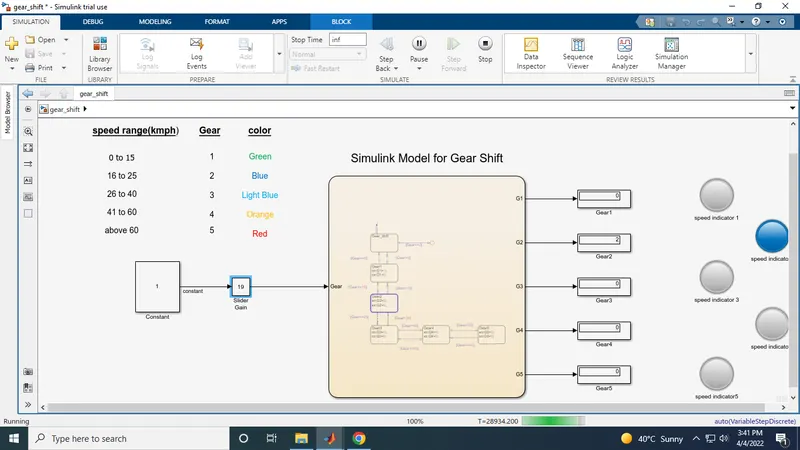
Condition 2: speed range 16 to 25 (kmph)
when the speed in between 15 to 25, that time in display block gear no.2 shows and in lamp indicator Blue light is blow.
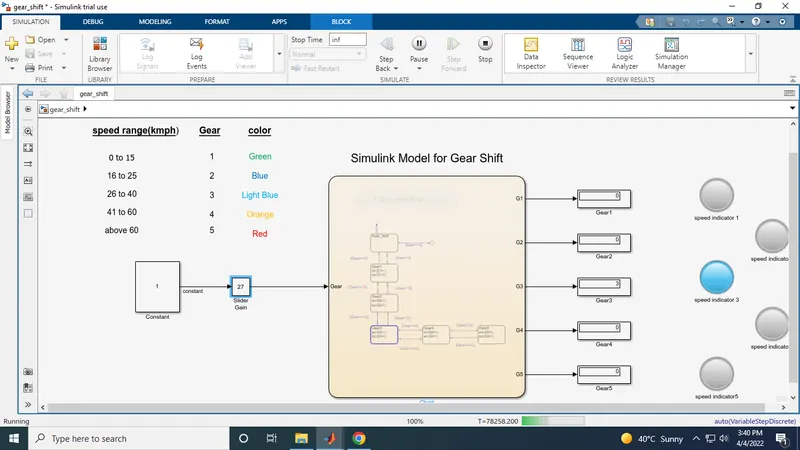
Condition 3: speed range 26 to 40 (kmph)
when the speed in between 41 to 60, that time in display block gear no.3 shows and in lamp indicator Light Blue light is blow.
Condition 4: speed range 41to 60(kmph)
when the speed in between 41 to 60, that time in display block gear no.4 shows and in lamp indicator Orange light is blow.
Condition 5: speed range Above 60 (kmph)
when the speed Above 60, that time in display block gear no.5 shows and in lamp indicator Red light is blow.