Week-11 Challenge: Braking
- For a defined driving cycle, calculate the energy required for braking.
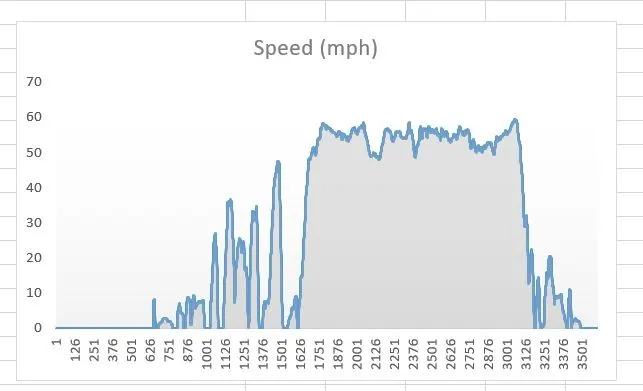
Please refer to the Excel sheet attached to verify the calculation.
Steps involved:
- A particular drive cycle data is being chosen.
- Convert mph to Kmph.
- Calculate Vf-Vi. A negative value denotes deceleration
- Filter out the entries with negative Vf-Vi entries (it shows deceleration). Rest are assigned with 0.
- Calculate (vf-Vi)^2.
- Take the sum of the all the entries for the previous column.
- Multiply 0.5 and mass of the vehicle to the above mentioned column.
- This will result in total braking energy.
For the chosen drive cycle data for a heavy duty truck having mass approx. 4500Kg, the total braking energy is calculated as 2939 KJ.
2.Why electric motor can’t develop braking torque at high speed similar to starting? How electric and mechanical brakes are coordinated?
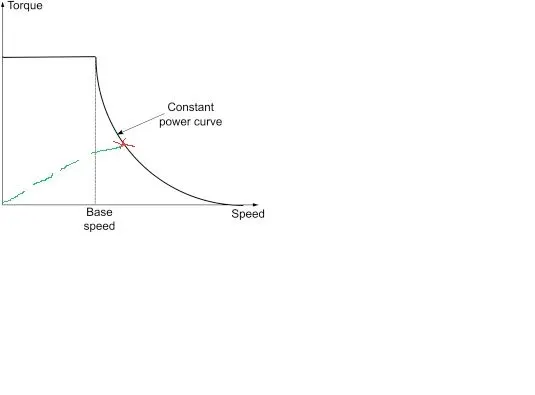
In case of acceleration, the motor operates in the constant torque region. Hence it is capable of building the acceleration. But when the vehicle is running at a higher speed (let’s say more than base speed), the motor operates in a constant power region and in this region the torque keeps on falling.
So the torque during deceleration would be less than that of acceleration.
Referring to the figure below one can see that the maximum torque (negative) during deceleration is less (marked by red cross). Whereas peak torque during acceleration is the straight horizontal line which is quite high than the red cross one.
refer to the figure attached.
Electrical and Mechanical Brake coordination:
Electrical Braking: In case of Electrical braking, the supply to the motor is cut off and hence motor takes its own time to stop. Depending on the inertia and air drag force this may take longer before the vehicle comes to halt.
Mechanical Braking: In mechanical braking, a mechanical(friction) force is applied through the pedals to stop the movement of the tyres.
The coordination between these two can be done in two ways.
- Series: one brake is applied after the other.
- Parallel: both act together.
- Electric driven Intelligent brake: in this case, a strategy is being decided to meet the requirement of both electric and friction brake.
3.Make a MATLAB program which plots contour of given motor speed, torque and efficiency values. Attach the code as a .m file attach a screenshot of all the plots.
The different steps for plotting the contour mentioned in question are as follows:
- Clearing the workspace and the command window
- clc
- close all
- clear all
- Define the torque and speed range.
- w=linspace(1,1000); %speed in RPS
- t=linspace(1,250); %torque in Nm
- Define the loss constants.
- kc=0.2; % copper loss constant
- ki=0.008; % Iron loss constant
- kw=0.00001; %windage loss constant
- conL=20; % constant loss of the motor
- Calculate the motor losses using values defined in step 2 and 3.
- B= kc*(T.^2); %Copper loss
- c= ki*W; % Iron loss
- d= kw*(W.^3); %Windage loss
- Calculate motor input and output power.
- Pin=Pout+B+c+d+conL;
- Pout=W.*T;
- Calculate efficiency of the motor
- eff= Pout./Pin;
- Define range of efficiencies for the contour plotting.
- v=[0.7,0.8,0.85,0.9,0.91,0.92,0.925,0.93];
- Plot the contour for speed, torque and defined range of efficiencies.
- [W, T]=meshgrid(w,t);
- box off
- grid off
- contour(W,T,eff,v)
- Hold the previous graph
- hold on
- Define motor power
- v=[8000,10000];
- Plot a new contour for speed, torque and motor power.
- contour(W,T,Pout,v)
- xlabel('speed(rad/sec)')
- ylabel('Torque(Nm)')
As it can be seen in the graph, there are different almost circular blue lines which describe the behaviour of the particular motor at different speed and torque range.
refer to the figure attached.
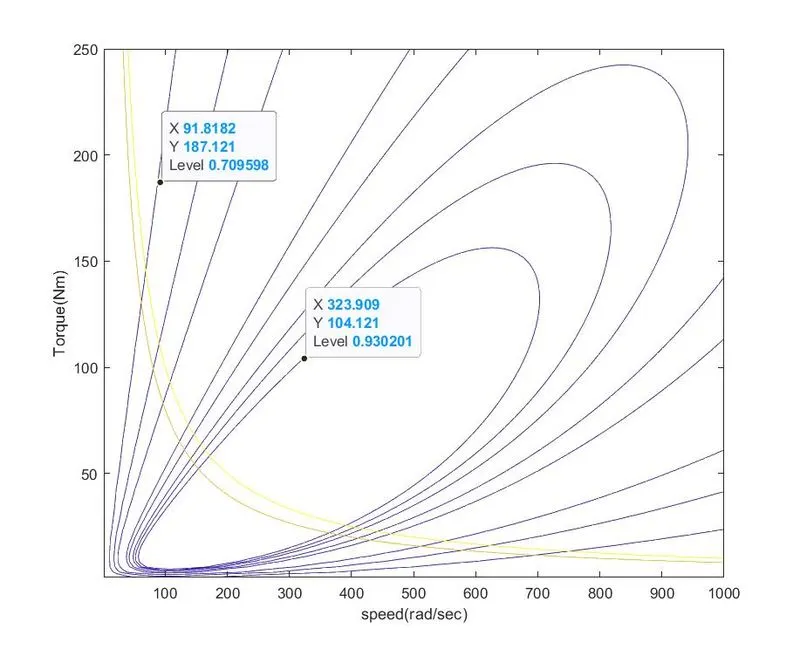
The inner most line is the projection of the highest efficiency (93%) of the motor for different speed and torque range.
The outer most line is the projection of the lowest efficiency (93%) of the motor for different speed and torque range.
On a same contour, it shows the different toque and speed for same efficiency.
Similarly, the two yellow lines are for the motors with 8Kw and 10 Kw output power. The graph makes us understand for how much efficiency what should be the torque and speed range for these two motors.
Note: a word file of complete solution, matlab code file, related figures and an excel sheet for braking energy calculation is attached for your reference.