Week-11 Challenge: Braking
- For a defined driving cycle, calculate the energy required for braking.
ANSWER:-
- For driving cycle we have used UDDS duty cycles upto 1370 seconds we can use beyond the range also.
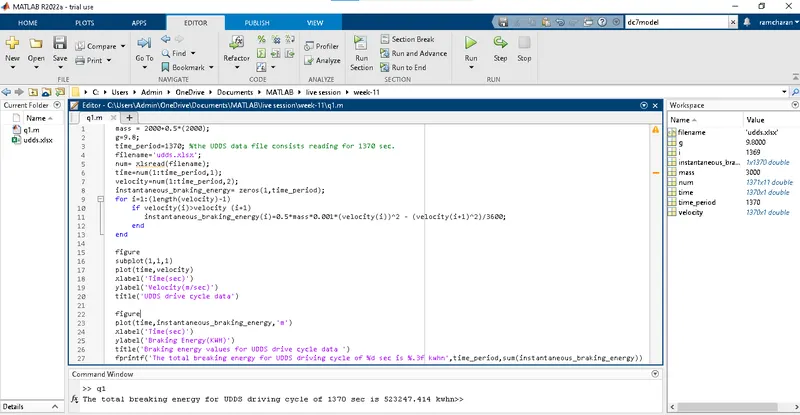
- We bring that excel file into matlab and we know the braking energy formula,

- For the duty cycle we applied the braking energy is calculated by taking the mass,initial velocity & final velocity.
mass = 2000+0.5*(2000);
g=9.8;
time_period=1370; %the UDDS data file consists reading for 1370 sec.
filename='udds.xlsx';
num= xlsread(filename);
time=num(1:time_period,1);
velocity=num(1:time_period,2);
instantaneous_braking_energy= zeros(1,time_period);
for i=1:(length(velocity)-1)
    if velocity(i)>velocity (i+1)
       instantaneous_braking_energy(i)=0.5*mass*0.001*(velocity(i))^2 - (velocity(i+1)^2)/3600;
    end
end

figure
subplot(1,1,1)
plot(time,velocity)
xlabel('Time(sec)')
ylabel('Velocity(m/sec)')
title('UDDS drive cycle data')

figure
plot(time,instantaneous_braking_energy,'m')
xlabel('Time(sec)')
ylabel('Braking Energy(KWH)')
title('Braking energy values for UDDS drive cycle data ')
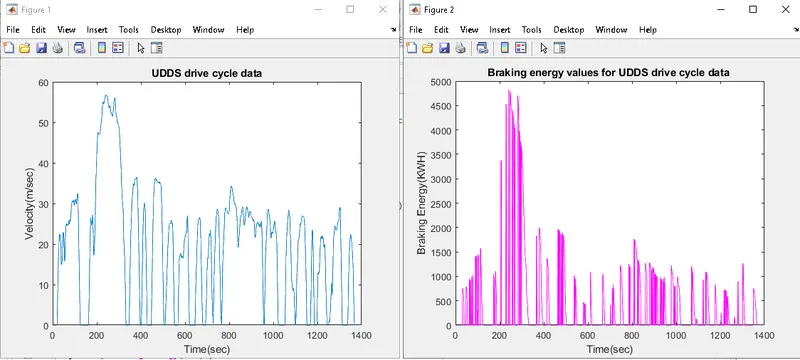
fprintf('The total breaking energy for UDDS driving cycle of %d sec is %.3f kwhn',time_period,sum(instantaneous_braking_energy))
The scripted file is uploaded.
OUTPUT:-
- Thus we have plotted the graph to calculate the braking energy required for the UDDS duty cycle.
2.Why electric motor can’t develop braking torque at high speed similar to starting? How electric and mechanical brakes are coordinated?
ANSWER:-
- The below graph shows the speed- torque charactristics of motor.
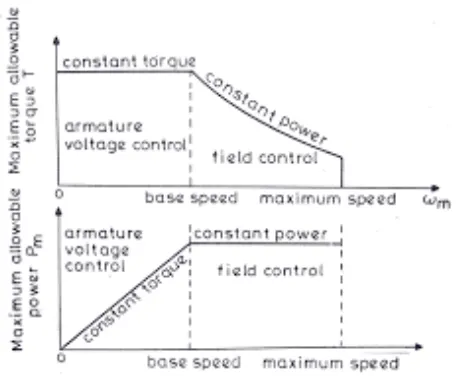
- When motor reaches max speed it has constant torque, and after reaching base speed it having downslope which has constant power region(Accelerating operation).
- For deacceleration the below image has shown which will be having the speed(+ve) and torque(-ve).
- By above image we can say if motor producing 10Nm torque for acceleration then it can also produce -10Nm for breaking..
- Because we are operating in the field weakening region,and operating above the base speed.
- Thus peak acceleration torque is greater than peak deacceleration torque.
- Thus it has high torque ,low speed in acceleration mode and for deaccelration it has low torque for high speed.
Electric driven intelligent brakes,
At low speed : Regeneraive brakes are applied,
At high speed : Both regenerative and hydraulic (mechanical) brakes are used
There are two brake controls they are,
series :- In series we apply mechanical brakes or regenerative braking one after another.
Parallel:- we apply both mechanical brakes and regenerative brakes simultaneously.
3.Make a MATLAB program which plots contour of given motor speed, torque and efficiency values. Attach the code as a .m file attach a screenshot of all the plots.
ANSWER:-
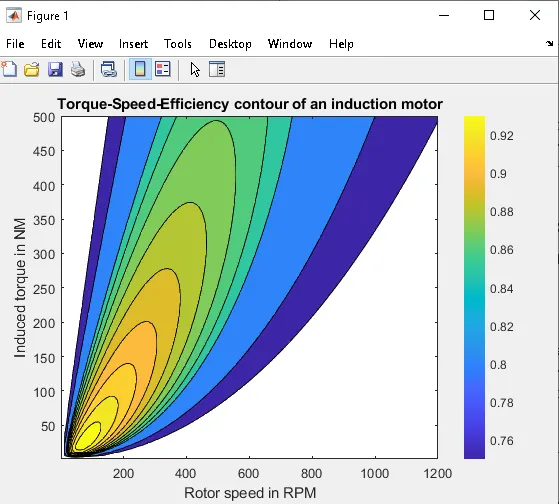
- we have plotted the torque vs rotor speed in the graph.
- We have used contour plotting as we assigned.
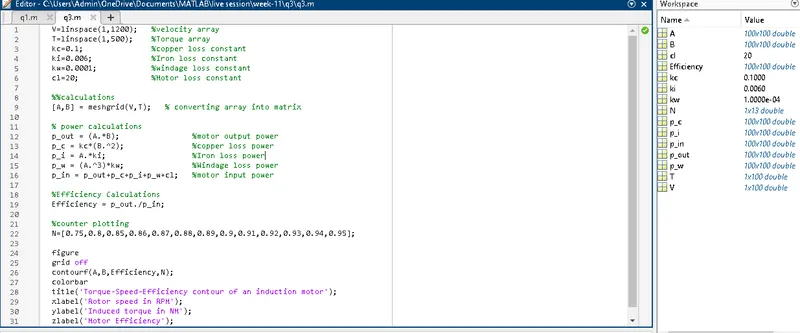
- we are converting the array into matrix form, We used power calculation while considering the various losses
- Input power is calculated using p_in = p_out+p_c+p_i+p_w+cl
- Efficiency is calculated by p_out./p_in
V=linspace(1,1200);   %velocity array
T=linspace(1,500);    %Torque array
kc=0.1;               %copper loss constant
ki=0.006;             %Iron loss constant
kw=0.0001;            %windage loss constant
cl=20;                %Motor loss constant

%%calculations
[A,B] = meshgrid(V,T);   % converting array into matrix

% power calculations
p_out = (A.*B);                %motor output power
p_c = kc*(B.^2);               %copper loss power
p_i = A.*ki;                   %Iron loss power
p_w = (A.^3)*kw;               %Windage loss power
p_in = p_out+p_c+p_i+p_w+cl;   %motor input power

%Efficiency Calculations
Efficiency = p_out./p_in;

%counter plotting
N=[0.75,0.8,0.85,0.86,0.87,0.88,0.89,0.9,0.91,0.92,0.93,0.94,0.95];

figure
grid off
contourf(A,B,Efficiency,N);
colorbar
title('Torque-Speed-Efficiency contour of an induction motor');
xlabel('Rotor speed in RPM');
ylabel('Induced torque in NM');
zlabel('Motor Efficiency');
- Remaining parameters we have taken as constant and asumptions for (V ,T)
- By using the parameters the contour plot also plotted for cotour mapping.
OUTPUT:-
- The Torque speed efficiency contour of an induction motor is plotted in the graph
- By using the colours we can speed of rotor with respect to the torque produced.