Week-11 Challenge: Braking
1. For a defined driving cycle, calculate the energy required for braking.
A drive cycle is typically represented by a series of data points which plots vehicle speed against time. Driving cycles are produced to assess the performance of vehicles in various ways, including fuel consumption and pollutant emissions.
Drive cycles are typically represented by a graph which plots vehicle speed against time,” Johnson explains. “Data for defining a drive cycle can be collected using various technologies, such as a dedicated onboard data logger, telematics or downloading data from the vehicle CAN (controller area network) bus.”
A CAN bus is network that connects individual systems and sensors as an alternative to conventional multi-wire looms.
Using the data represented in a drive cycle graph, critical vehicle operational statistics can be determined, he says. This includes such things as:
- Maximum speed.
- Average speed.
- Number and frequency of vehicle starts and stops.
- Idle time.
- Engine- off time.
- Total engine hours per cycle
Braking distance refers to the distance a vehicle will travel from the point when its brakes are fully applied to when it comes to a complete stop. It is primarily affected by the original speed of the vehicle and the coefficient of friction between the tires and the road surface, and negligibly by the tires' rolling resistance and vehicle's air drag. The type of brake system in use only affects trucks and large mass vehicles, which cannot supply enough force to match the static frictional force.
The braking distance is one of two principal components of the total stopping distance. The other component is the reaction distance, which is the product of the speed and the perception-reaction time of the driver/rider. A perception-reaction time of 1.5 seconds, and a coefficient of kinetic friction of 0.7 are standard for the purpose of determining a bare baseline for accident reconstruction and judicial notice most people can stop slightly sooner under ideal conditions.
Braking distance is not to be confused with stopping sight distance. The latter is a road alignment visibility standard that provides motorists driving at or below the design speed an assured clear distance ahead (ACDA) which exceeds a safety factor distance that would be required by a slightly or nearly negligent driver to stop under a worst likely case scenario: typically slippery conditions (deceleration 0.35g) and a slow responding driver (2.5 seconds). Because the stopping sight distance far exceeds the actual stopping distance under most conditions, an otherwise capable driver who uses the full stopping sight distance, which results in injury, may be negligent for not stopping sooner.
the drive cycle data and output are attached excle file.
2. Why electric motor can’t develop braking torque at high speed similar to starting? How electric and mechanical brakes are coordinated?
Eectric motor cant develop braking tarque at high speed similar to starting because Braking torque is applied in the opposite direction of the rotation We can use a mechanical brake to produce a braking torqque We con also do it electrically
The term braking comes from the term brake. We know that brake is an equipment to reduce the speed of any moving or rotating equipment, like vehicles, locomotives. The process of applying brakes can be termed as braking. Now coming to the term or question what is braking. First of all we can classify the term braking in two parts
- Mechanical Braking
- Electrical Braking
Mechanical braking is left out here because as it is an electrical engineering site, we should only focus on electrical braking here. In mechanical braking the speed of the machine is reduced solely by mechanical process but electrical braking is far more interesting than that because the whole process is depended on the fiux and torque directions. We will further see through the various types of braking but the main idea behind each type of barking is the reversal of the direction of the flux.
So, we can understand that when it is asked that what is braking? We can say that it is the process of reducing speed of any rotating machine. The application of braking is seen at almost every possible area, be it inside the motor used in factories, industrial areas or be it in locomotives or vehicles. Everywhere the use of mechanical and electrical brakes is inevitable.
Regenerative Braking
Regenerative braking takes place whenever the speed of the motor exceeds the synchronous speed. This baking method is called regenerative baking because here the motor works as generator and supply itself is given power from the load, i.e. motors. The main criteria for regenerative braking is that the rotor has to rotate at a speed higher than synchronous speed, only then the motor will act as a generator and the direction of current flow through the circuit and direction of the torque reverses and braking takes place. The only disadvantage of this type of braking is that the motor has to run at super synchronous speed which may damage the motor mechanically and electrically, but regenerative braking can be done at sub synchronous speed if the variable frequency source is available.
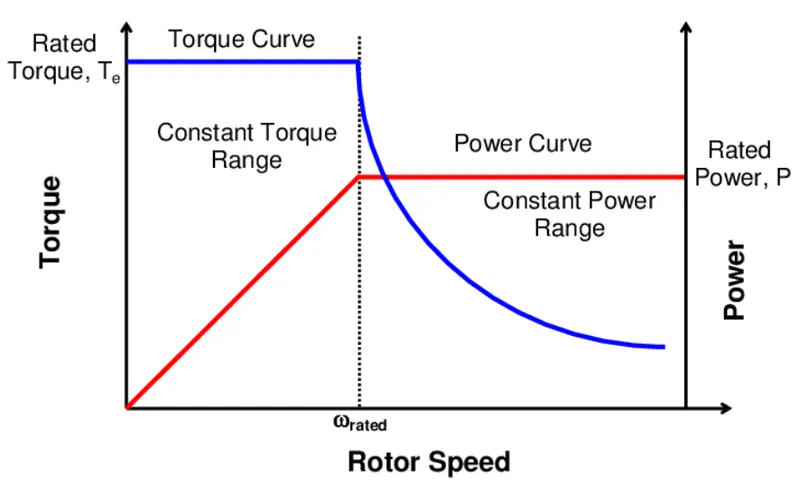
in EVs, only traction motor delivers torque to the driven wheels. Thus the vehicle performance is completely determined by the torque speed or powerspeed characteristic of the traction motor.A vehicle, in order to meet its operational requirement, such as the initial acceleration and grade ability with minimum power mentioned above, operation entirely in constant power is needed. Operation entirely in constant power is, however, not possible for any practical vehicle.It can be observed that the EV motor drive is expected to be capable of offering a high torque at low speed for starting and acceleration, and a high power at high speed for cruising.At the same time, the speed range under constant power is desired as wide as possible. Ideally, eliminating the constant torque region would provide the minimum power rating of the motor, but this is not physically realizable.
Under the normal mode of operation, a typical electric motor drive designed for industrial applications can provide constant rated torque up to its base or rated speed. At this speed, the motor reaches its rated power limit. The operation beyond the base speed up to the maximum speed is limited to this constant power region.The range of the constant power operation depends primarily on the particular motor type and its control strategy.The maximum available torque in the natural mode of operation decreases inversely with the square of the speed. Although the machine torque in the natural mode decreases inversely with the square of the speed, for some extremely high speed motors the natural mode of operation is an appreciable part of its total power-speed profile.Inclusion of this natural mode for such motor drives may result in a reduction of the total power requirement.
How electric and mechanical brakes are coordinated
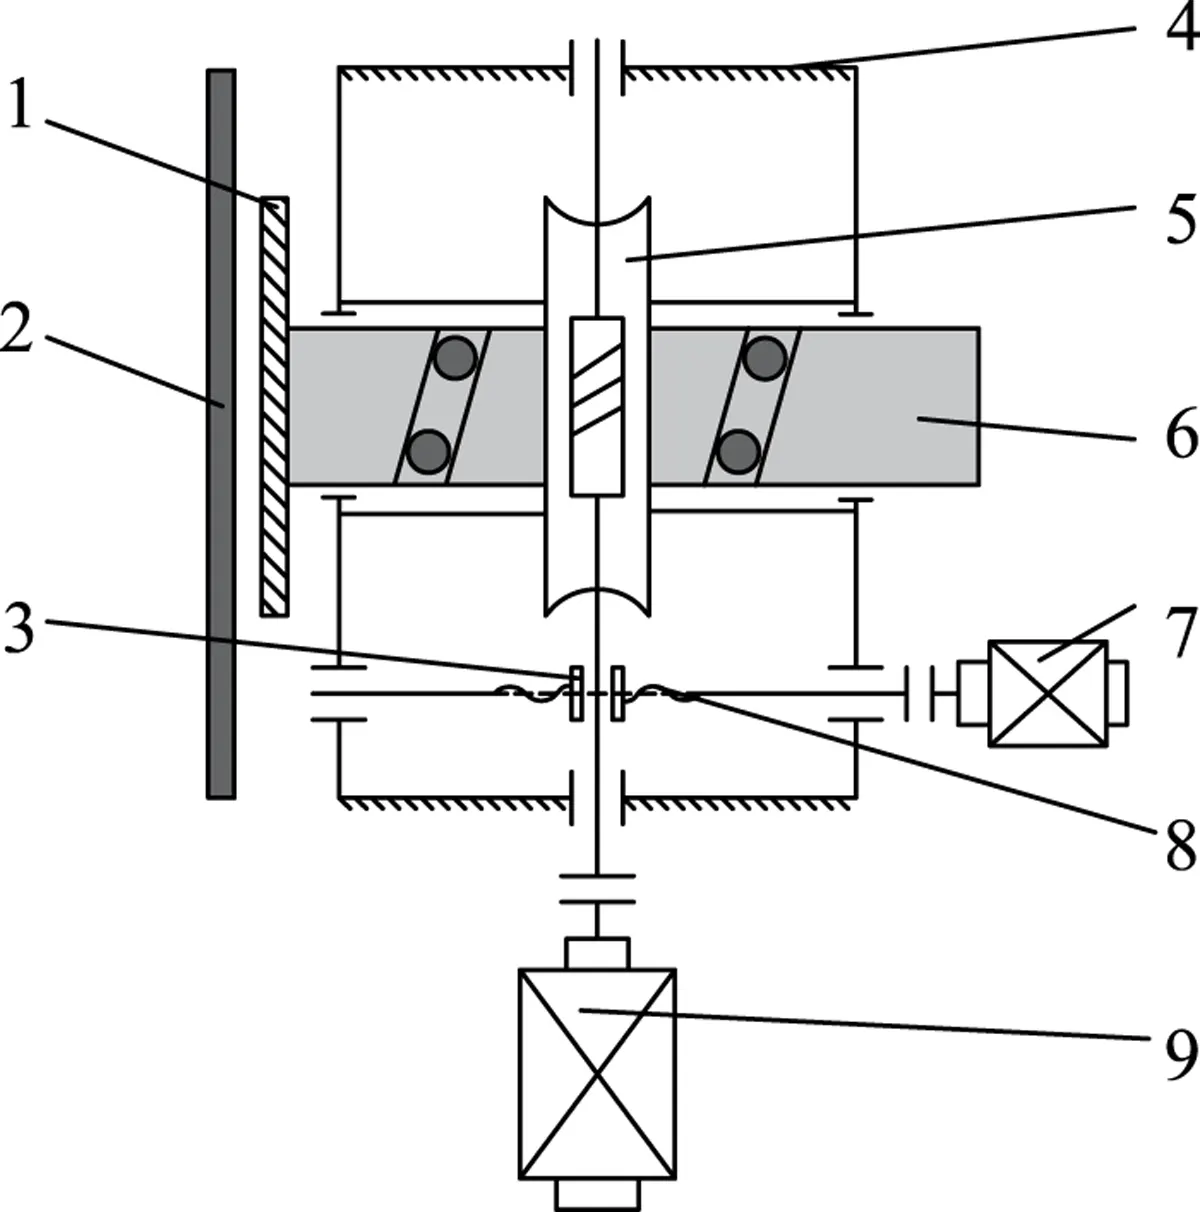
Structure diagram of electromechanical brake. 1. Brake disc; 2. Brake tread; 3. Clamp block; 4. Box; 5. Worm gear; 6. Ball screw pair; 7. Stepper motor; 8. Trapezoidal screw; 9. Torque motor.
The structure of electromechanical brake developed in this paper is shown in and design drawing is shown in Electromechanical brake is mainly composed of an actuator and a parking mechanism. The actuator includes a worm gear mechanism, a ball screw mechanism and a brake tread. Parking mechanism includes a trapezoidal screw, clamping block and linear guide.
The working principle of the brake: after voltage is applied, the torque motor runs to drive the worm gear mechanism to move, realizing the deceleration and increase of force and 90° commutation of the movement. The nut in the turbine and the ball screw mechanism is fixed by a key to realize movement transmission. The movement of the nut makes the screw in the ball screw mechanism push the brake tread to move to compress the brake disc to generate brake pressure. After braking, apply voltage to the parking mechanism, and the stepper motor drives the trapezoidal screw to move, making the two clamping blocks move toward each other along the bottom linear guide to clamp the worm in the actuator.
The working principle diagram of the torque motor is established, According to the working principle of the brake. There are resistance and inductance inside the DC torque motor. The simplified circuit diagram is shown in
The mathematical expression is as follows: (1)
(1)
Among them, U: Armature voltage; Ia: Armature current; Ra: Armature resistance; La: Armature inductance; Ke: Back EMF Coefficient; ωm: Angular speed of motor rotor. The dynamic equation when the rotor is running is: (2)
(2) (3)
(3) (4)
(4)
Among them, Te: Electromagnetic torque; Kr: Torque constant; Jm: Motor moment of inertia; θm: Motor rotation angle; Tf: Motor damping torque; TL: Load torque; Bm: Motor damping. When the motor is locked, the angular velocity is zero. The pressing force of the brake shoe against the brake disc is fN, and the transmission efficiency of the ball screw pair is ηc. Then the relationship between the pressure of the brake disc and the load of the nut push rod is: (5)
(5)
From (1), (2), (3), (4) and (5), we can get: (6)
(6)
Carrying out the Laplace transform of (6) to get: (7)
(7)
The pole of the open-loop transfer function is located in the left half of the complex plane, and PI control is added to the system. The braking force response curve is shown in Braking force reaches the target pressure within 0.2 s and stabilizes at the target pressure, and the steady-state error is zero. The results show that the PI controller can stabilize the positive brake pressure at the target value, providing a theoretical basis for the test.
3.Make a MATLAB program which plots contour of given motor speed, torque and efficiency values. Attach the code as a .m file attach a screenshot of all the plots.
the below program show i can assumedfollowing data
copper loss=0.4
iron loss=0.008
windage=0.000019
clear all
close all
clc
% speed
x = linspace(0,2000);
% torque
y = linspace(0,2000);
% losses
% copper loss
kc= 0.4;
% iron loss
ki= 0.008;
% windage loss
kw= 0.000019;
% meshgrid
[x,y]= meshgrid(x,y);
a=kc.*(y.^2);
b=ki.*x;
c=kw.*(x.^3);
cons=20;
outputpower = x.*y;
inputpower=a+b+c+outputpower+cons;
effiency= outputpower./inputpower;
n= linspace(0.7,0.95,10);
contour(x,y,effiency,n);
box off
grid off
colorbar
xlabel('speed in RPM')
ylabel('torque in N/m')
hold on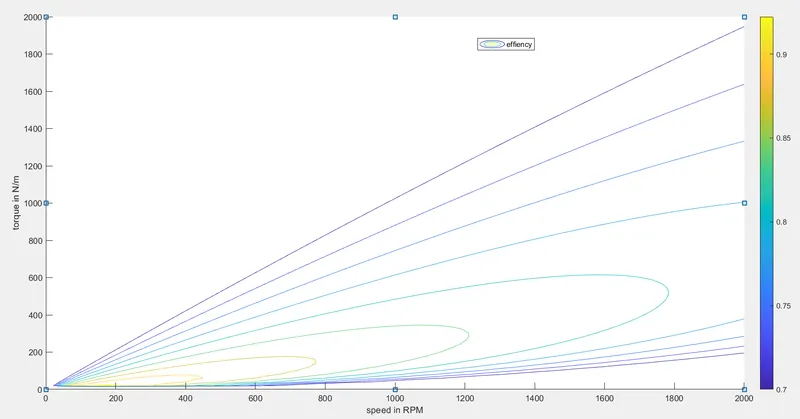
the above fig show the output graph.
as per output graph we can understand inside the circle effiency will decreses and outside the circle effiency increses.