Week-4 Challenge WOT Condition Part-2
1. difference between mapped and dynamic model of engine, motor and generator.
mapped model:
This type of model used for study state model of engine, motor and generator characterizes. in this model we know that above given compounts and that characterizes can we will put in lookup tables. and that table gives the complete performance of motor,engine and generator. this type of model we can used when we having experimental values or data for given equpement then we can uesd mapped model.
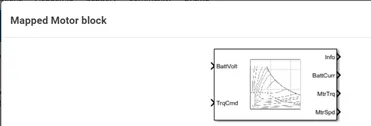
above fig show the mapped model.
dynamic model:
This model itself suggest the name itself it means this this type of model dynamic and it having closed loop system. in this type of model depending on output of the simulation. and also we can till we get requied output till that time we can simulate the model.
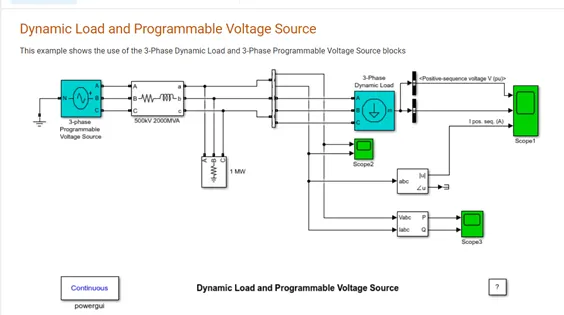
change model type go to the electric or engine plant.go to the parameter of given compount right click and go to the variant and choose the mode to be active.
2.we observe that distance travelled is calculated by integrating the vehlcle speed. To convert the unit from m to Km and then further to miles, rest of the constonts are multiplled or devided. For a hybrid electric vehicle, Fuel consumed is calculated using Fuel volume flow ond battery power used. To convert latter KW to gal/hr, Value is devided by 33.7, and later is converted to m^3/s. Integrating this glves the Volume in m^3 which can further be converted to gallons, In casee of fuel, direct integration of fluid volume flow glves the volume of fuel used.
Factors considered to model fuel flow are Battery power and Vehicle speed.
3.Run the HEV ReferenceApplication with WOT drive cycle. Change the grade and wind velocity in the environment block. Comment on the results
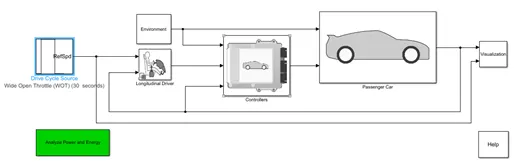
the above fig show the HEV system. it consist of drive cycle of WOT drive cycle.
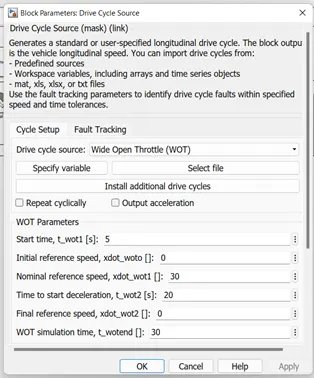
the fig show the wide open throttel drive cycle.
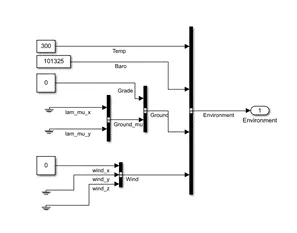
case-1
Change the grade and wind velocity in the environment block. i considered grade=0 and wind velocity =0 in the environment block.
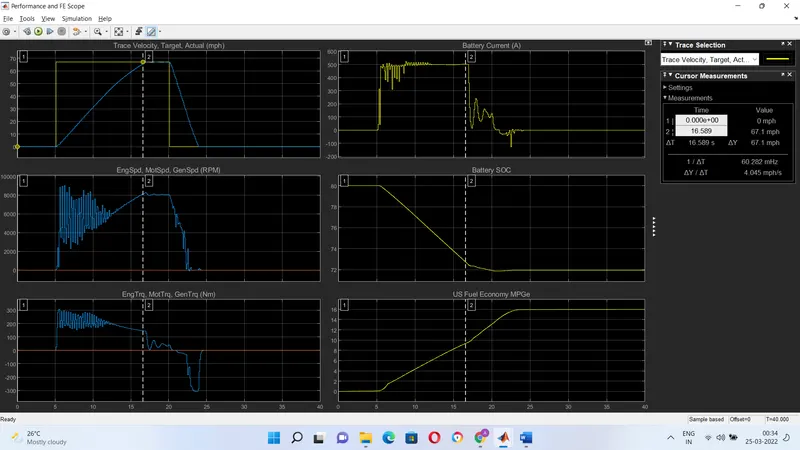
the above fig show the acceleration time
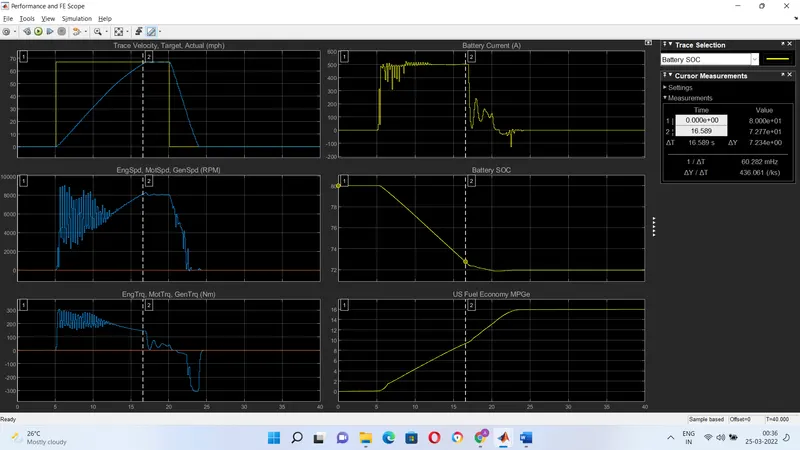
the above fig show battery charege
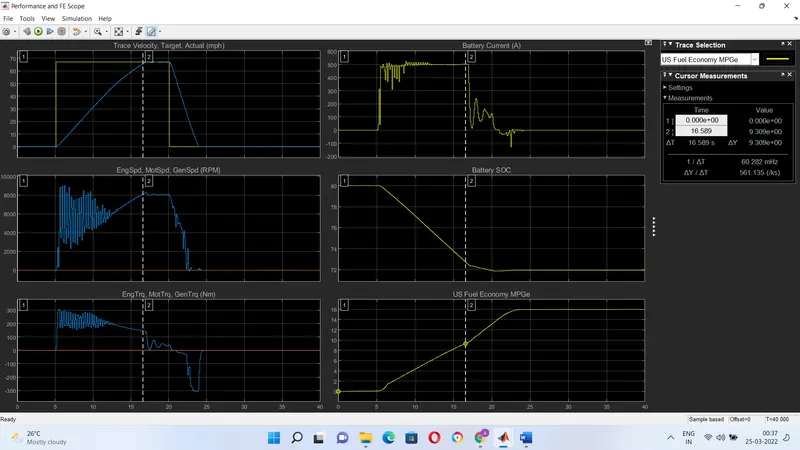
the above fig show the fule avg
case -2
Change the grade and wind velocity in the environment block. i considered grade=10 and wind velocity =0 in the environment block.
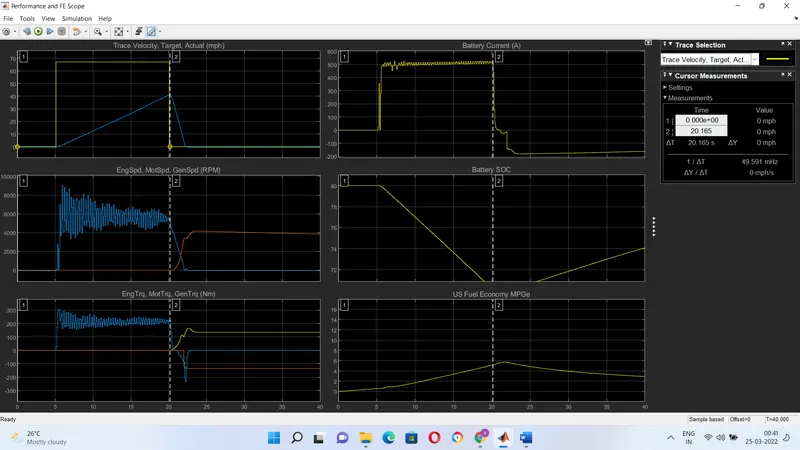
the above fig show the acceleration time
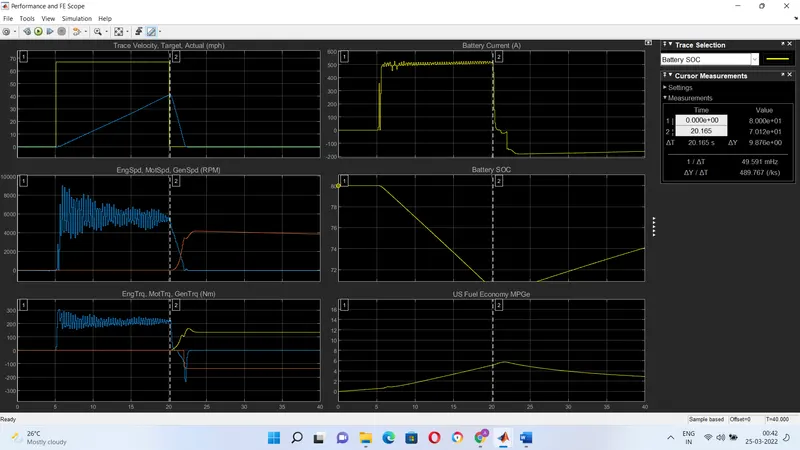
the above fig show battery charege
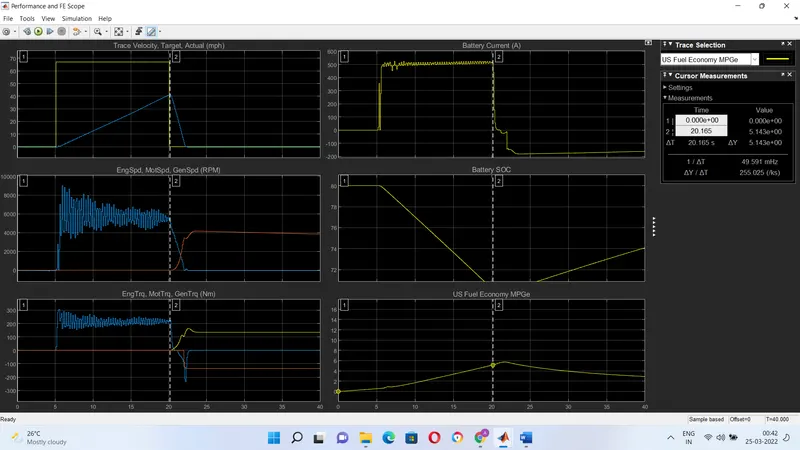
the above fig show the fule avg
if grade and wind velocity in the environment block changed the acceleration time and fule economy decreses and battery soc remains same.
4.hybrid and pure electric powertrains
case-1
Change the grade and wind velocity in the environment block. i considered grade=0 and wind velocity =0 in the environment block.
the above fig show the acceleration time
the above fig show battery charege
the above fig show the fule avg
case-2 pure electric powertrains
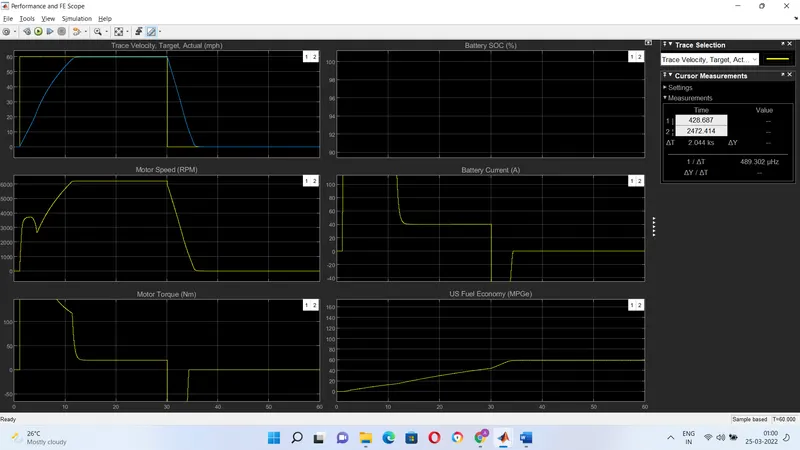
THE ABOVE FIG SHOWES acceleration time EV
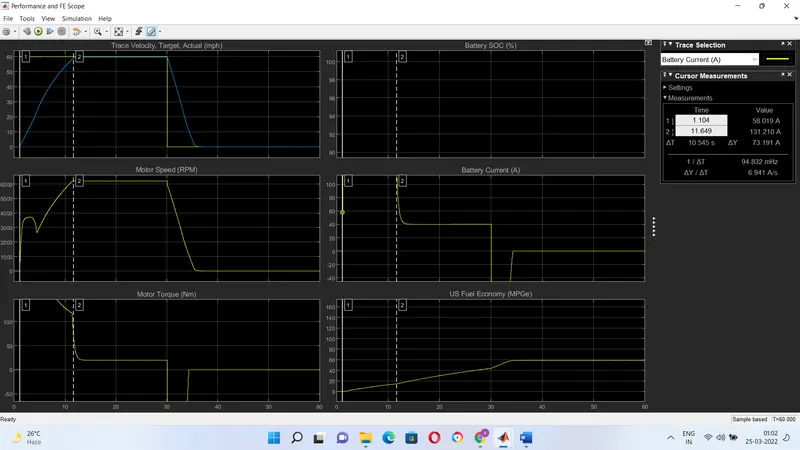
the above fig show battery charege
the above fig show the fule avg
COMPARING WITH TO OF THE
1. FOR BETTER ECONOMY EV CAN BE UESD AND TOP SPEED AND LESS ACCLERETION TIME IN HEV.