Week-11 Challenge: Braking
1) For a defined driving cycle, calculate the energy required for braking.
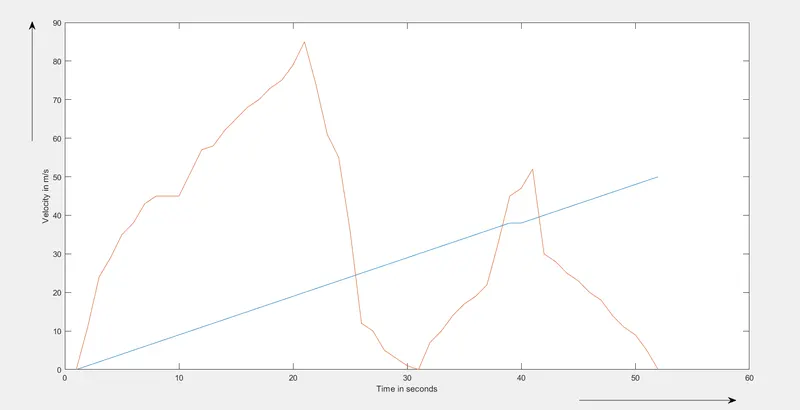
A drive cycle is plot having time in x-axis and velocity in y-axis. A typical drive cycle table is shown below :
| Time (s) | Velocity (m/s) |
| 0 | 0 |
| 1 | 11 |
| 2 | 24 |
| 3 | 29 |
| 4 | 35 |
| 5 | 38 |
| 6 | 43 |
| 7 | 45 |
| 8 | 45 |
| 9 | 45 |
| 10 | 51 |
| 11 | 57 |
| 12 | 58 |
| 13 | 62 |
| 14 | 65 |
| 15 | 68 |
| 16 | 70 |
| 17 | 73 |
| 18 | 75 |
| 19 | 79 |
| 20 | 85 |
| 21 | 74 |
| 22 | 61 |
| 23 | 55 |
| 24 | 36 |
| 25 | 12 |
| 26 | 10 |
| 27 | 5 |
| 28 | 3 |
| 29 | 1 |
| 30 | 0 |
| 31 | 7 |
| 32 | 10 |
| 33 | 14 |
| 34 | 17 |
| 35 | 19 |
| 36 | 22 |
| 37 | 33 |
| 38 | 45 |
| 38 | 47 |
| 39 | 52 |
| 40 | 30 |
| 41 | 28 |
| 42 | 25 |
| 43 | 23 |
| 44 | 20 |
| 45 | 18 |
| 46 | 14 |
| 47 | 11 |
| 48 | 9 |
| 49 | 5 |
| 50 | 0 |
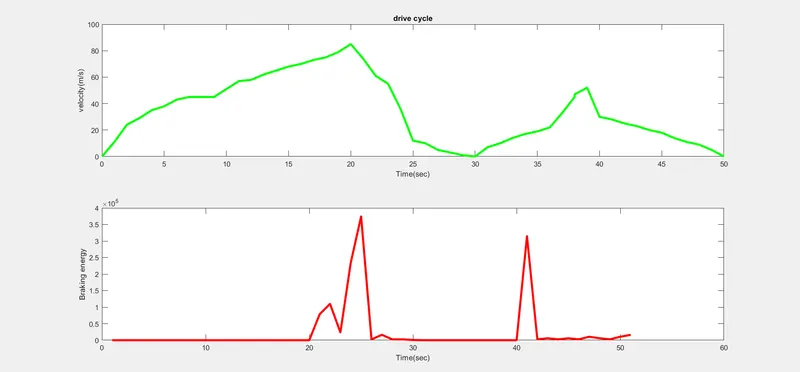
From the above drive cycle table a graph is plotteed between the time and velocity.
Output plot: Drive Cycle
Let the gross vehicle weight be 1300kg
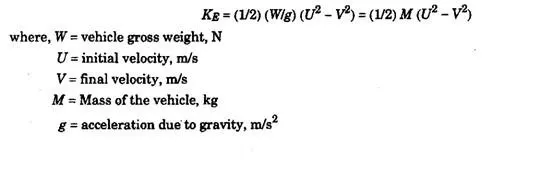
The kinetic energy of a vehicle during the braking;
Import the Excel file 'drivecycle.xlsx' into the workspace.
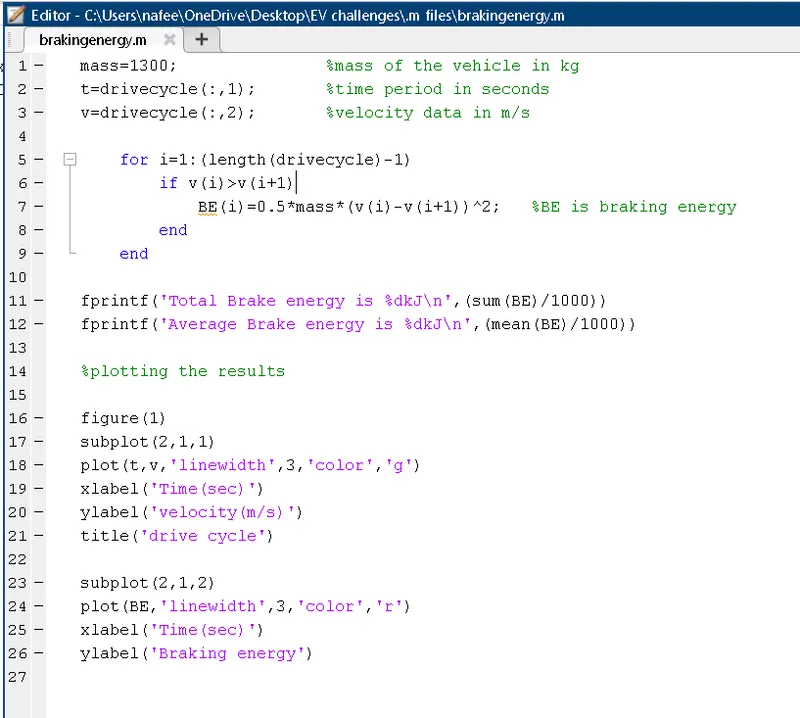
The matlab script for finding the Total braking Energy required:
mass=1300; %mass of the vehicle in kg
t=drivecycle(:,1); %time period in seconds
v=drivecycle(:,2); %velocity data in m/s
for i=1:(length(drivecycle)-1)
if v(i)>v(i+1)
BE(i)=0.5*mass*(v(i)-v(i+1))^2; %BE is braking energy
end
end
fprintf('Total Brake energy is %dkJ\n',(sum(BE)/1000))
fprintf('Average Brake energy is %dkJ\n',(mean(BE)/1000))
%plotting the results
figure(1)
subplot(2,1,1)
plot(t,v,'linewidth',3,'color','g')
xlabel('Time(sec)')
ylabel('velocity(m/s)')
title('drive cycle')
subplot(2,1,2)
plot(BE,'linewidth',3,'color','r')
xlabel('Time(sec)')
ylabel('Braking energy')
Matlab script in editor :
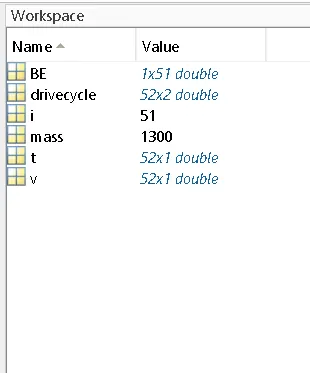
Workspace values:
Output plot: drive cycle and Braking energy vs Time
The Result:
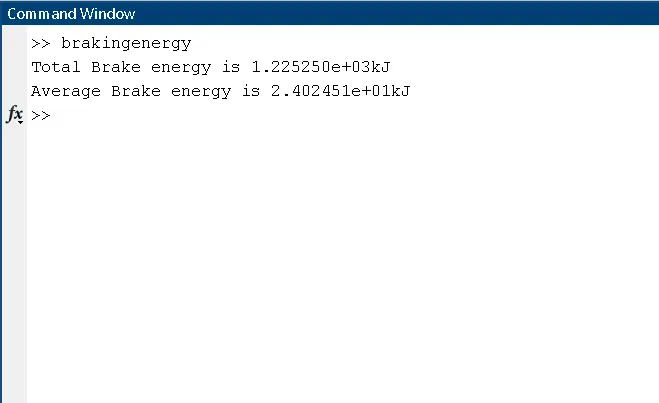
Thus the Total Energy required for braking = `1.2252*10^3 kJ`
2) Why electric motor can’t develop braking torque at high speed similar to starting? How electric and mechanical brakes are coordinated?
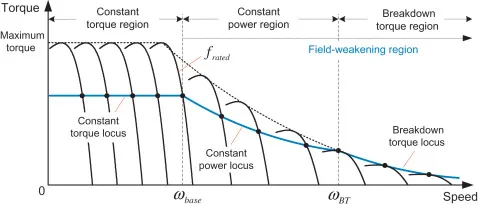
The electric motors cant develop braking torque at high speed similar to that of starting because at starting period the vehicle speed is low so the torque is very high and when at high speeds the torque must be low as compared to low speeds.So due to the reduction of torque braking torque also reduces .
- That is in the constant torque region the torques are high and constant
- In the constant power region the torque exponentially decreases
- In the breakdown region the torque is very low but the speed increases
The vehicles Speed vs Torque characteristics is shown below:
Electric and Mechanical brake cordination:
There are two different control strategies for braking :
- series braking
In this braking strategy brakes are applied one after another so that they are in series.Either mechanical brake or regenerative braking is applied at a time.
- parallel braking
In this braking strategy both brakes are simultaneously applied.They are in parallel .Brakes are applied together at a time.
| Sr. No. | Mechanical Braking | Electrical Braking |
|---|---|---|
| 1. |
Mechanical braking produces excessive wear and tear of brake block shoes of brake lining. Therefore, frquent replacement is necessary. |
No such need |
| 2. |
Due to constant wear and tear of brake lining frquent adjustments are necessary to compensate the offset error, therefore maintanace is costly |
Less maintanace |
| 3. | Produce metal dust causing wearing of bearings. | No such a dust is formed |
| 4. |
If they are not correctly adjusted the sudden braking action produce shock, this result in discomfort to passengers |
Adjustment is easy and braking action is gradual and smooth. |
| 5. |
Heat is produce in brake shoes of brake lining, which may damage the lining and may result in failure of braking system. |
Heat is produce at a convenient place which is no way harmful to braking system. |
| 6. | No such possibility |
60 to 80 % kinetic energy of apparatus can be fedback to line in regenerative brake. |
| 7. | Mechanical braking alone can be used |
Electrical braking is alone not sufficient, it is to be supplement by mechanical braking. |
| 8. | Low cost | High initial cost |
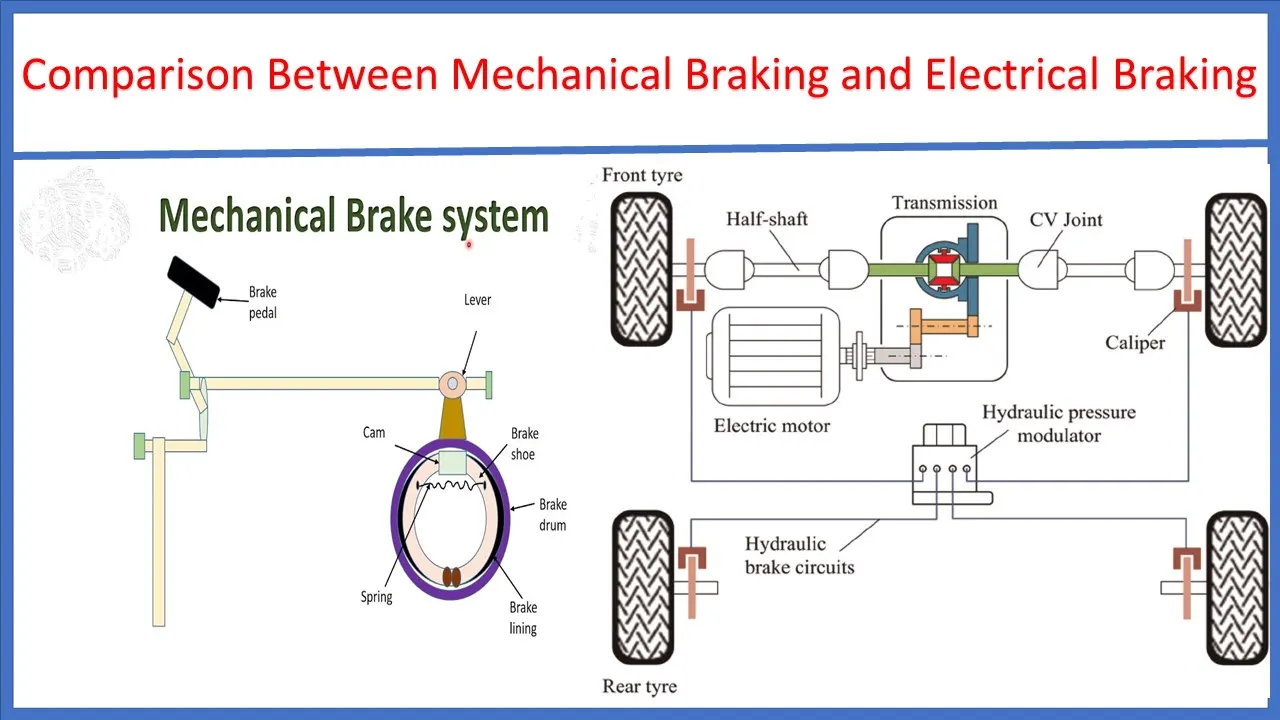
Electric Driven Intelligent Brake System By Nissan
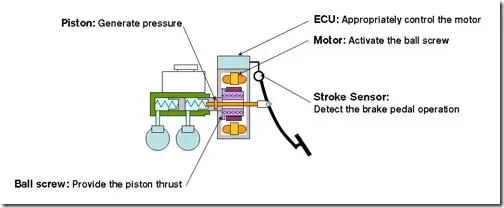
In the Electric Driven Intelligent Braking System, the braking force is provided with the help of a ECU controlled motor and ball screw arrangement. This means that no direct load on the engine while applying brakes. This means that a motor operated the brake for providing the braking energy. A more controlled and uniform braking force is applied since its ECU controlled, this helps to recover braking losses when a regenerative braking system is used.
The Electric Driven Intelligent Brake, another world’s first system, utilizes the vehicle’s electric motor to directly operate the brake cylinders. When the driver steps on the brake pedal, the necessary braking force is maintained while the hydraulic pressure of the friction brake is controlled to help maximize the energy regeneration of the hybrid motor. Because of its simple structure, in which the motor directly operates the brake cylinders, this new Electric Driven Intelligent Brake system has the potential to be applied to various future hybrid vehicles.
3) Make a MATLAB program which plots contour of given motor speed, torque and efficiency values. Attach the code as a .m file attach a screenshot of all the plots.
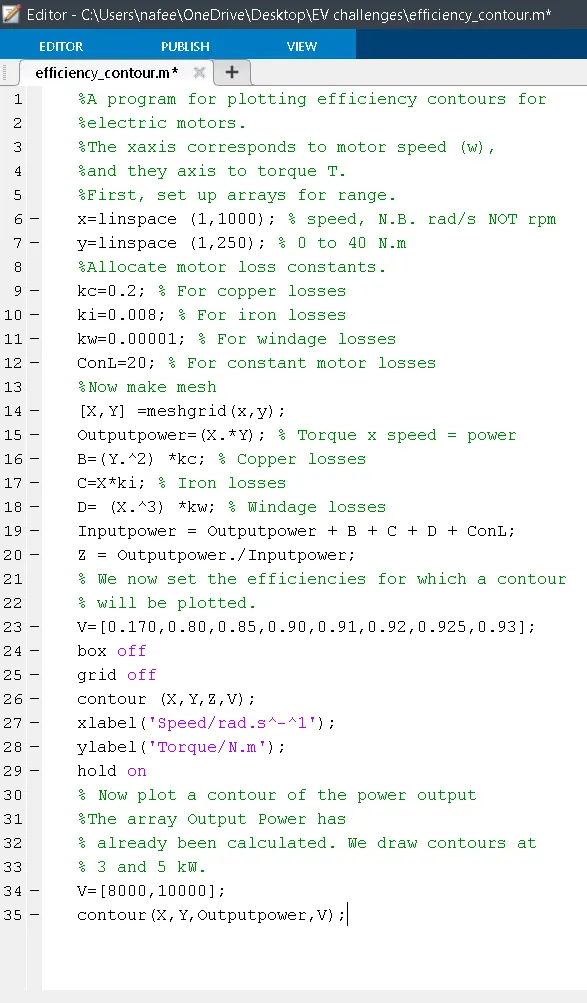
Matlab script for plotting efficiency contour:
%A program for plotting efficiency contours for
%electric motors.
%The xaxis corresponds to motor speed (w),
%and they axis to torque T.
%First, set up arrays for range.
x=linspace (1,1000); % speed, N.B. rad/s NOT rpm
y=linspace (1,250); % 0 to 40 N.m
%Allocate motor loss constants.
kc=0.2; % For copper losses
ki=0.008; % For iron losses
kw=0.00001; % For windage losses
ConL=20; % For constant motor losses
%Now make mesh
[X,Y] =meshgrid(x,y);
Outputpower=(X.*Y); % Torque x speed = power
B=(Y.^2) *kc; % Copper losses
C=X*ki; % Iron losses
D= (X.^3) *kw; % Windage losses
Inputpower = Outputpower + B + C + D + ConL;
Z = Outputpower./Inputpower;
% We now set the efficiencies for which a contour
% will be plotted.
V=[0.170,0.80,0.85,0.90,0.91,0.92,0.925,0.93];
box off
grid off
contour (X,Y,Z,V);
xlabel('Speed/rad.s^-^1');
ylabel('Torque/N.m');
hold on
% Now plot a contour of the power output
%The array Output Power has
% already been calculated. We draw contours at
% 3 and 5 kW.
V=[8000,10000];
contour(X,Y,Outputpower,V);
Script in Matlab workspace:
Efficiency contour:
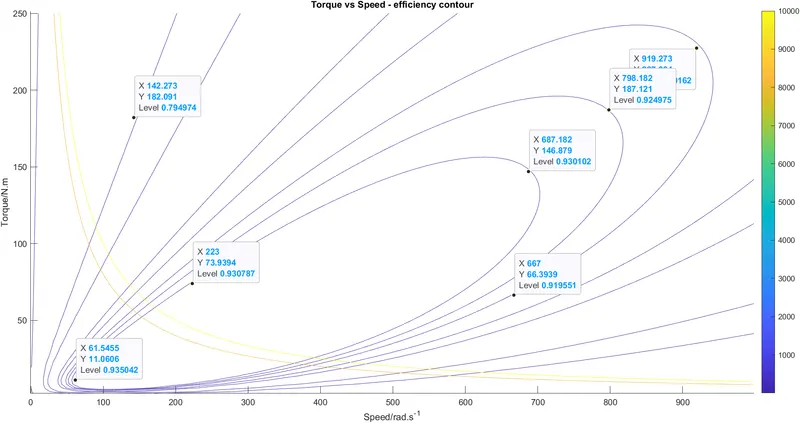
All the motor loss constants including the copper loss,iron loss,windage loss and constant motor losses are entered.The efficiency is calculated using output power/input power.
The power output contour is also included.
As we can see from the contour it is clear that the efficiency increases inwards of the contour.The highest efficiency is 93.50% at 61.54rad/s speed and 11.06 Nm Torque.
------------------------------------------------------------------------------------------------------------------------------------------------------------------------------------------------------------------------------------------