Week-11 Challenge: Braking
ANSWER (WEEK 11).
- For a defined driving cycle, calculate the energy required for braking.
- Why electric motor can’t develop braking torque at high speed similar to starting? How electric and mechanical brakes are coordinated?
- Make a MATLAB program which plots contour of given motor speed, torque and efficiency values. Attach the code as a .m file attach a screenshot of all the plots.
AIM:-
QUESTION 1
- For a defined driving cycle, calculate the energy required for braking.
ANSWER:-
A driving cycle is a series of data points representing the speed of a vehicle versus time.Driving cycles are produced by different countries and organizations to assess the performance of vehicles in various ways, for instance, fuel consumption, electric vehicle autonomy and polluting emissions.
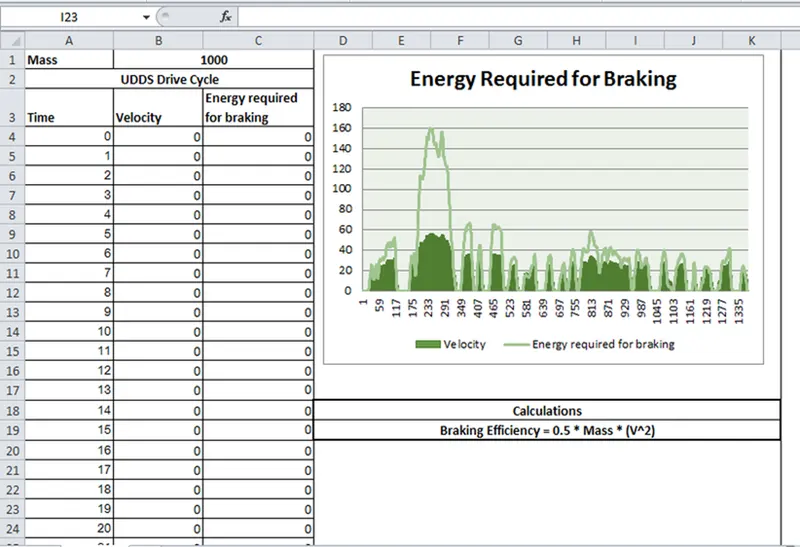
calculate the energy required for braking
we have been able to use the energy which is been disappeared at the point of braking. The kinetic energy which helps the vehicle to run also gets wasted while the braking is done. Though it depends on various parameters on how effective the braking would be it can be depended upon.
- Number of Brake Pistons
- Duration and Degree of Brake Pedal been Pressed
- Road Condition
- Temperature
- Brake Pad and Disc Condition
- Mass of the Vehicle
Still with a basic operation where the vehicle is in motion and the brakes are applied the same efficiency could be calculated by the given equations.
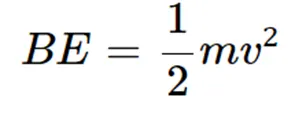
where,
BE=braking energy
m=mass of the vehicle
v = velocity
In this manner, the same calculation is carried out for calculating the brake efficiency required at the peak point. It is a drive cycle with speed variations the braking power required would vary but still, the highest braking power required is mentioned below.
QUESTION 2
2.Why electric motor can’t develop braking torque at a high speed similar to starting? How electric and mechanical brakes are coordinated?
- the electric motor cannot develop the braking torque at high speed. because the speed of the motor keeps on increases up to maximum torque and then reduces to the constant speed which is the breakdown torqueor peak torque
- in the motor starting region ,the torque become maximum at a small time to attain the better speed of the motor
- when the motor reaches the breakdown torque and the speed keeps on increasing then the torque is going to reduces to maintain the spped constant.
- In the electric motor, the braking torque cannot be developed at high speed because of losses parameter,and kinetic energy which has to become zero and the forces act on the vehicle so, the braking torque is developedat low speed in electric motor.
How electric and mechanical brakes are coordinated?
In Mechanical braking which we usually see and experience in all vehicles, the brake pedal in the vehicle cabin helps us to engage or disengage the brakes. Currently, braking technology has done wonders by inventing life-saving braking technologies such as ABS, EBD, BA and many others. All these technologies play a vital role in stopping the vehicle and coming back to rest at a high speed. In all these vehicles when the driver applies the brakes the brake pads
come closer to the disc connected with the driving disc. The brake pads usually help inefficient braking.
There are two generic methods by which the vehicle could be braked in the ELECTRIC BRAKES.
1.Series - The Regenerative Braking of the Mechanical Braking are applied one after another.
2.Parallel - The Regenerative Braking or the Mechanical Braking both are applied Parallely.
When the brake pedal is pressed the hydraulic fluid reaches the brake piston and created the braking pressure on the wheels and the same kinetic energy is been used by the Regenerative Braking for generating more power using the Bi-directional motor which operates as a
generator while braking An example of the proposition of Regenerative Braking and the Mechanical Braking
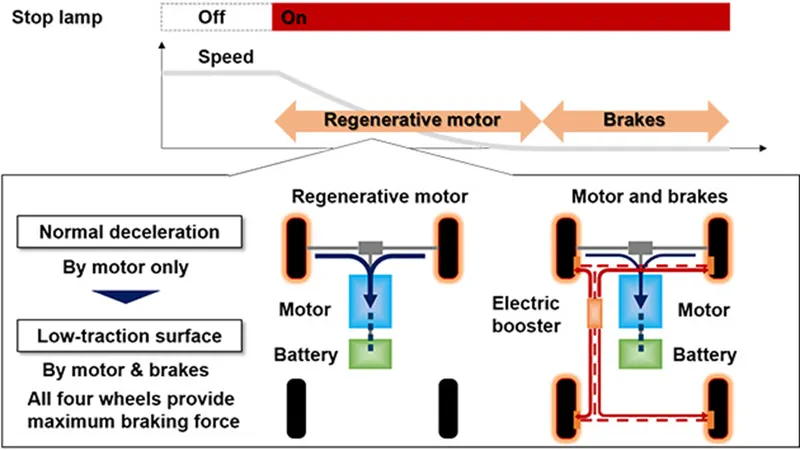
NISSAN LEAF EDIB (ELECTRONIC-DRIVEN INTELLIGENT BRAKING)
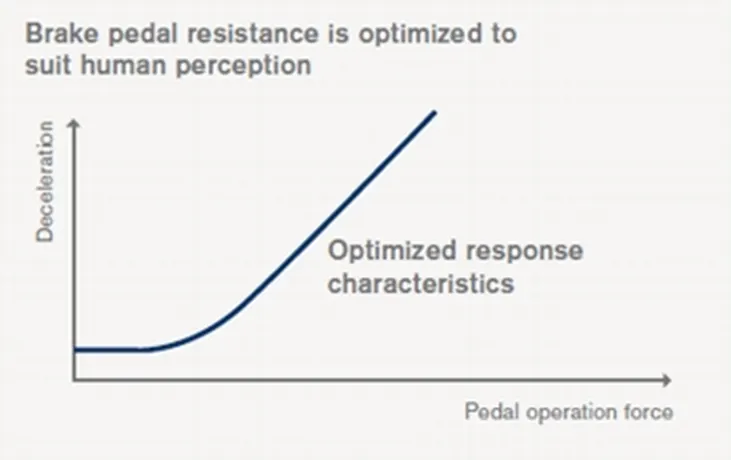
EDIB (Electric Driven Intelligent Brake) controls the regenerative brake and friction brake to support both of these requirements. Further, it also controls the reactive force from the pedal in order to unify the feeling when stepping down on the pedal and the sense of deceleration.
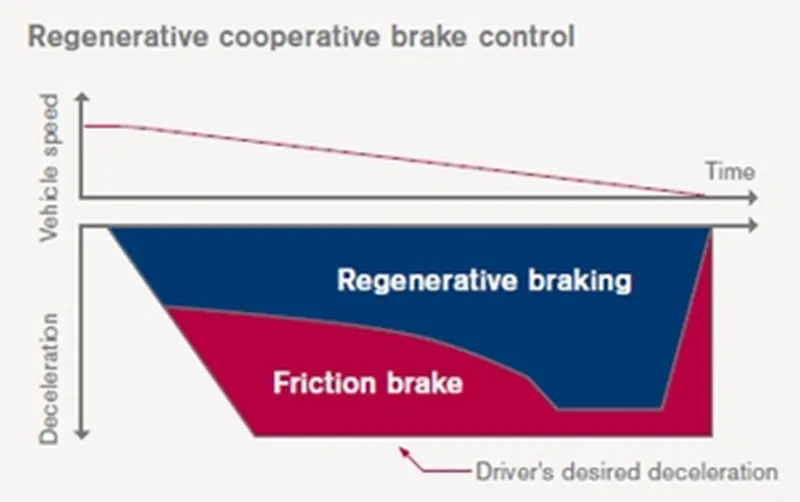
from the above graph we notice that when the regenerative braking is less the friction braking applied is more by the driver and vice versa.
QUESTION 3
3.Make a MATLAB program that plots the contour of given motor speed, torque and efficiency values. Attach the code as a .m file attach a screenshot of all the plots.
Answer:-
a MATLAB program that plots the contour of given motor speed, torque and efficiency values.
Explanation:
In this program, we are plotting speed Vs torque characteristics with the efficiency values. For this, first, we are defining the speed and torque values of the motor.
Then as we need to draw a contour, we convert this ID array to a 2D array using the "MESH GRID" command.
Then we are defining the Cu constants for losses, like Cu loss constants, iron loss constant and windage loss constant.
we had defined the efficiency value
Pi=Pout+KcT^2+Ki*w+Kw*^3+Const
various command is used to modified the graph such as , contourf through which colour is displayed in graph another is SHOWTEXT ON which means valued is displayed at various point.
legend is there for notify parameter what is means but we did not used it because of contour graph
Using this formula, we calculate the efficiency and then plot the contour.
%A MATLAB PROGRAMM FOR PLOTTING CONTOUR PLOT OF MOTOR SPEED
clear all
close all
clc
%SPEED_ARRAY
w=linspace(1,1000);
%TORQUE_ARRAY
T=linspace(1,500);
%LOSS_COEFFICIENTS
ki=0.001;%IRON LOSSES
kw=0.0001;%WiNDAGE LOSSES.
kc=0.1;
%MESHGRID
[X,Y]=meshgrid(w,T);
copper_loss=(Y^2).*kc;
iron_loss=X*ki;
windage_loss=(X.^3)*kw;
cons=20;
total_loss=(copper_loss+windage_loss+iron_loss)+cons
output=T.*w;
input_power=(total_loss+output);
Eff=(output)./(input_power);
n=[0.70,0.75,0.80,0.85,0.90,0.91,0.92,0.93,0.94,0.95];
box off
grid off
contourf(X,Y,Eff,'showtext','on');
title('SPEED TORQUE CHARACTERISTICS');
xlabel('SPEED RAD/s');
ylabel('TORQUE N/m');
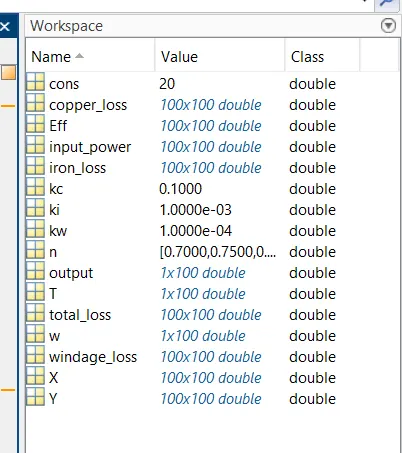
workspace:- all value assigned is shown here in workspace .
Result:-
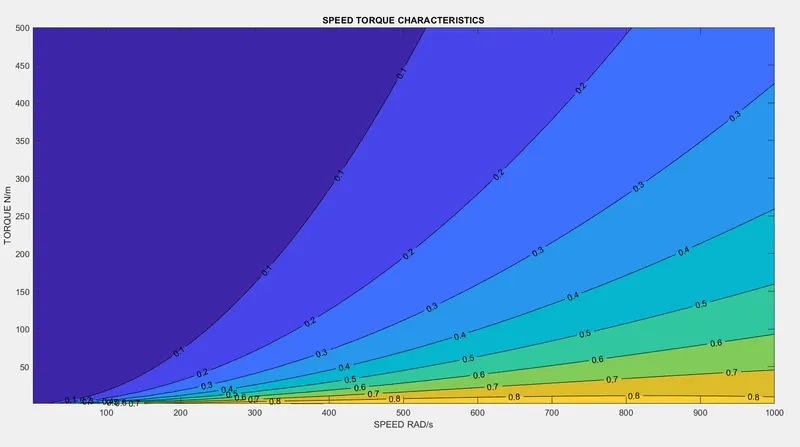
by changing the ki kw kc value we changed the graph also by changing torque-speed efficiency we can change the graph.
on e of the plot is shown above.
the n value is shown in above fig.