Week-11 Challenge: Braking
AIM:
- For a defined driving cycle, calculate the energy required for braking.
- Why electric motor can’t develop braking torque at high speed similar to starting? How electric and mechanical brakes are coordinated?
- Make a MATLAB program which plots contour of given motor speed, torque and efficiency values. Attach the code as a .m file attach a screenshot of all the plots
STUDY 1:
For a defined driving cycle, calculate the energy required for braking.
THEORY:
The braking performance is one of the most important concerns in vehicle safety. In urban area driving, a significant amount of energy is consumed in braking. Electrification of vehicle makes it feasible to recover some of the energy lost in braking. A hybrid braking system was developed to ensure the efficient braking of vehicle and recovering the braking energy. The design and control objectives of such hybrid braking system is to ensure sufficient braking force to quickly reduce the vehicle speed, properly distributing the brake force to front and rear axle, and also to recover as much braking energy as possible. So understanding of braking energy of a driving cycle is important.
GOVERNING EQUATION:
Braking Energy = `1/2 mv^2 kWh`
Where,
m - Mass of vehicle (kg)
v - Velocity of vehicle (m/s)
CODE:
clc
clear all
close all
%Program to find the Braking energy for the drive cycle

drive_cycle=xlsread('drive cycle'); %Loading the drive cycle
speed=drive_cycle(:,2);             %Speed values extracted
time=drive_cycle(:,1);              %Time values extracted
vf=[];                              %Final speed array
vi=[];                              %Initial speed array
m=600;                              %Mass of vehicle
%For loop for picking the initial and final speed of deceleration
for i=1:(length(speed)-1)
    if speed(i)>speed(i+1)&&speed(i+2)<speed(i+1)&&speed(i-1)<speed(i)
       vi=[vi,speed(i)];
    elseif speed(i)<speed(i+1)&&speed(i+2)>speed(i+1)&&speed(i-1)>speed(i)
       vf=[vf,speed(i)];
    end
end
vf=[vf,0]; %Adding zero to the last value of Final speed
B=(0.5.*m.*(vi-vf).^2)/1000; %Calculating the Braking energy for each step down
x=sprintf('Total Braking Energy = %0.2fkWh',sum(B)); %Formating the data into string.
disp(x) %Displaying the total braking energy

%Plotting drive cycle
plot(time,speed,'linewidth',2)
title('DRIVE CYCLE')
xlabel('TIME')
ylabel('SPEED')
grid on
Explaining the code:
- Line 6: Loading the drive cycle.
- Line 7-8: Extracting the speed and time values.
- Line 9-10: Initializing the initial and final speed as an array.
- Line 11: Mass of the vehicle.
- Line 13: For loop to get the initial and final speed of deceleration.
- Line 14-18: If and elseif condition to compare the values and identify if it’s decelerating or not and storing it in variable vi (initial speed) and vf (final speed).
- Line 20: Adding zero to the final speed array, since in every drive cycle the value of final speed will be zero (vehicle goes to rest).
- Line 21: Calculating the braking energy.
- Line 22: spritnf command to formatting the data into string for display. Sum(B) add all the elements inside the variable B.
- Line 23: Displaying the string.
- Line 26-30: Plotting the drive cycle. Labelling the plot with title, xlabel and ylabel.
RESULT:
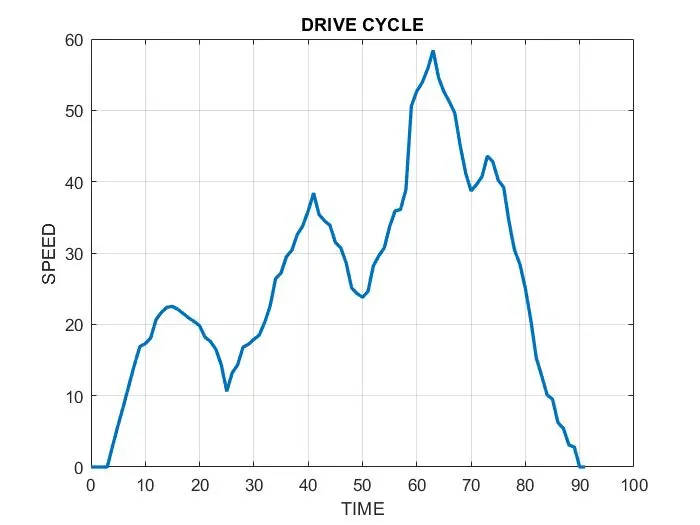
FIG: Drive Cycle

FIG: Displaying the total braking energy
Verifying with excel calculation:
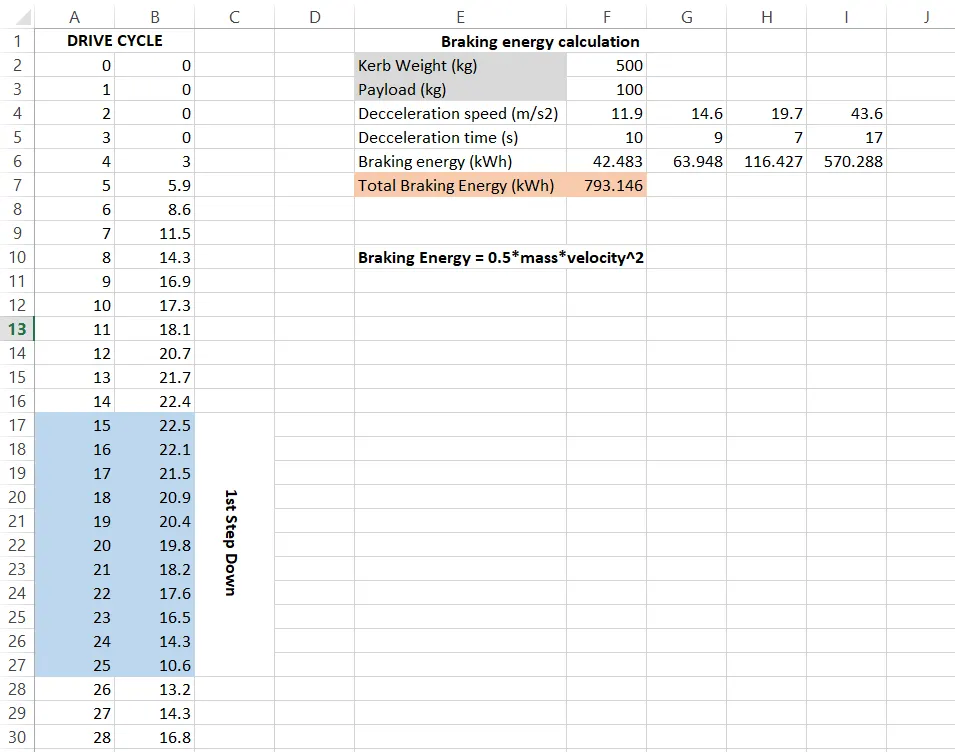
In both calculation we get same total braking energy.
STUDY 2:
Why electric motor can’t develop braking torque at high speed similar to starting?
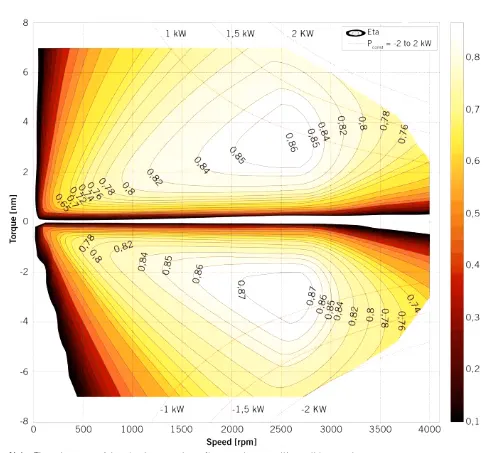
FIG: Torque Speed Characteristics
The figure represents forward motoring (positive torque and speed) and forward braking (negative torque and positive speed).
We know that torque of the induction motor is in inverse proportional to the square of the rotor speed. So at higher speed the torque will be less. That’s why at high speed electric motor cannot produce braking torque similar to starting.
How electric and mechanical brakes are coordinated?
The electric motor must be controlled to produce the proper amount of braking force to recover as much braking energy as possible and at the same time, the total braking force must be sufficient to meet vehicle deceleration commanded by the driver. For meeting the sufficient braking in EV vehicle we use brake control strategies.
Series brake control: Here mechanical brake and electrical brake is done one after another.
Parallel brake control: Here both brakes are applied simultaneously.
We need both mechanical and electrical braking system. In emergency braking or parking brake we needed mechanical braking.
Mechanical brake: It is nothing but friction brakes used in vehicle to slow down the vehicle. The most common type of brakes are drum brake and disc brake.
Electrical braking: It is used to reduce the speed of the motor depending upon the flux and torque. This kind of braking can be done in different methods.
- Plugging type braking
- Dynamic braking
- Regenerative braking
STUDY 3:
Make a MATLAB program which plots contour of given motor speed, torque and efficiency values.
GOVERNING EQUATION:
Power= Speed*Torque
Copper loss,`cu=k_c*T^2`
Iron loss,`I= k_i* ω`
Windage loss,`W= k_w*ω^3`
Constant loss, C
Where,
ω – Speed (rad/s)
T – Toque (Nm)
`k_c`- Constant for copper loss
`k_i`- Constant for iron loss
`k_w`- Constant for windage loss
CODE:
clc
clear all
close all
%Program for efficiency contour plot
s=linspace(0,1300); %Motor Speed(rad/sec)
t=linspace(0,250);  %Torque(Nm)

kc=0.3;      %Copper loss constant
ki=0.08;     %Iron loss constant
kw=0.0001;   %Windage loss constant
c=5;         %Constant

[x,y]=meshgrid(s,t);
output_power= (x.*y);    %Power = speed * torque
cu=kc.*(y.^2);           %Copper loss= kc*torque^2
I=ki.*x;                 %Iron loss= speed*ki
w=kw.*(x.^3);            %Windage loss= kw*speed^3

input_power=output_power+cu+I+w+c; %Input power= Output power+Losses

z=output_power./input_power; %Efficiency

%Mapping of efficiency point
v=[0.70,0.75,0.80,0.84,0.90,0.95];
contour(x,y,z,v)
grid on;
title('EFFICIENCY CONTOUR PLOT')
xlabel('SPEED (rad/s)');
ylabel('TORQUE (Nm)');
Explaining the code:
- Line 5: Motor speed array.
- Line 6: Array of torque values.
- Line 8-11: Initializing the constant of all losses. (kc, ki, kw and c).
- Line 13: Generating mesh grid.
- Line 14: Calculating output power.
- Line 15: Calculating copper loss.
- Line 16: Calculating iron loss.
- Line17: Calculating windage loss.
- Line 19: Calculating input power.
- Line 21: Calculating the efficiency.
- Line 24: Values for mapping the efficiency point.
- Line 25: Command for contour plotting.
- Line 26-29: Labelling command for the plot.
RESULT:
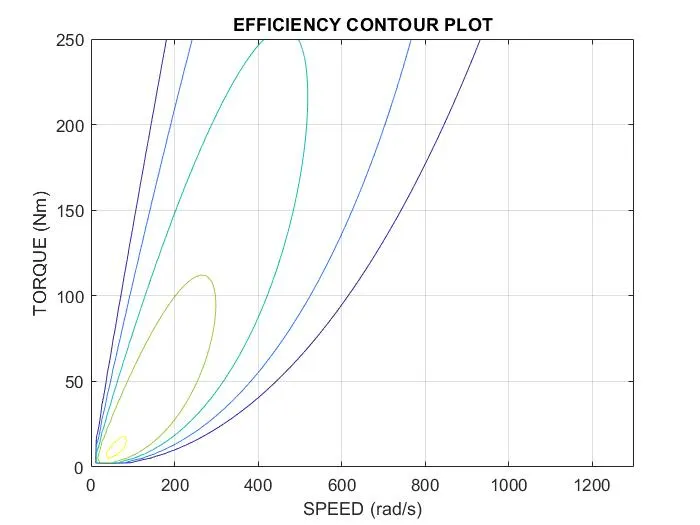
Here the contours represents the group of efficiencies at certain characteristics of motor. The inner contour is having the highest efficiency.