Project 1 - Parsing NASA thermodynamic data
AIM:
Write a program to read the file NASA thermodynamic data.
OBJECTIVE:
- Write a function that extracts the 14 co-efficients and calculates the enthalpy, entropy and specific heats for all the species in the data file.
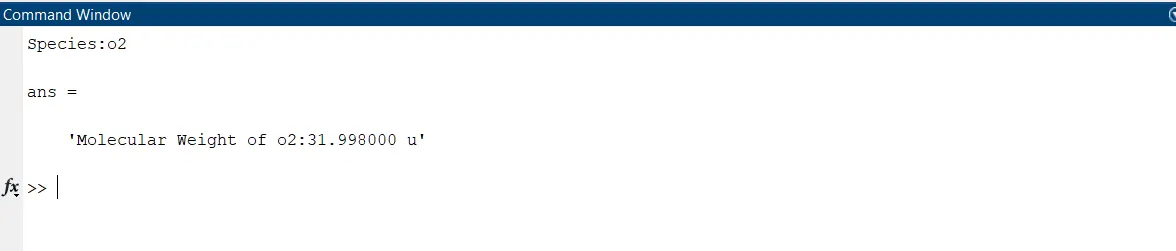
- Calculate the molecular weight of each species and display it in the command window.
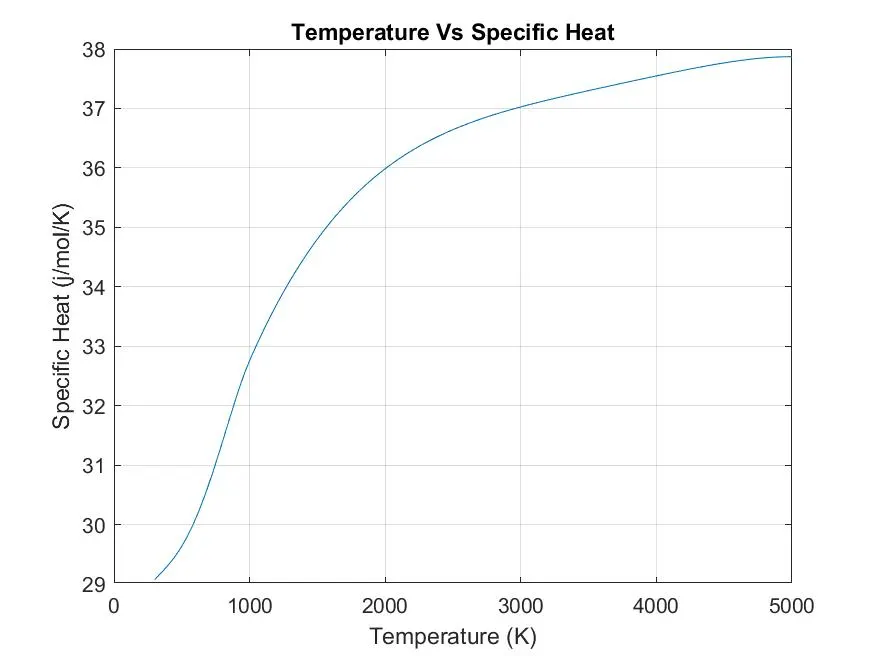
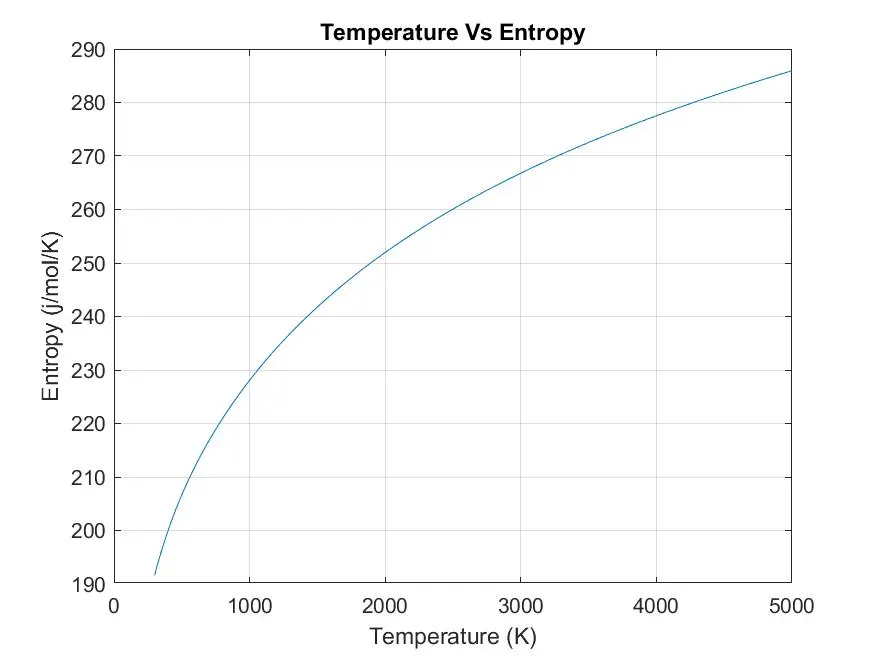
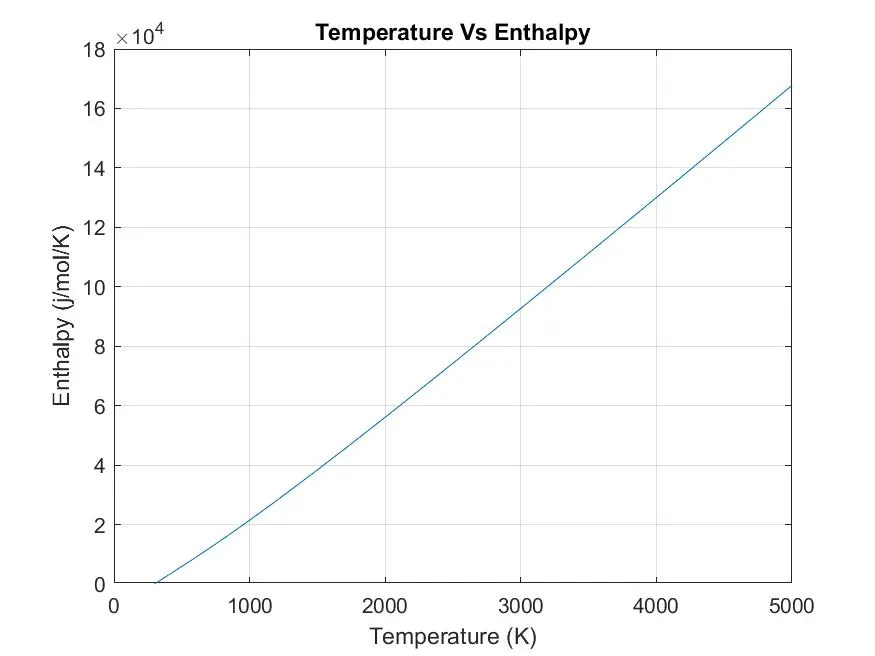
- Plot the Cp, Enthalpy and Entropy for the local temperature range (low temperature: high temperature) specific for each species.
- Save the plots as images with appropriate names and dump them in separate folders for each species with suitable name. All these should be generated automatically.
GOVERNING EQUATION:
`(Cp)/R=a1+a2*T+a3*T^2+a4*T^3+a5*T^4`
`H/(RT)=a1+a2* T/2+a3* T^2/3+a4* T^3/4+a5* T^4/5+a6/T`
`S/R=a1* ln(T)+a2*T+a3*T^2/2+a4* T^3/3+a5* T^4/4+a7`
Here,
Cp- Specific Heat `(j⁄mol⁄K)`
H- Enthalpy `(j⁄mol⁄K)`
S- Entropy `(j⁄mol⁄K)`
R- 8.314 `(j⁄mol⁄K)`
T- Temperature (K)
a1 to a7- Coefficients
CODE:
Program language used: MATLAB
1. Main Code:
%Program to read Thermodynamic data file
close all
clc
clear all

f1=fopen('thermo.dat','r'); %Loading the file
Title=fgetl(f1); %Reading the first line in the file.
A=fgetl(f1); %Reading the second line in the file
A1=strsplit(A,' '); %Spliting the line using delimiter

%Getting the global temperatures
global_lower_temperature=str2num(A1{2});
global_middle_temperature=str2num(A1{3});
global_high_temperature=str2num(A1{4});

%User input
prompt='Species:';
str=input(prompt,'s');

%Selecting the species line that user inputed
for j=1:53 %num_species=53;
    for i=1:4 %For skipping every 3 lines in the file.

        tline=fgetl(f1);

    end

    w=split(tline); %Splitting the tline into an array
    wordsintline=w{1}; %Taking the first value in tline which will be species name
    if  strcmpi(str,wordsintline) %Comparing the user input string with the strings in the wordsintline
        break
    end

end

%If user input a wrong species program terminates
if strcmpi(str,wordsintline)
   [t,Cp,S,H]=calc_thermo(tline,f1); %Calling the function
else
    disp('INPUT NOT CORRECT RUN AGAIN')
    return
end

%Plotting Specific heat graph
figure(1)
plot(t,Cp)
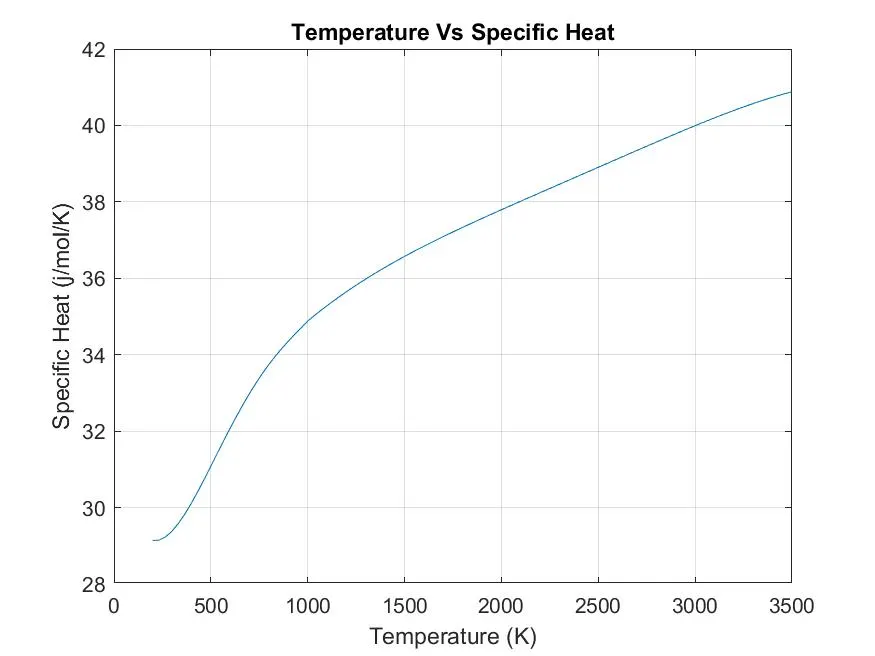
title('Temperature Vs Specific Heat')
grid on
xlabel('Temperature (K)')
ylabel('Specific Heat (j/mol/K)')

%Plotting Enthalpy graph
figure(2)
plot(t,H)
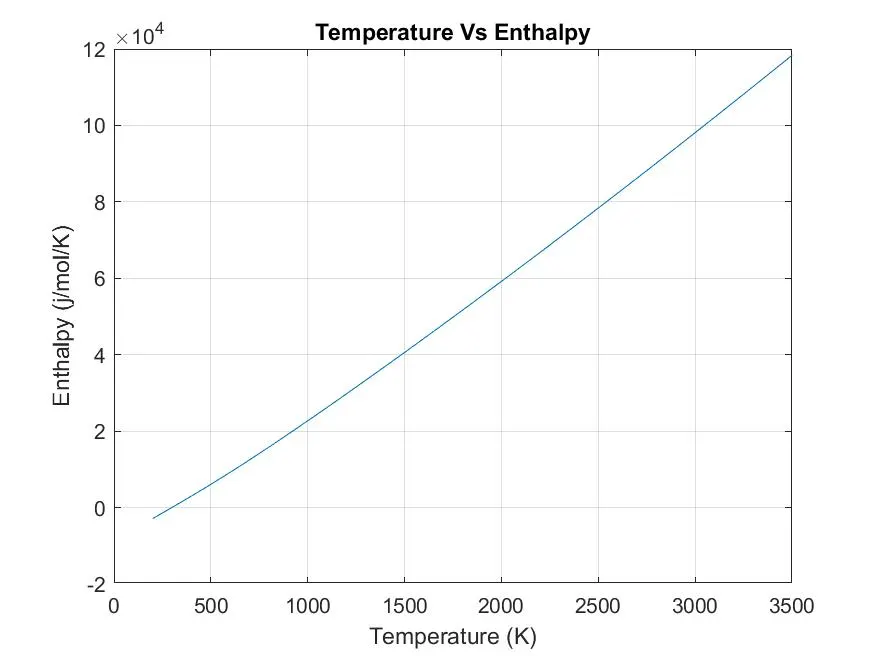
title('Temperature Vs Enthalpy')
grid on
xlabel('Temperature (K)')
ylabel('Enthalpy (j/mol/K)')

%Plotting the Entropy graph
figure(3)
plot(t,S)
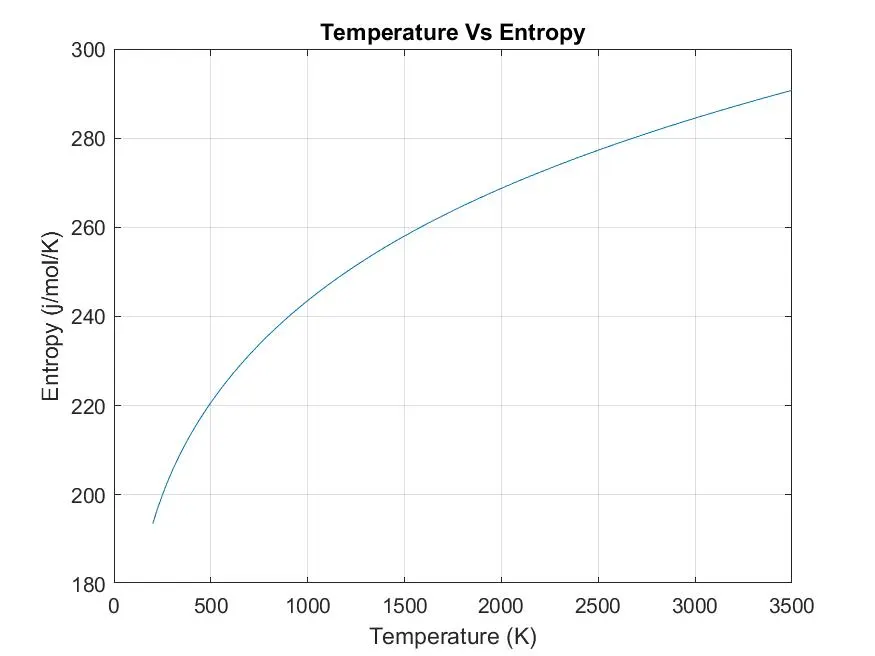
title('Temperature Vs Entropy')
grid on
xlabel('Temperature (K)')
ylabel('Entropy (j/mol/K)')

%Saving the plots into  specified folder under the name of species
mkdir('Thermodata',str) %Creating a folder and sub folder

cd(['C:\Users\Alby\Desktop\Skill Lync\Matlab\Matlab practice\Thermodata\',str]);
saveas(figure(1),'specific heat','jpg');
saveas(figure(2),'enthalpy','jpg');
saveas(figure(3),'entropy','jpg');


%Molecular weight calculations
%Inputs
m=[1.008 15.999 12.011 14.007 39.948]; %Atomic mass
e=['H','O','C','N','A']; %Elements
m_mass=0;
a_mass=0;
i=1;
%While loop used to get each element of the user inputed species
while i<=length(str)
    c(i)=str(i);
    v=str2double(c(i));
    %If statment used to get the number of atoms
    if str2double(c(i))==v
       p=str2double(c(i));
       m_mass=m_mass+a_mass*(p-1);
    end
    %For loop used to comapare the each element of user input with array of 'e'. To get the atomic mass of element.
    for j=1:length(e)
        if strcmpi(c(i),e(j))
           a_mass=m(j);
           m_mass=m_mass+a_mass;
        end
    end
    i=i+1; %incrementing

end
%Printing Molecular weight in command window
sprintf('Molecular Weight of %s:%f u',str,m_mass)
Explaining the code:
- Line 6: Opening the file using command fopen.
- Line 7-8: Reading 1st line of file using command fgetl.
- Line 9: Using command strsplit splitting 2nd line (Line containing global temperatures) and storing it as an array in variable A1.
- Line 12-14: Taking each value of temperatures from A1 and converting into a numeric value using command str2num.
- Line 17-18: Using command input asking the user to give the species name for which further calculation has to be done. The user inputted data is stored in variable called str.
- Line 21: For loop to find the match for user inputted species. There is total 53 species in the file.
- Line 22: For loop to skip every 3 lines so that only species line will be picked.
- Line 24: fgetl used to read every line.
- Line 26: Ending the 2nd for loop.
- Line 28: Splitting the species line.
- Line 29: Picking the first word of the tline which is species name. Curley brackets are used because it’s a string.
- Line 30-31: If statement used for comparing the user inputted species name with every species name in the file. If it matches execution is terminated and that tline is carried to rest of the program. Command strcmpi is used to compare the strings(case insensitive).
- Line 32: End for if statement.
- Line 34: Ending the main For loop.
- Line 37-42: If else statement used to check user inputted data is correct or not. If the statement is true function calc_thermo is called. Function carries the calculation of thermodynamic properties. As output we get temperatures, specific heat, entropy and enthalpy.
- Line 45: Opening 1st figure window.
- Line 46-50: Plotting temperature VS specific heat graph. Giving title for the plot. Grid is drawn for the plot. Labelling x & y axis.
- Line 53-58: New figure window is opened. Plotting temperature VS enthalpy graph. Giving title for the plot. Grid is drawn for the plot. Labelling x & y axis.
- Line 61-66: New figure window opened. Plotting temperature VS entropy graph. Giving title for the plot. Grid is drawn for the plot. Labelling x & y axis.
- Line 69: Using command mkdir creating a new folder to save the plot.
- Line 71: Using command cd changing the current folder to the new folder and saving the plot inside specified folder with species name.
- Line 72-74: Using command saveas saving each plot into ‘jpg’ format.
- Line 79-80: Inputting the atomic mass and elements as an array.
- Line 81-83: Initializing the values for variable.
- Line 85: While loop for taking each elements of the species name.
- Line 86: Picking the 1st letter of the word.
- Line 87: Using str2double changing the string to number.
- Line 88-92: Checking whether the picked word is number or not. If true calculation is done.
- Line 94: For loop used to take each element and compare it with each letter of species name.
- Line 95-98: If statement used to find the match.
- Line 100: Incrementing the counter for while statement.
- Line 102: Ending the 1st for loop.
- Line 104: Printing the molecular weight in command window with species name.
2.Function code:
%Function for calculating Cp,H,S
function [t,Cp,S,H]=calc_thermo(tline,f1) %Defining function

         %Finding the local temperatures from tline
         x=strsplit(tline,' ');
         z=length(x);
         l_low_temp=str2double(x{z-3});
         l_high_temp=str2double(x{z-2});
         l_mid_temp=str2double(x{z-1});

         %Reading next line containing coefficients
         L2=fgetl(f1);
         a=strfind(L2,'E'); %Using letter E locating the coefficients
         cf_1=str2double(L2(1:a(1)+3)); %Changing string to floating number
         cf_2=str2double(L2(a(1)+4:a(2)+3));
         cf_3=str2double(L2(a(2)+4:a(3)+3));
         cf_4=str2double(L2(a(3)+4:a(4)+3));
         cf_5=str2double(L2(a(4)+4:a(5)+3));
         L3=fgetl(f1); %Next line is read.
         b=strfind(L3,'E');
         cf_6=str2double(L3(1:b(1)+3));
         cf_7=str2double(L3(b(1)+4:b(2)+3));
         cf_8=str2double(L3(b(2)+4:b(3)+3));
         cf_9=str2double(L3(b(3)+4:b(4)+3));
         cf_10=str2double(L3(b(4)+4:b(5)+3));
         L4=fgetl(f1); %Next line is read
         c=strfind(L4,'E');
         cf_11=str2double(L4(1:c(1)+3));
         cf_12=str2double(L4(c(1)+4:c(2)+3));
         cf_13=str2double(L4(c(2)+4:c(3)+3));
         cf_14=str2double(L4(c(3)+4:c(4)+3));

         %Creating temperature array
         t=linspace(l_low_temp,l_high_temp,500);
         R=8.314;%Universal gas constant

         %Calculating Cp,S,H
         for i=1:length(t)

             %High temperatures
             if t(i)>l_mid_temp
                Cp(i)=R*(cf_1+cf_2*t(i)+cf_3*t(i)^2+cf_4*t(i)^3+cf_5*t(i)^4);
                H(i)=R*t(i)*(cf_1+(cf_2*t(i))/2+(cf_3*t(i)^2)/3+(cf_4*t(i)^3)/4+(cf_5*t(i)^4)/5+cf_6/t(i));
                S(i)=R*(cf_1*log(t(i))+cf_2*t(i)+(cf_3*t(i)^2)/2+(cf_4*t(i)^3)/3+(cf_5*t(i)^4)/4+cf_7);

             %Low temperatures
             else
                Cp(i)=R*(cf_8+cf_9*t(i)+cf_10*t(i)^2+cf_11*t(i)^3+cf_12*t(i)^4);
                H(i)=R*t(i)*(cf_8+(cf_9*t(i))/2+(cf_10*t(i)^2)/3+(cf_11*t(i)^3)/4+(cf_12*t(i)^4)/5+cf_13/t(i));
                S(i)=R*(cf_8*log(t(i))+cf_9*t(i)+(cf_10*t(i)^2)/2+(cf_11*t(i)^3)/3+(cf_12*t(i)^4)/4+cf_14);
             end
         end

end
Explaining the code:
- Line 3: Function definition is given.
- Line 6: Splitting tline with delimiter as space and storing it in variable x.
- Line 7: Taking the length of x.
- Line 8-10: Finding each value of temperatures and converting into floating numbers.
- Line 13: Next corresponding line is read.
- Line 14: Finding letter E in that line.
- Line 15-19: With respect to E finding all coefficients in that line and converting it into numbers.
- Line 20-26: Next corresponding line is read. Finding letter E in that line, with respect to E finding all coefficients in that line and converting it into numbers.
- Line 27-32: Next corresponding line is read. Finding letter E in that line, with respect to E finding all coefficients in that line and converting it into numbers.
- Line 35: Creating an array of temperatures between low and high temperatures.
- Line 36: Value for universal gas constant.
- Line 39: For loop is created to take each value of temperature.
- Line 42: If statement is used to find if the temperature is greater than the mid temperature.
- Line 43-45: Calculating the Cp, H, S values for higher temperature coefficients.
- Line 48: Else statement is used to get low temperature values.
- Line 49-51: Calculating the Cp, H, S values for lower temperature coefficients.
- Line 52-55: Ending all open loops.
RESULT:
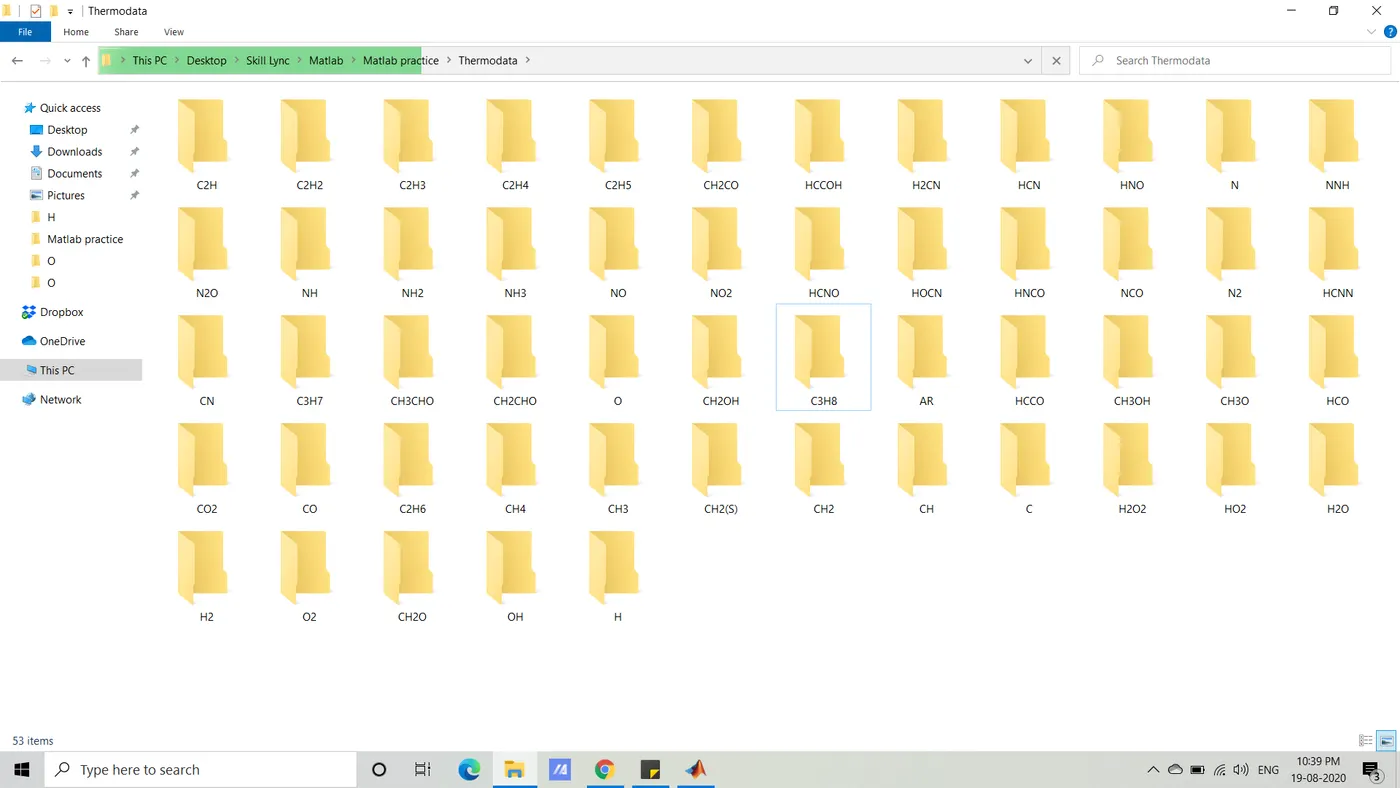
- Screenshot of the window where all the species are saved.
-
Plot for O2:
- Molecular weight of O2:
- Plot for N2:
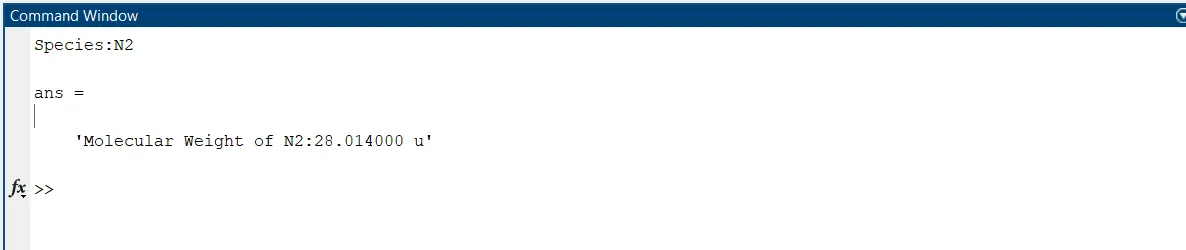
- Molecular weight of N2:
- Plot for CO2:
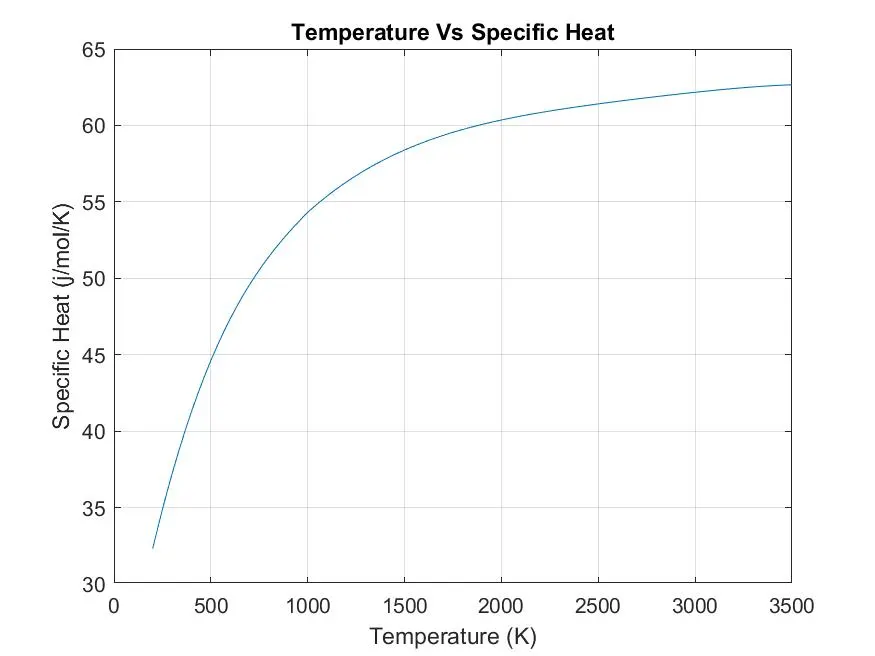
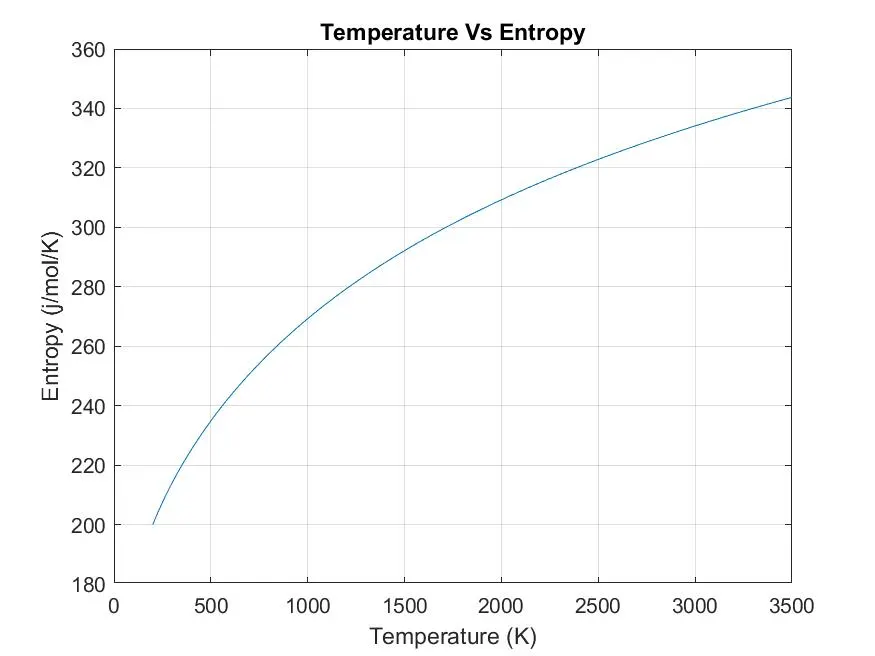
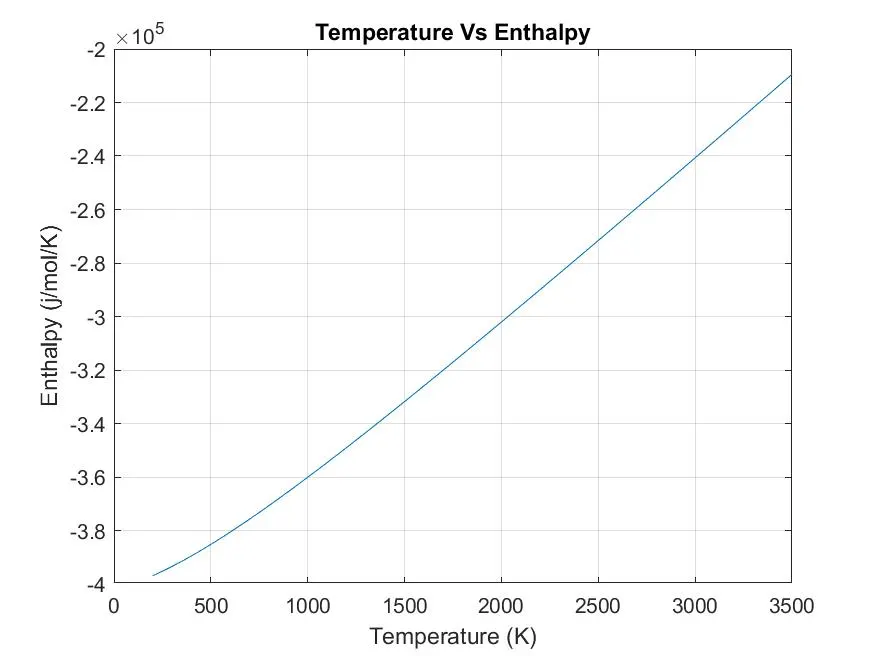
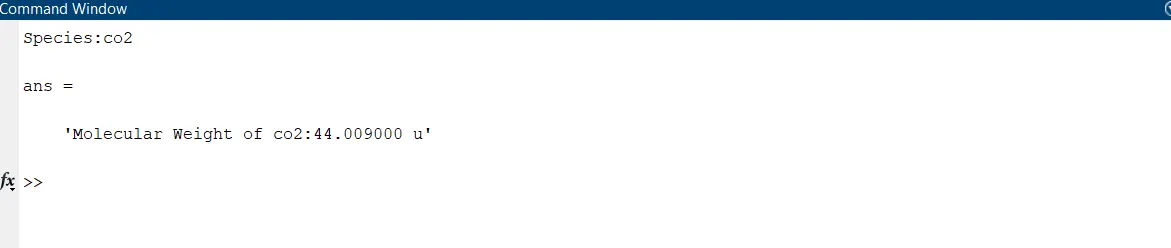
- Molecular weight of CO2:
ERRORS FACED:
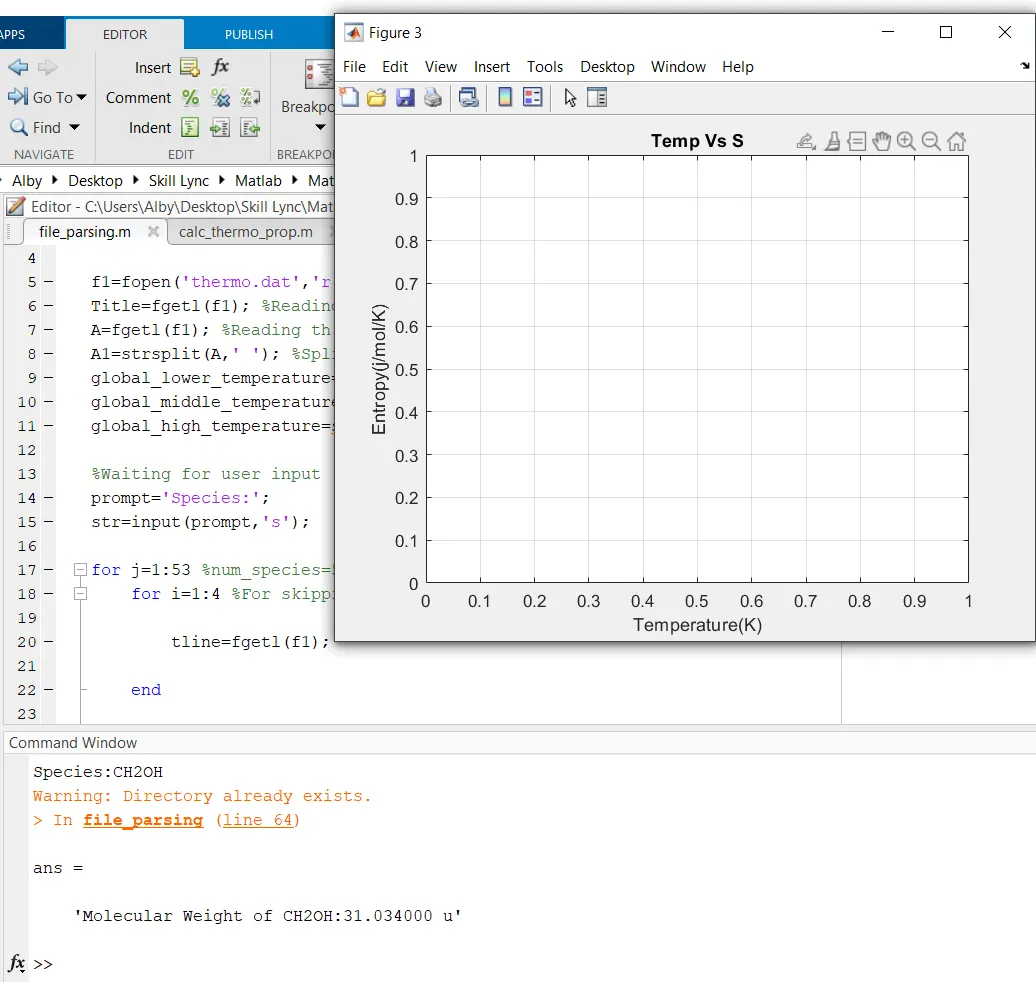
- For CH2OH no values were getting for Cp, H & S. No error message on command window.
Solution:
Changed the way of picking the local temperatures. Firstly I used finding letter G and with respect to that I was finding the local temperatures. Since CH2OH line has got two G letters the program was confused.
New method:
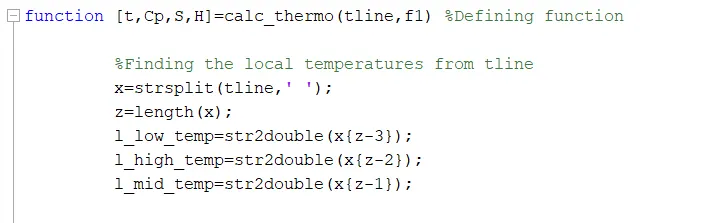
Here I’m splitting the line and finding the position of temperatures.
- Not able to give title for the plot
Error: Index exceeds the number of array elements (6).
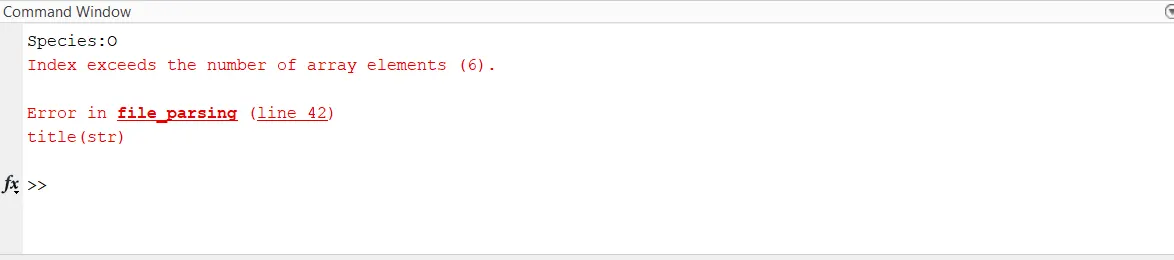
Solution: Initially line 7 had same variable name of command ‘title’. I changed the variable name to Title. Capitalized the ‘t’.
- Input was case sensitive.
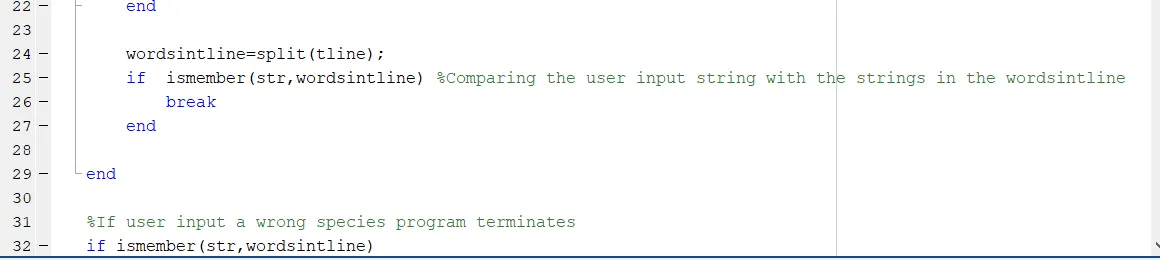
Initially used ismember command to get match with the user input to tline.
Solution: strcmpi command used. For that I had to split the tline first and pick the first word which will be species name and compare with user input (Line 28-32).