Week-11 Challenge: Braking
1)ENERGY REQUIRED FOR BRAKING
AIM
To calculate the energy required for braking ,for a defined driving cycle.
GOVERNING EQUATION
To calculate energy ,
`E = 1/2m(v_f^2-v_i^2)`
Where , `m` is the total mass , `v_f` is the final velocity ,`v_i` is the initial velocity.
Here velocity is in `m/s` and `m` is in`Kg`.
This equation gives us energy in`J`.
PROGRAM
Before coding we have to create an excel sheet containing the drive cycle data and this excel sheet file has to be copied and pasted in the MATLAB directory , so that MATLAB can access the file.
The drive cycle excel sheet is shown below,
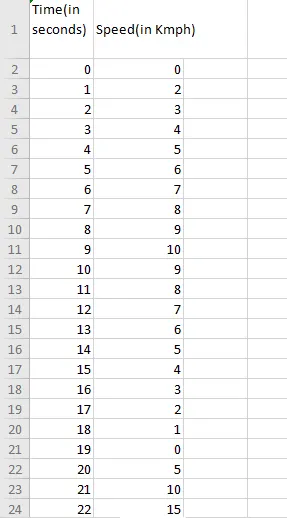
The script file is as shown below,
clear all
close all
clc

%loading the excel sheet and accessing its 2nd column
x= xlsread('IHEV C2-3 drive cycle data.xlsx');
drive_cycle=x(:,2);

%for loop
for n=1:151

    %if statement to identify deceleration
    if drive_cycle(n+1)-drive_cycle(n)<0
        %energy equation
        E(n) = (0.5*1000*(((drive_cycle(n+1)^2 - drive_cycle(n)^2)*25)/324))/1000;

   end
end
%total energy
TE = sum(E);

%printing the total energy
X=sprintf('braking energy in kJ = %s', TE);
disp(X)
Here at the beginning we have defined a variable ‘x’ to be equal to the excel sheet file which we have created. To load the excel sheet we have used the MATLAB command ‘xlsread’.
Then we have defined drive cycle as the data from the second column of that excel sheet since the second column contains the speed values.
Now a for loop is opened which has 151 iterations.
Then an if statement is given , which will check whether the difference of the current value of the iteration and the value coming after that is negative.
This if statement basically checks for deceleration.
Then inside this if statement the energy equation is defined as an array of size equal to the number of iterations.
Here the equation is converted to kJ by dividing by 1000.
Also the speed values inside the excel sheet is in Kmph so that is also converted to m/s.
The mass is assumed to be 1000.
Then the if statement and the for loop is closed.
Now total energy is found using the ‘sum’ command , which will add all the values inside the energy array.
Then ‘sprintf’ command is used to display the energy value.
CONCLUSION
The braking energy is found out successfully using the MATLAB script file.
2)Why electric motor can’t develop braking torque at high speed similar to starting? How electric and mechanical brakes are coordinated?
ANSWER
This is because of the motor characteristics. The motor operates in such manner that it will operate at constant torque region till a speed. If we have to increase the speed beyond this point we have to compromise torque and hence the motor will enter constant power region. In this constant power region torque decreases drastically with increase in speed value.
This characteristics is shown below,
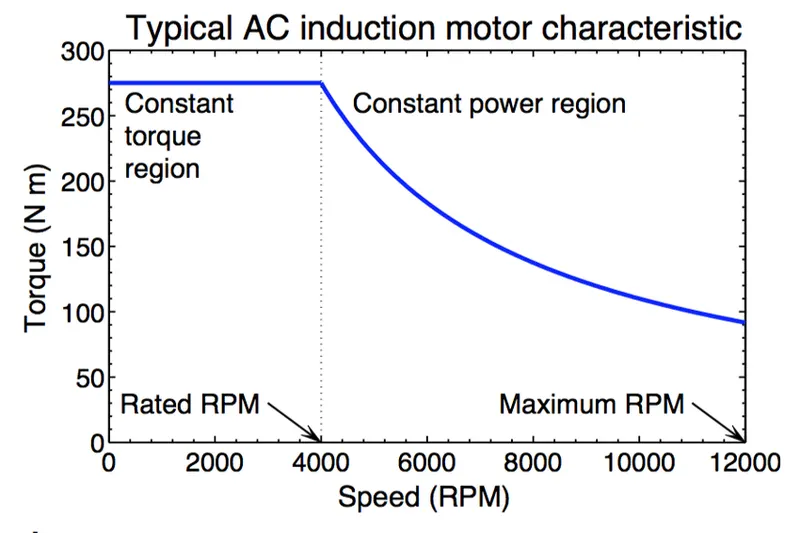
Now coming to the braking torque at higher speed , in this case we know the speed is decreasing from a higher speed value to a lower speed value. So from the earlier explanation of the motor characteristics we know that at higher speed the torque is lower. And when we brake at this high speed we are operating the motor in its field weakening region and hence the torque available is also low.
But during the start we have higher torque value to be utilized for the braking operation.
To understand this better in the braking region , let us look at the torque vs speed characteristics for an EV in braking region also , the characteristics is shown below,
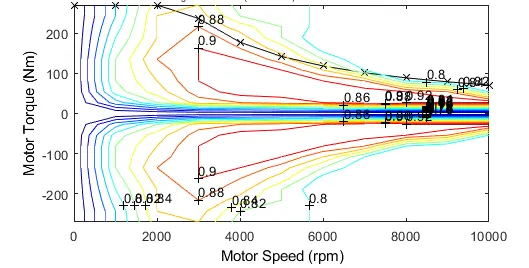
Here we can see that at high speeds the corresponding braking torque is low. Another thing to note is that , the braking characteristics are mirrored image of acceleration characteristics of the vehicle.
Electrical and mechanical brakes are coordinated in two ways ,
1)Series control strategy :- In this strategy mechanical and electrical braking are applied one after the other. So in this case only one of them is used at a time.
2)Parallel control strategy :- In this strategy both mechanical and electrical brakes are applied at the same time.
3)TO CREATE CONTOUR PLOT FOR MOTOR CHARACTERISTICS
AIM
To make a MATLAB program which plots contour of given motor speed, torque and efficiency values.
GOVERNING EQUATIONS
Equation for losses are follows,
`"Copper loss" = K_c*T^2`
`"Iron loss" = K_I*omega`
`"Windage loss" = K_w*omega^3`
`"Constant loss" = C`
Where `K` is the constant respective to the losses , `omega` is the velocity , `C` is the constant which takes care of all other losses other than the three defined.
`"Output power" = T*omega` , where `T` is the torque
`"Input power" = "Output power"+ "Copper loss" + "Iron loss" + "Windage loss" + "Constant loss"`
`"Efficiency"="Output power"/"Input power"`
PROGRAM
The MATLAB script file is as shown below,
clear all
close all
clc

%creating array of speed and torque
x =linspace(0,1000);
y =linspace(0,250);

%specifying contants of losses
Kc=0.2;
Ki=0.008;
Kw=0.00001;
constL=20;

%creating the 2D coordinate values of x & y
[X,Y] = meshgrid(x,y);
%%
%calculation
output_power=(X.*Y);

B=(Y.^2)*Kc;
C=X*Ki;
D=(X.^3)*Kw;

input_power=output_power+B+C+D+constL;

Z=output_power./input_power;
%%
%efficiency values to be displayed
V=[0.65 0.7 0.75 0.8 0.85 0.9 0.925 0.95];
box off
grid off

%creating contour plot
contour(X,Y,Z,V,'showtext','on');
Here at the beginning we have defined two arrays , namely x and y. where x represents speed array and y represents torque array.
Then the different constant of loss values are specified.
Then the x and y are converted to 2D coordinate values using ‘meshgrid’ command.
Now the output power ,input power, all other losses and the efficiency are calculated using the respective equations.
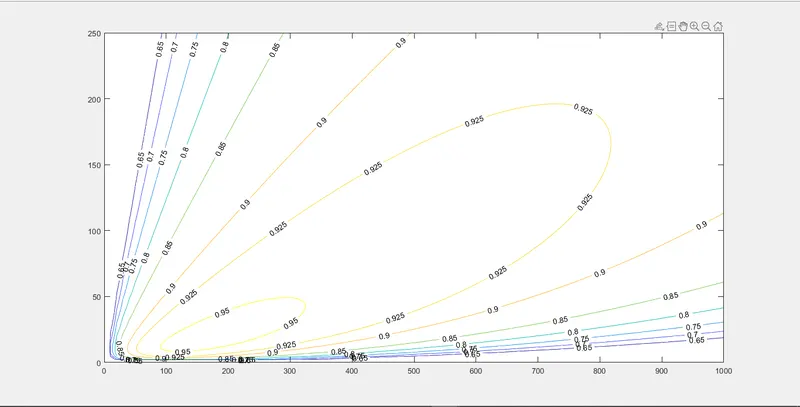
Then we create an array ‘V’ which contains the efficiency values which we want to display in the output plot. Only those values of efficiency will be displayed in the contour plot.
Now the contour plot is created using the ‘contour’ command in MATLAB.
PLOT
CONCLUSION
The MATLAB program to plot contour of given motor speed, torque and efficiency values has been created successfully.