MATLAB program that plots the contour of given motor speed
Q1 For a defined driving cycle, calculate the energy required for braking.
ANS:
Deceleration conditions are similar to acceleration conditions. Acceleration increase in speed and deceleration is a reduction In speed. So similar way to calculate braking power.
During braking also required the same amount of power required for acceleration so applying those standard equations we can calculate the energy for braking by the following formula :
`Energy=1/2*M*V2`
Where M= mass of the vehicle.
V= Velocity.
By this formula, we can calculate the energy in watt/h
Drive cycle link is following:
https://docs.google.com/spreadsheets/d/1KNw3a7l0GCQBo8l3f0P83etoabWOiVbvDWKFZOZ7JVo/edit#gid=0
Assumptions:
M: 1000kg
Vi: 100kn/h (Intioal speed)
Vf: 0 (final speed)
Acceleration time: 10sec
Acceleration: 2.5m/s^2
from that,
Acceleration power: 58
converted into sec so 58/3600*10=0.1611kw
Now from 100 to 0 how much is braking power is required that we have to calculate.
`Energy=1/2*M*V2`
=0.5*1000*(Vi-Vf)`^2`
=0.5*1000*(10.12)^2
= 13.88 KJ
Q2Why an electric motor can’t develop braking torque at a high speed similar to starting? How electric and mechanical brakes are coordinated?
ANS:
Now Speed torque characteristics of the motor is shown below,
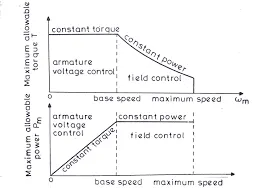
Here it is clearly shown in the first graph that till the motor reaches the critical speed it has constant torque and once it reaches the critical speed, the curve is having a downslope which is a constant power region. And this graph denotes the accelerating operation of the motor. For the deceleration or braking operation of the motor, this graph is mirrored down which will be having the speed (+ve) and torque (-ve).
For example,
we can say that an EV can achieve 0-100 kmph in 10sec. Acceleration operation goes this way, with low speed and high torque Constant torque region is achieved which has accelerating power and by reaching the critical speed it shifts to constant power region and thus it easy for an EV to reach 0-100 kmph.
As said the breaking operation graph will be the mirrored image of the above plot. So we cannot say that the motor producing 7Nm torque for acceleration can also produce -7Nm for breaking. Because we are operating in the field weakening region and operating above the base speed. Thus Peak Acceleration torque is greater than the Peak Deceleration torque. Thus for acceleration, it has high torque with low speed and for deceleration, it has low torque for high speed.
Electric and mechanical brakes are coordinated:
There are two brake control strategies namely, SERIES & PARALLEL.
SERIES:
Brakes will be applied one after another so which they are connected in series. Either one brake stragety at a time either Regenerative braking or Mechanical braking at a time.
PARALLEL:
In the case of parallel both the brakes are applied simultaneously, Both at a time.
ELECTRIC DRIVEN INTELLIGENT BRAKE:
And Nissan has developed a practical brake strategy called ELECTRIC DRIVEN INTELLIGENT BRAKE developed by Nissan leaf.
Technology Functionality:
After stepping on the brake pedal, the system produces a natural and adequate braking force that corresponds to the operation. The amount of energy regeneration also needs to be increased as much as possible. EDIB (Electric Driven Intelligent Brake) controls the regenerative brake and friction brake to support both of these requirements. Further, it also controls the reactive force from the pedal in order to unify the feeling when stepping down on the pedal and the sense of deceleration.
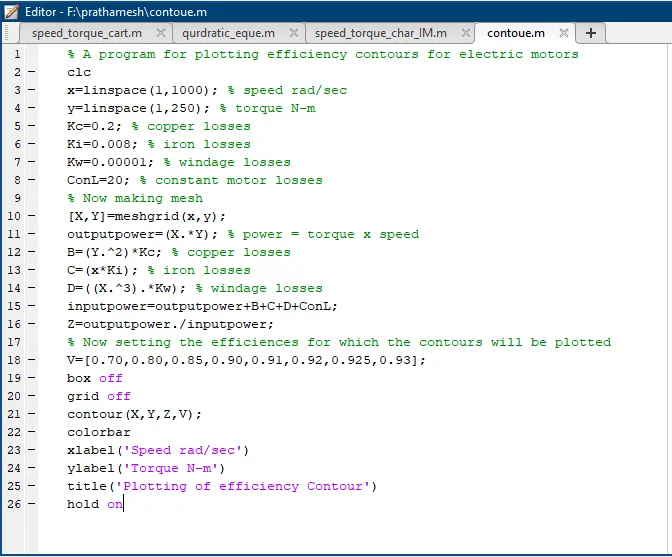
Q3. Make a MATLAB program that plots the contour of given motor speed, torque, and efficiency values. Attach the code as a .m file attach a screenshot of all the plots.
ANS:
MATLAB program :
OUTPUT:
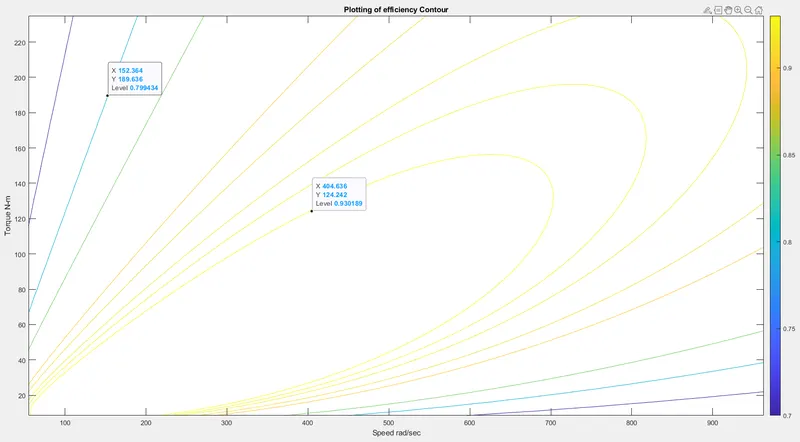
RESULT:
As we see in output we going inside to circle our efficiency get increase and outside it will decrease.