Week 10 - Simulating Combustion of Natural Gas.
AIM
Part I
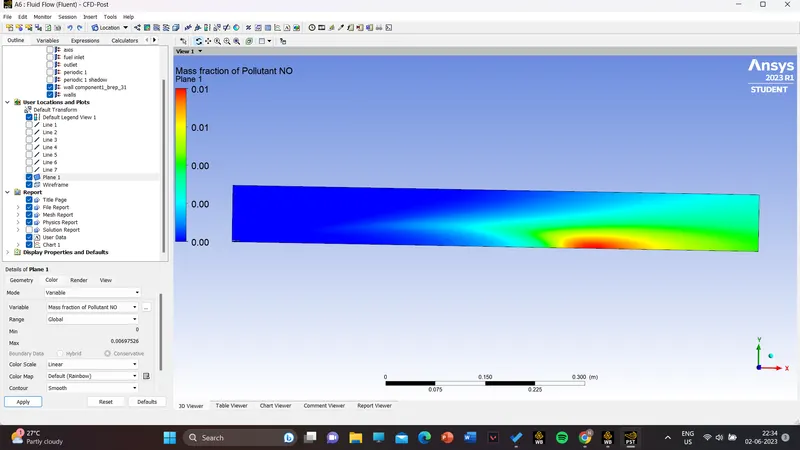
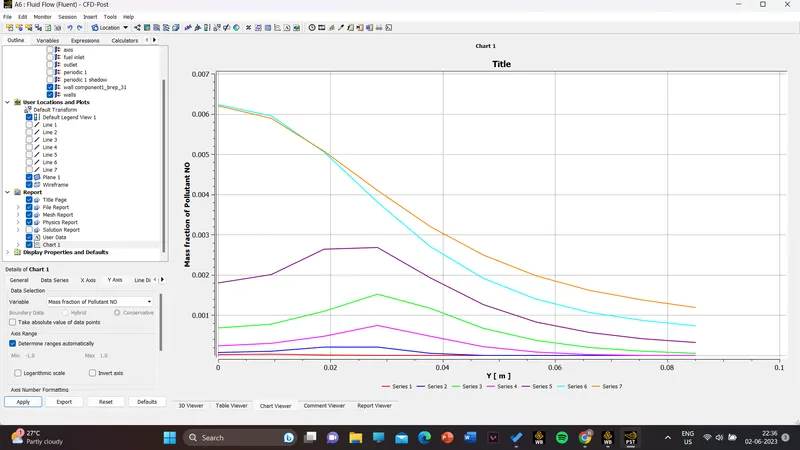
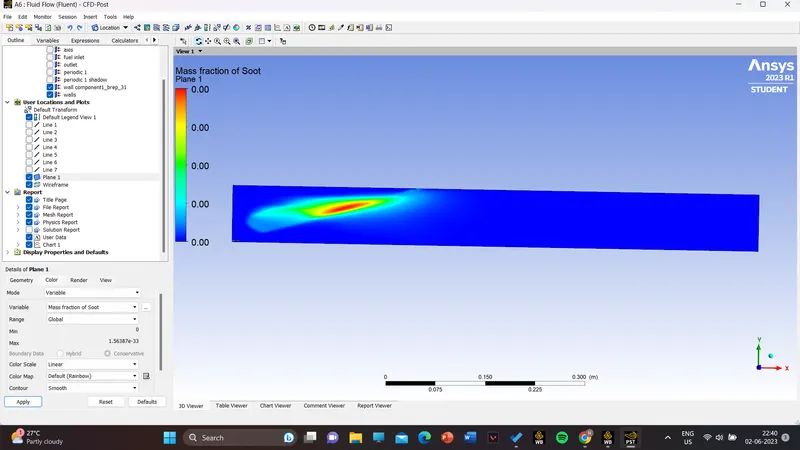
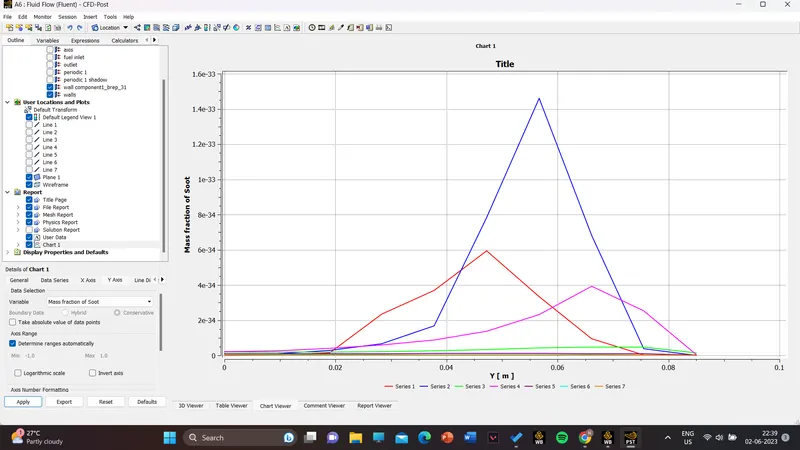
Perform a combustion simulation on the combustor model and plot the variation of the mass fraction of the different species’ in the simulation using line probes at different locations of the combustor as shown in Fig. You need to plot for CO2, H2O, CH4, N2, O2, NOx emissions & Soot formation.
part 2
you need to add the water content in the fuel from 5% to 30% by mole and observe the effect of it on the results. It is necessary to provide line plots and contours to prove your claim.
Theory
1. COMBUSTION
Combustion is defined as achemical reaction in which a hydrocarbon reacts with an oxident to form products, accompanied by the release of energy in the form of heat.
Combustion manifests as awode domain during the design, analysis, and performance characteristics stage by being an integral part of various engineering applications like internal combustion engines,furnaces and power station conbustors.
2. Conbustion model for CFD Analysis
Comptational fluid dynamics modeling of combustion calls upon the proper selection and implementation of model suitable to faithfully represent the complex physical and chemical phenomenon associated with any combustion process.
The model should be competent enough to deliver information related to the species concentration, theri volumetric generation or destruction rate and changes in the parameters of the system like enthalpy, temperature and mixture density.
The model should be capable of solving the general transport equations for fluid flow and heat transfer as well as additional equations of combustion chemistry and chemical kinetics incorporated into that as per the simulating environment desired.
3. Possible types of Combustion Simulation possible in Ansys Fluent
The simulation of combustion can be divided into two types-
A. Combustion based on Mixing
- Non-Premixed Combustion
- In non-premixed combustion, fuel and oxidizer enter the reaction zone in distinct streams.
- It occours during direct injection or late injection of fuel in IC engines.
- Examples of non-premixedcombustion includes pulvarized coal furnaces, diesel internal-combustion engines and pool fires.
- Premixed Combustion
- In premixed combustion,fuel and oxidizer are mixed at the molecular level prior to ignition.
- Combustion occurs as flames front propagating into the unburnt reactants.
- Examples of premixed combustion include aspirated internal combustion engines, lean- premixed gas turbine combustors, and gas-leak explosions.
- Partially Premixed Combustion
- Partially premixed combustion systems are premixed flames with non-uniform fuel-oxidizer mixtures(equivalence ratios).
- Such falmes include premixed jets discharging into an inert atmosphere, lean premixed combustors with difussion pilot fames and cooling air jets, and imperfectly mixed inlets.
B. Combustion based on Phase
- Fluid Phase (Volumetric Reactions)
- Combustion takes place in the fluid region.
- Wall (Surface Reactions)
- Combustion takes place on the wall or a solid surface.
- Particles ( Surface Reactions)
- Combustion takes place on the Lagrangian particles.
- Combustion of coal is an example of particle combustion.
- Porous Region
- Combustion takes place in a porous region.
- The reactions in an after-treatment system is am example of combustion in the porous regions.
. Combustion Reactions
The general reaction of combustion is given as follows-

Balancing the given stoichiometric equation-
- a=1
- 2b=4 , b=2
- 2ar=2a+b,ar=2
- c=7.52ar , c=15.04
The above values corresponds to the number of moles of the given species.
AIR:2 moles of O2 +7.52 moles of N2
Mole fractions:
Mole fractions of O2=2/(2+7.52) =0.21
Mole fractions of N2 = 7.52/(2+7.52) =0.79
Mass fractions:
Mass fraction of O2=(0.21*16)/((0.21*16)+(0.79*14) ) = 0.23
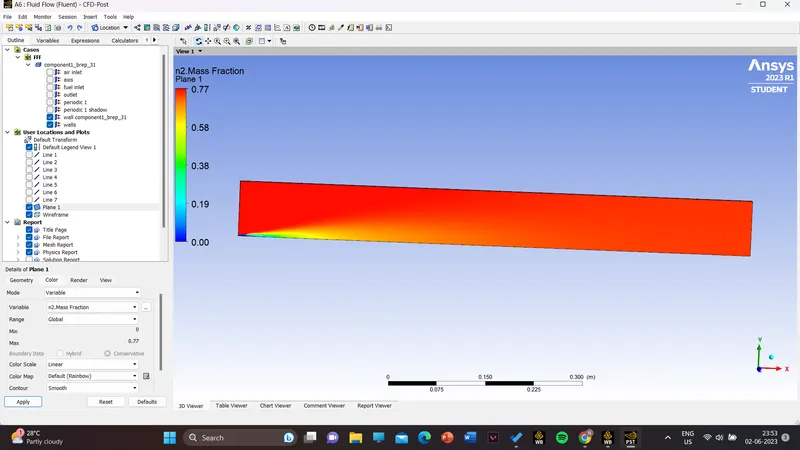
Mass fraction of N2 = (0.79*14)/((0.21*16)+(0.79*14) ) = 0.77
Procedure
open geometry in space claim .
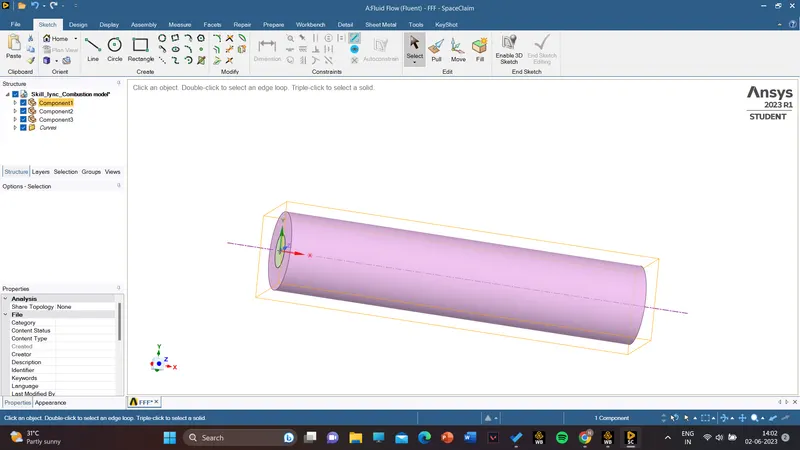
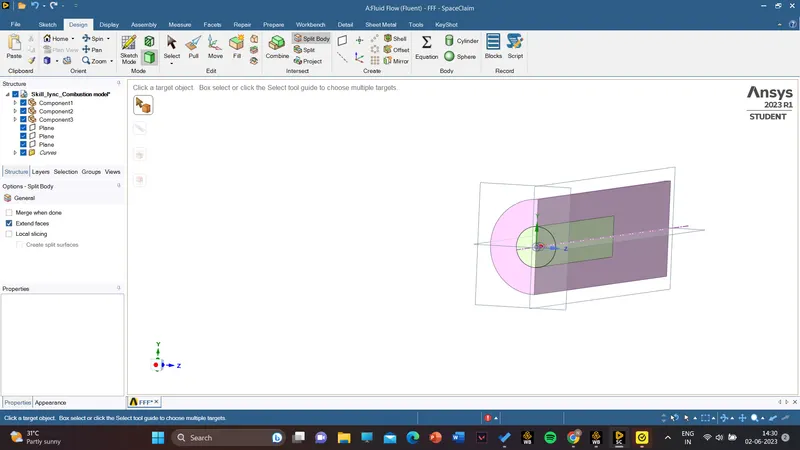
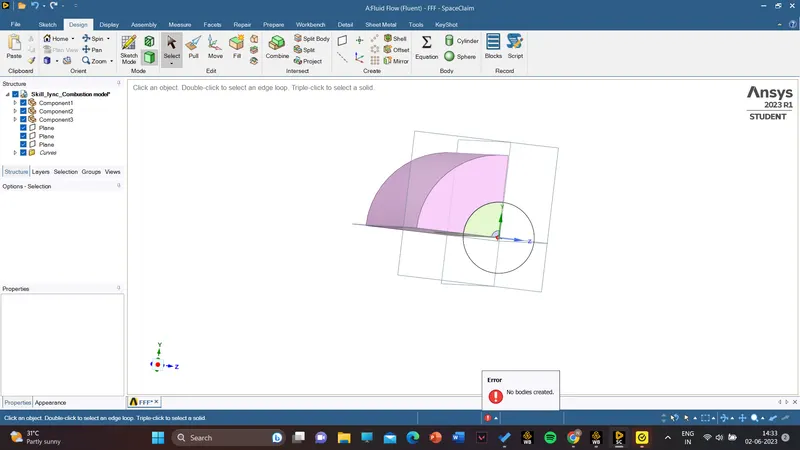
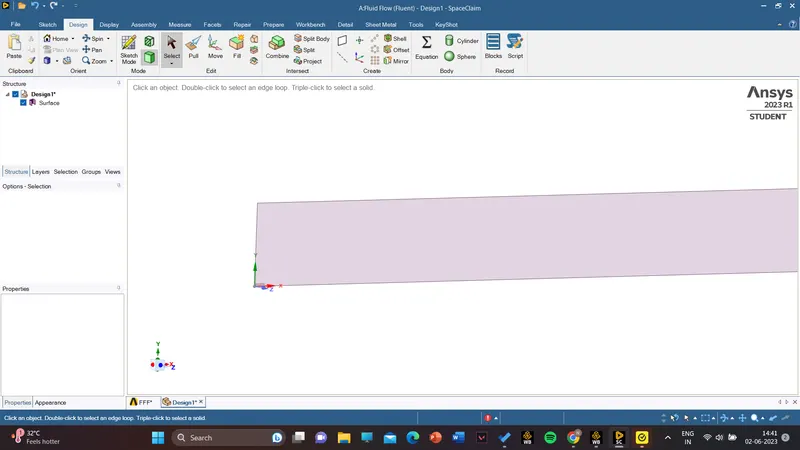
this is the required axisymmetric geometry.
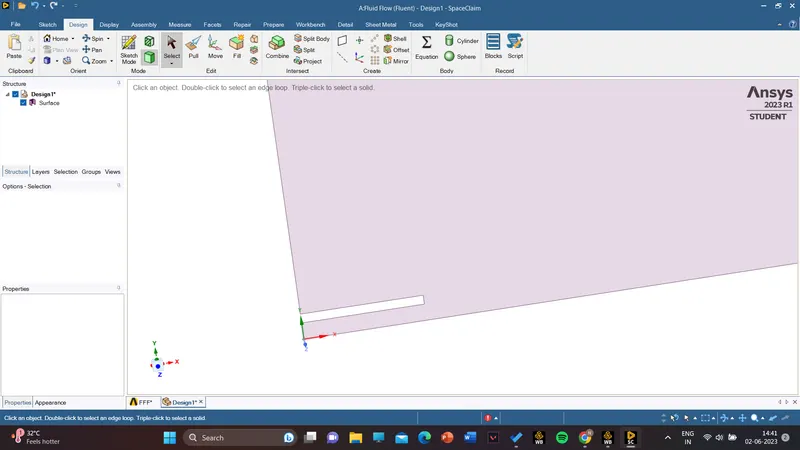
now go to meshing
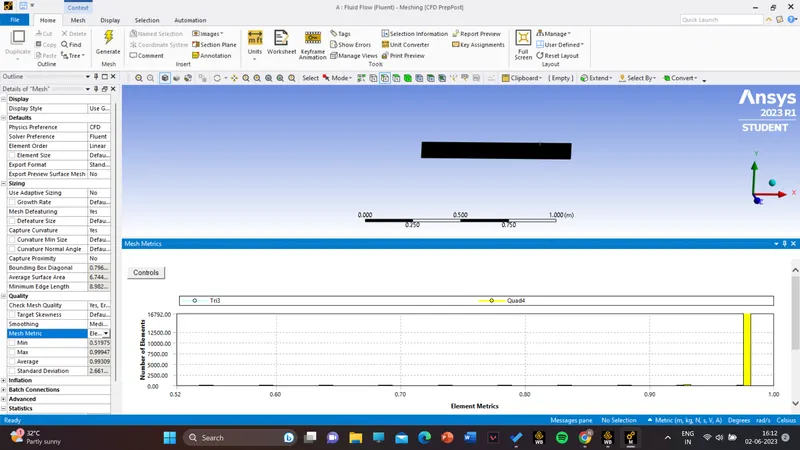
Named selection
axis
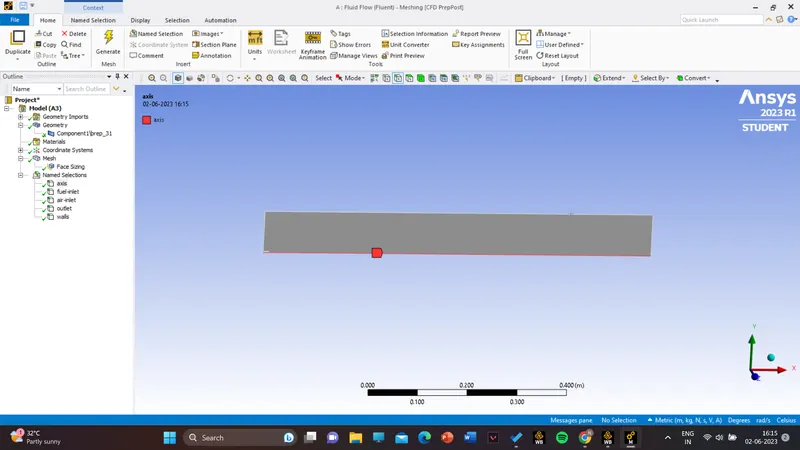
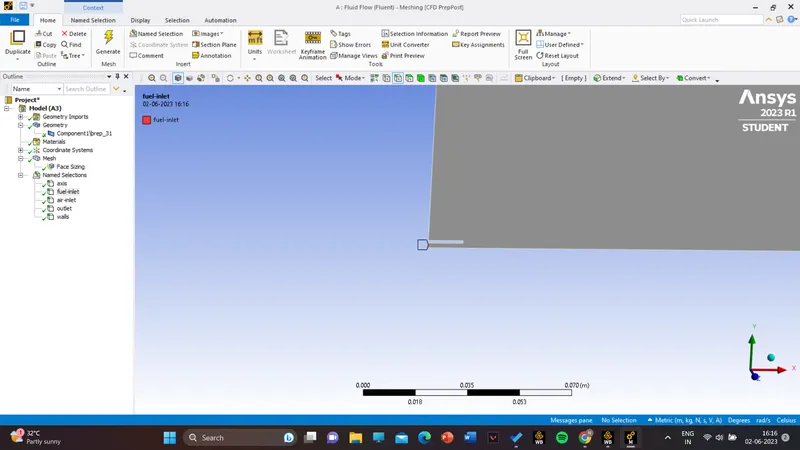
air inlet
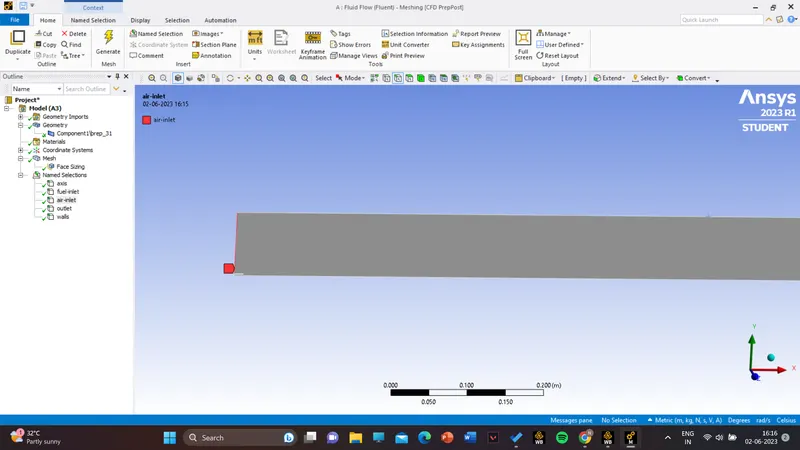
fuel inlet
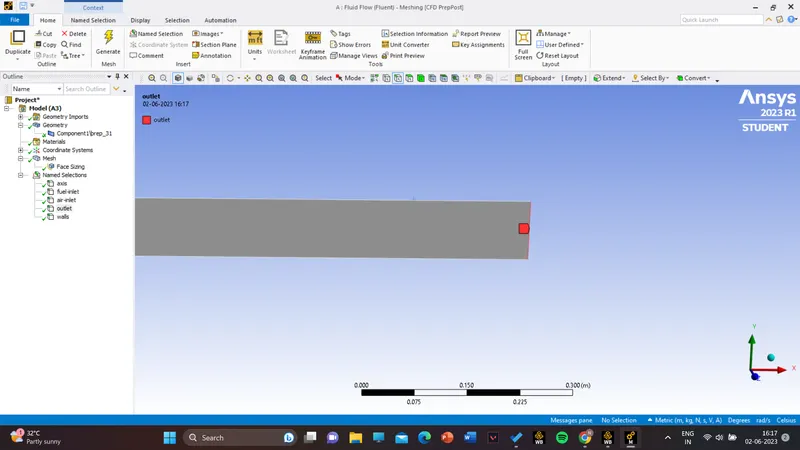
outlet
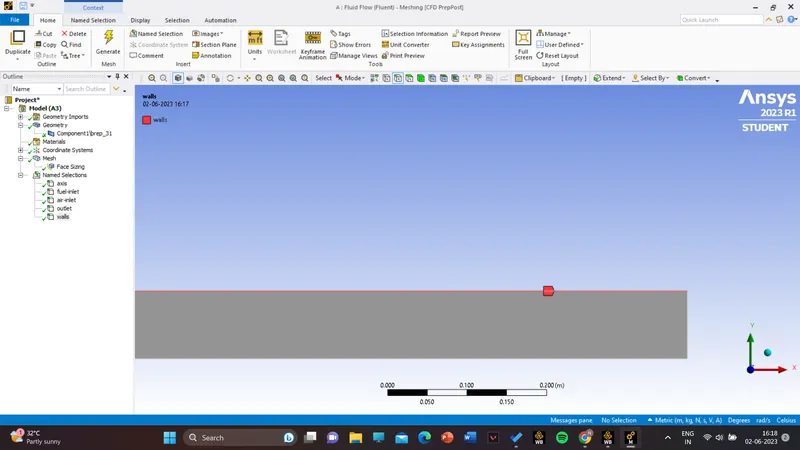
walls
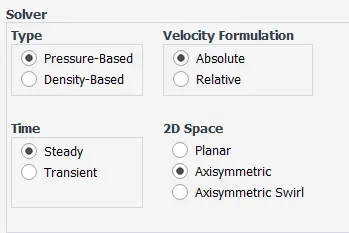
Go to setup
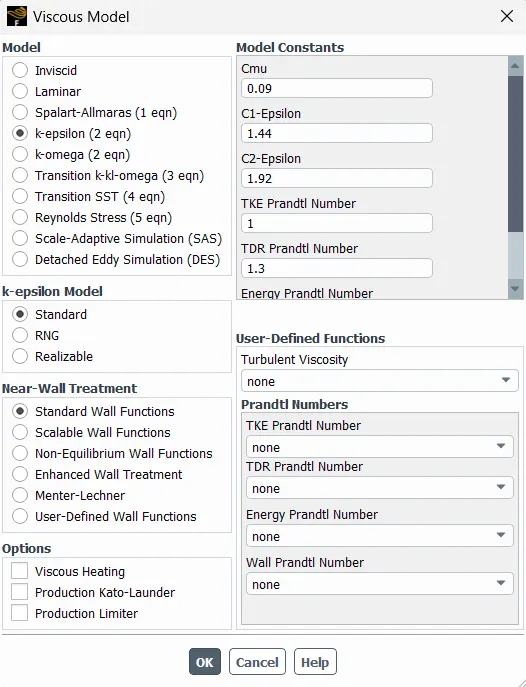
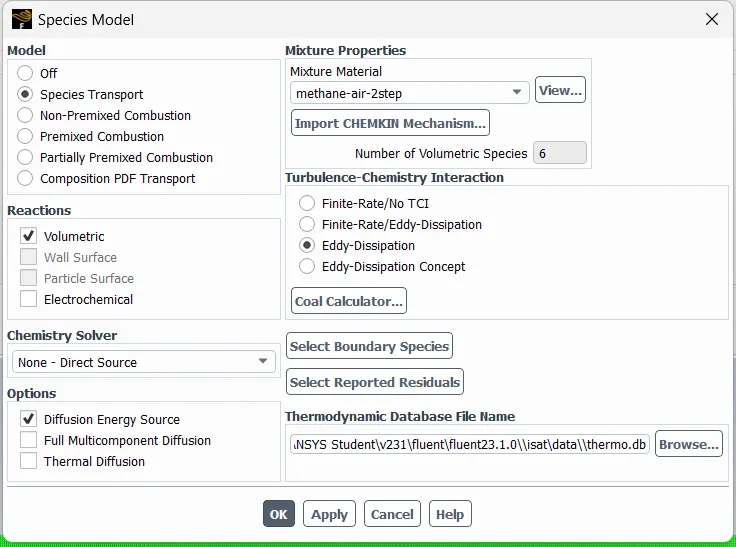
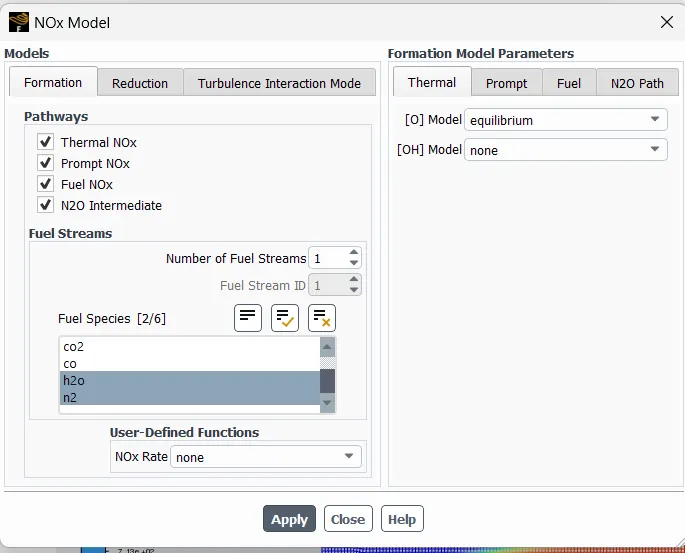
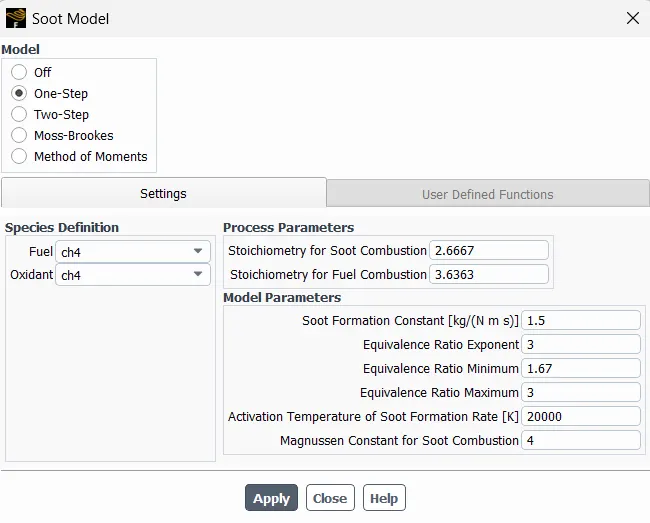
boundary conditions
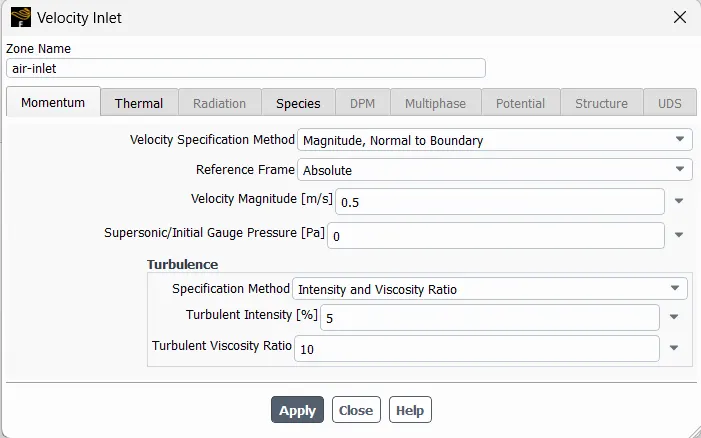
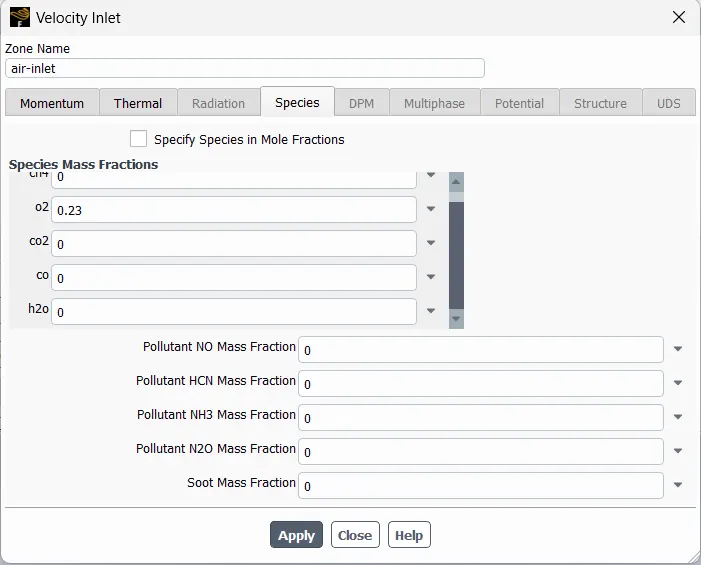
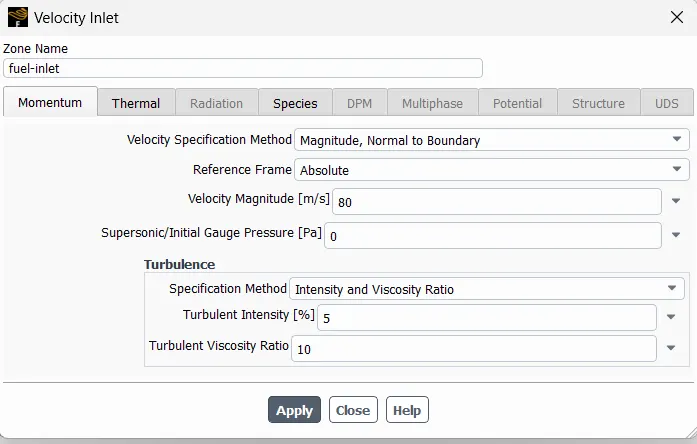
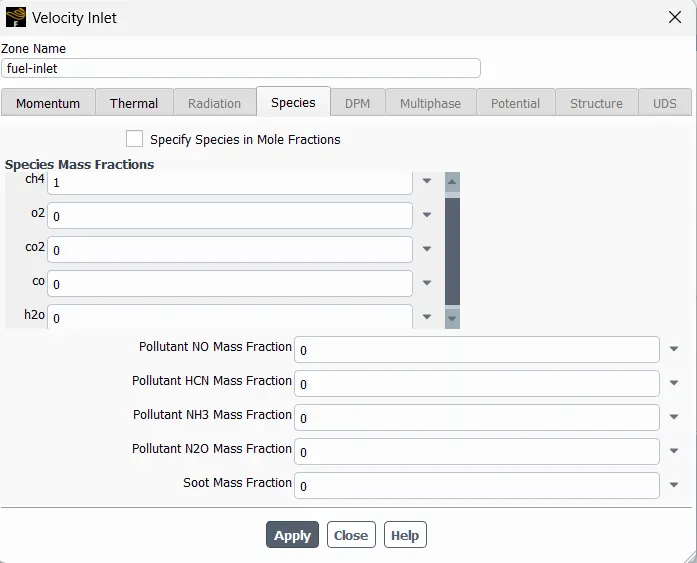
Part 1
result for 100% CH4 and air
temperature contour
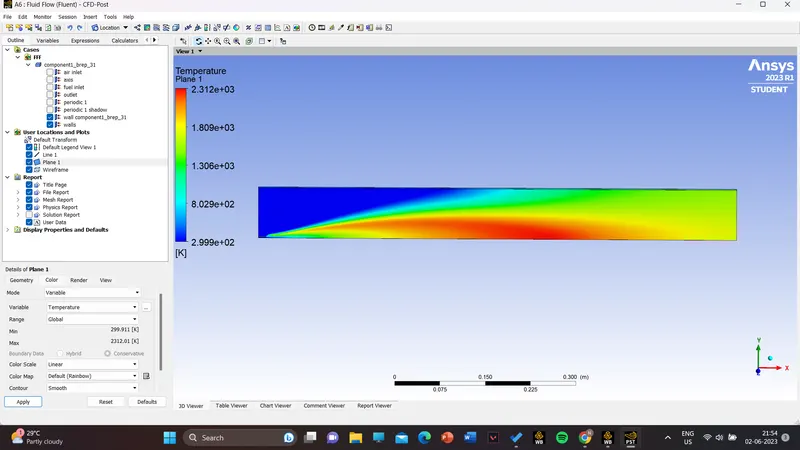
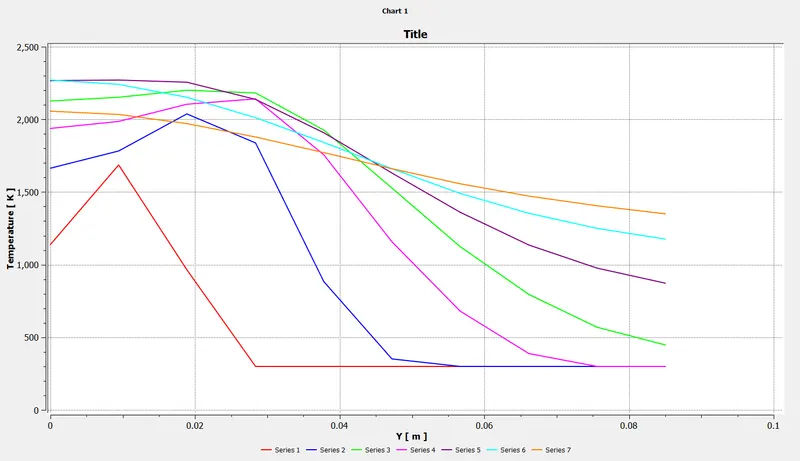
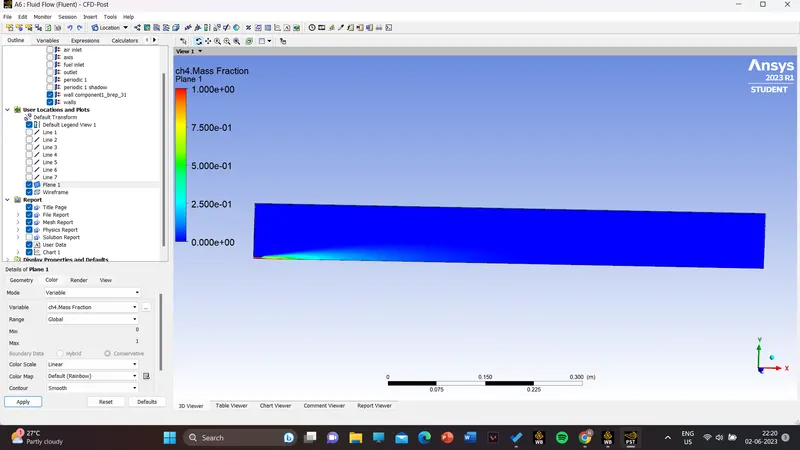
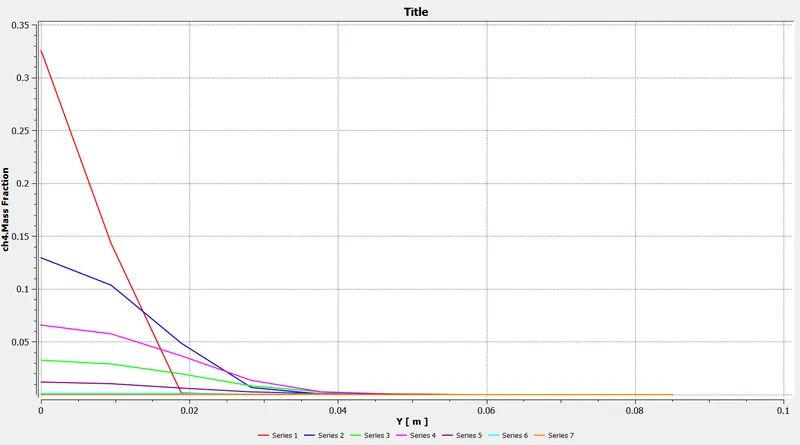
ch4 contour and mass fraction chart
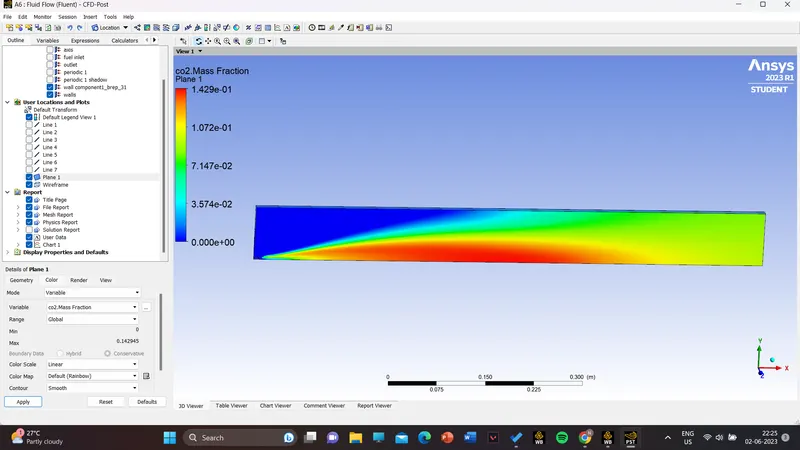
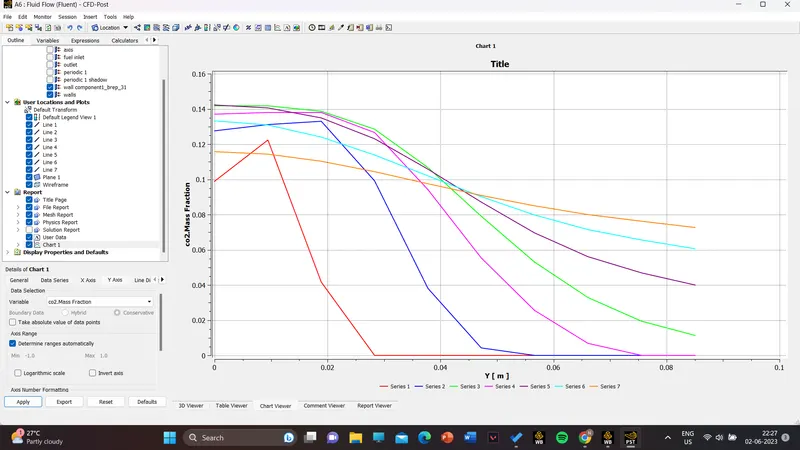
No2 contour and mass fraction plot
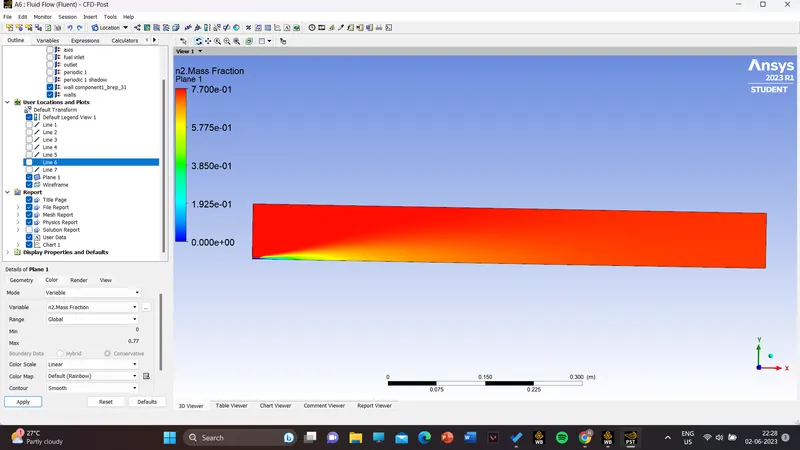
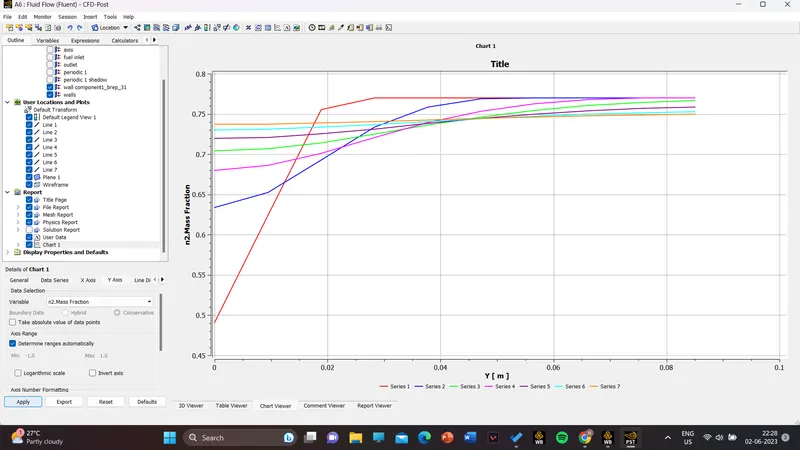
N2 contour and mass fraction
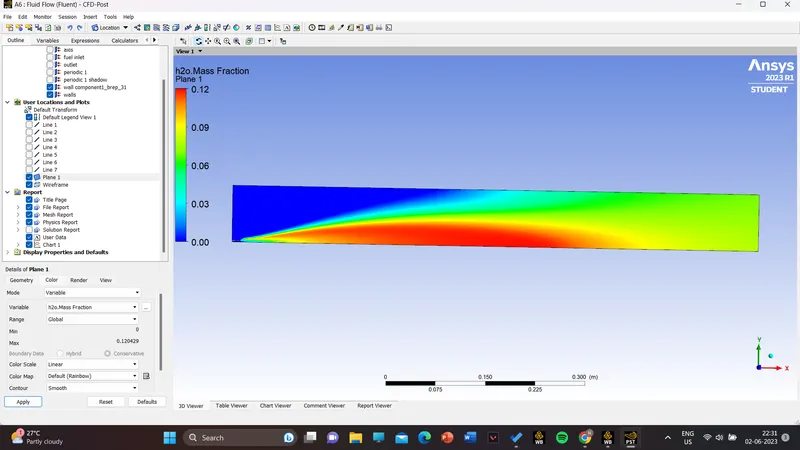
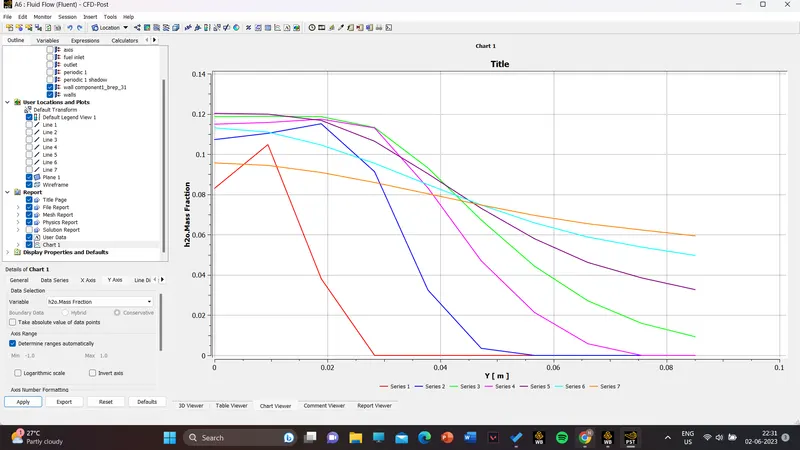
H2O contour and mass fraction chart
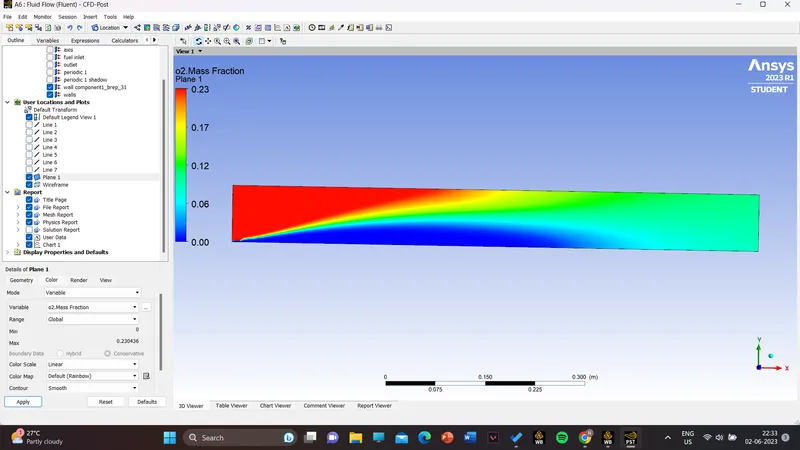
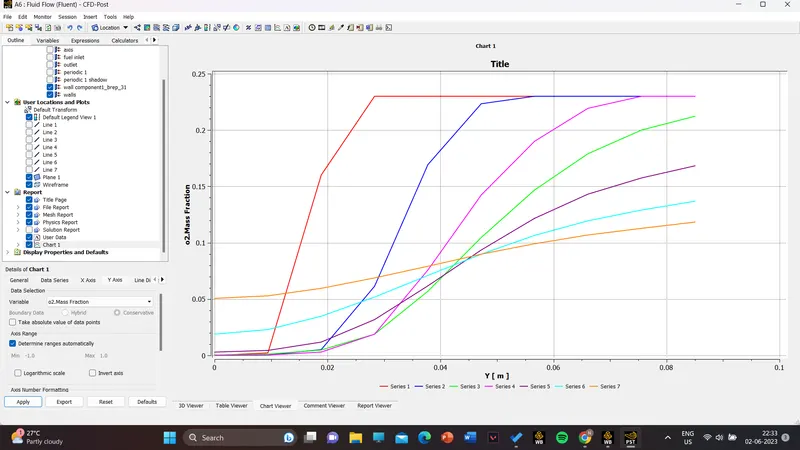
O2 contour and mass fraction plot
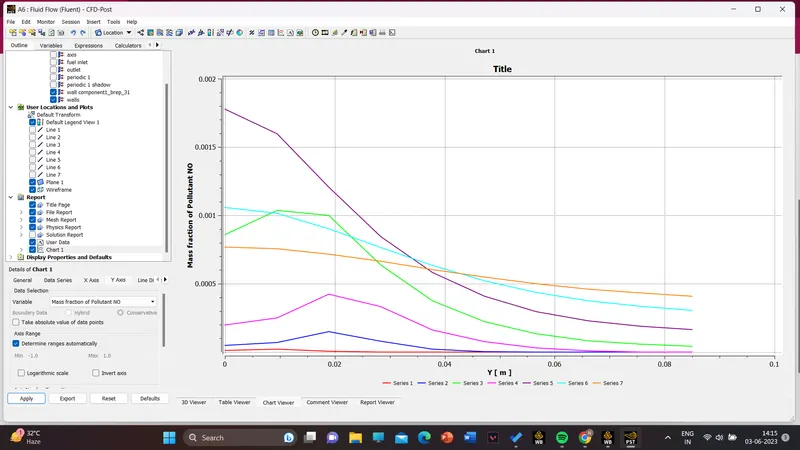
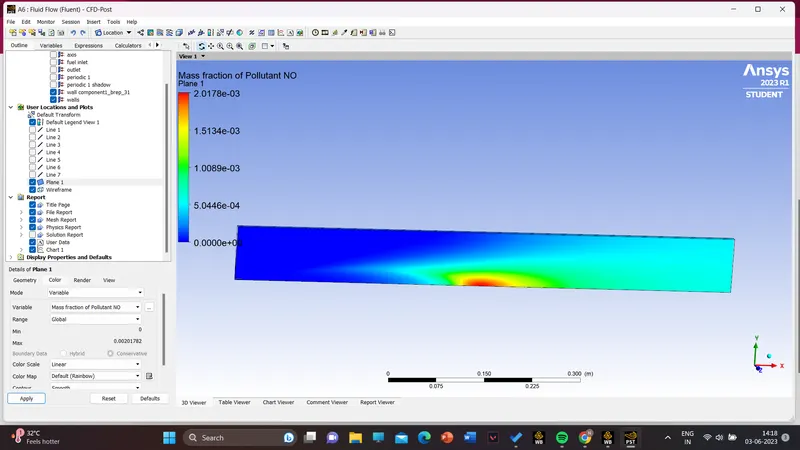
NOX pollutants contour and mass fraction plot
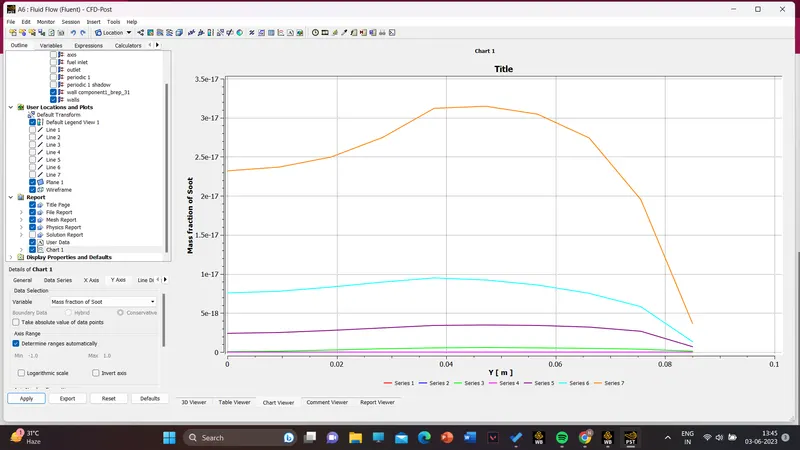
soot formation contour and mass fraction chart
part 2
result for 95% CH4 and 5% water
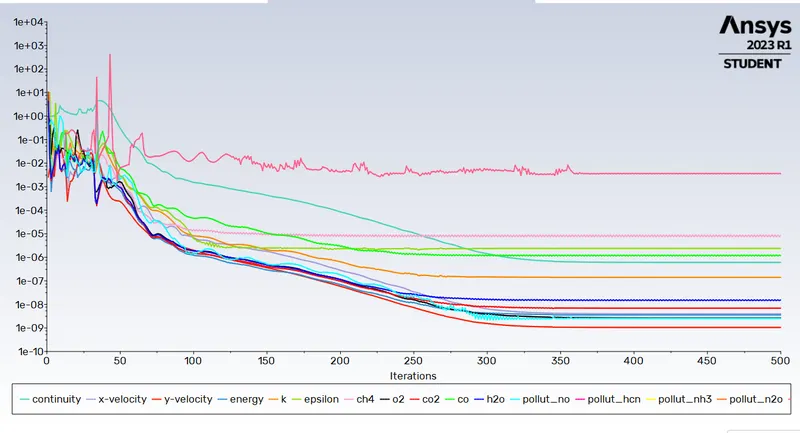
residual
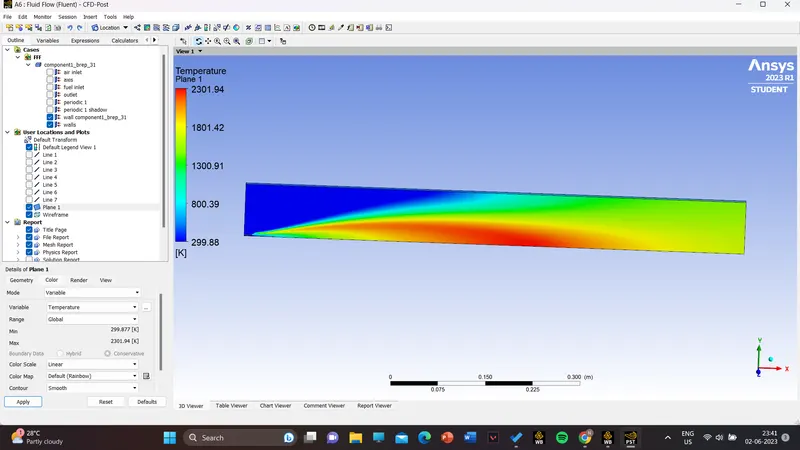
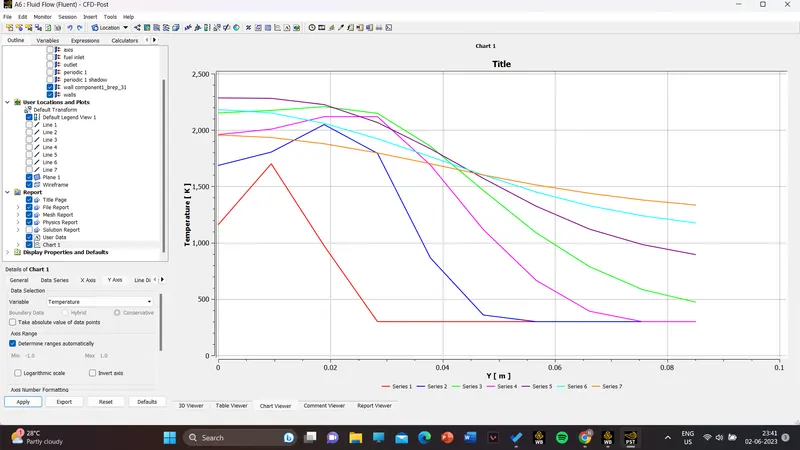
temperature contour and temperature chart
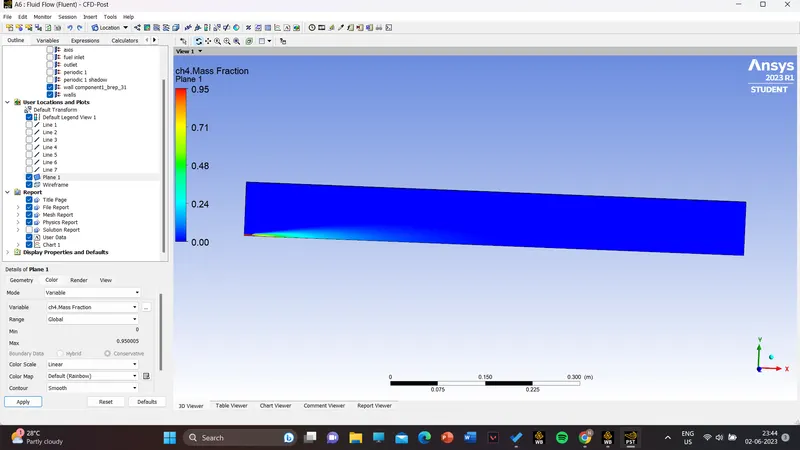
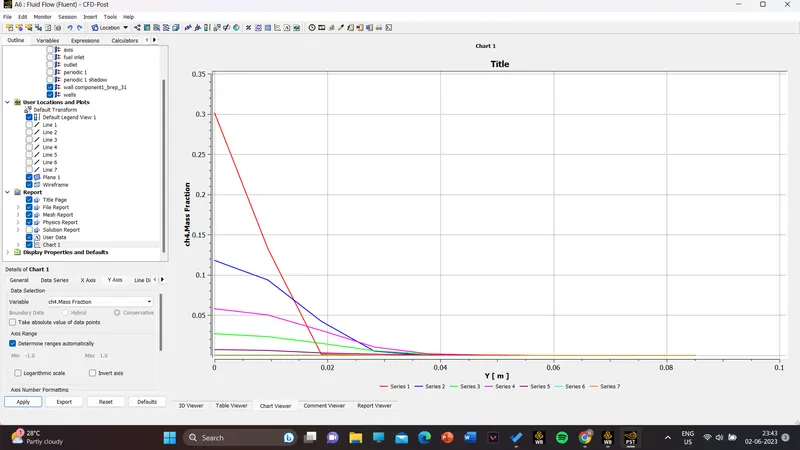
ch4 contour and mass fraction chart
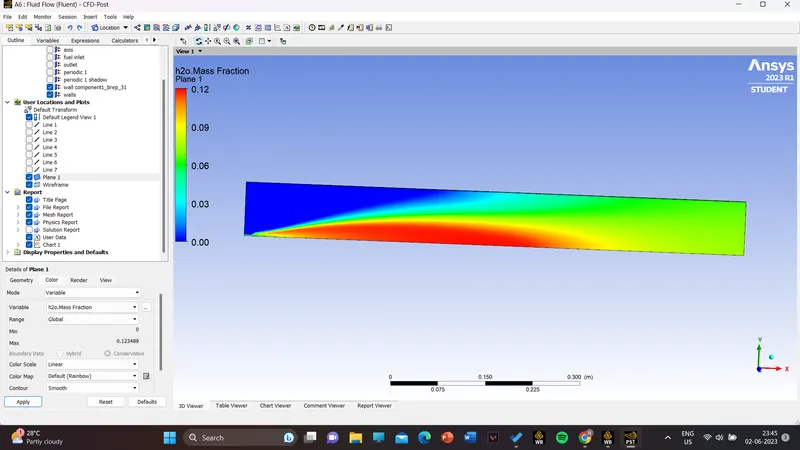
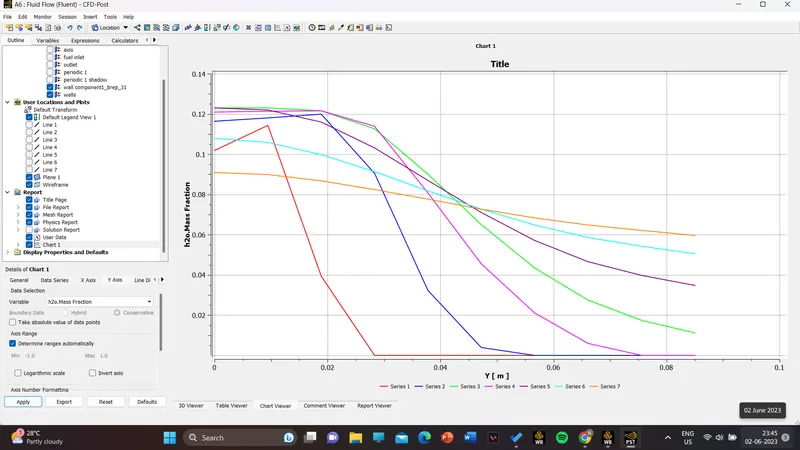
H2O contour and mass fraction chart
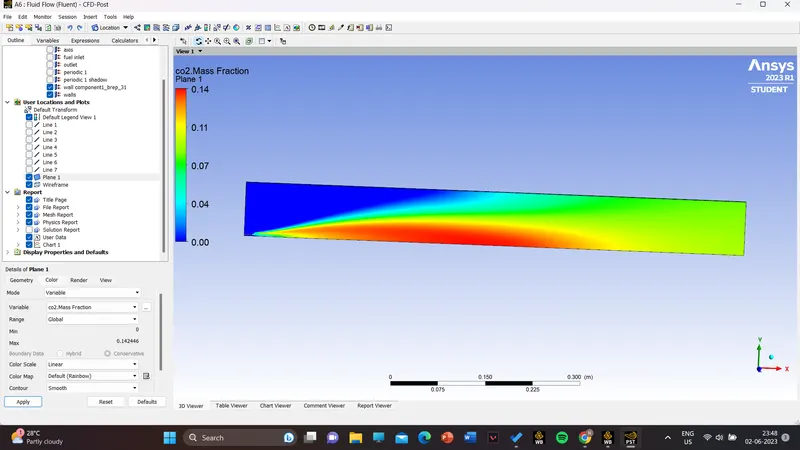
CO2 contour and mass fraction chart
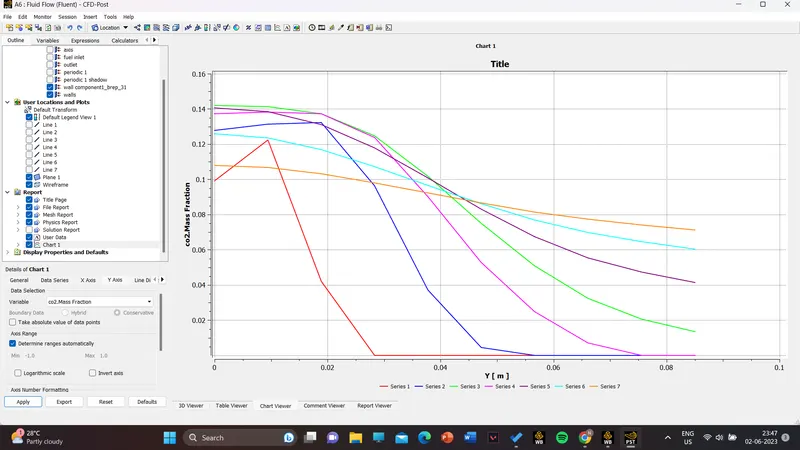
02 contour and mass fraction chart
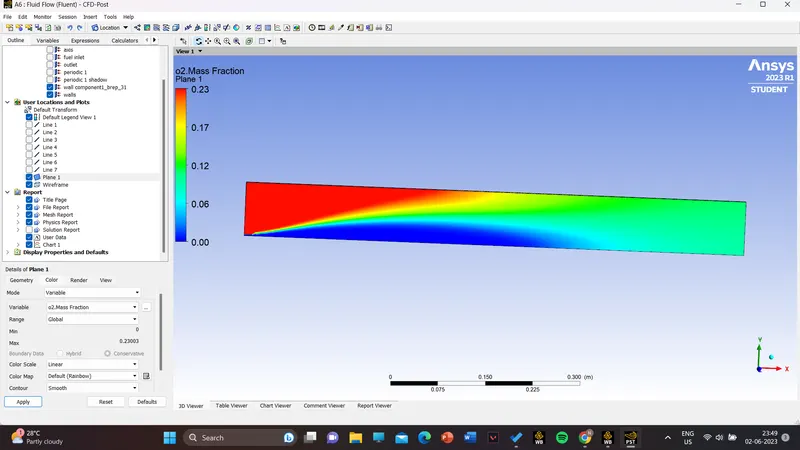
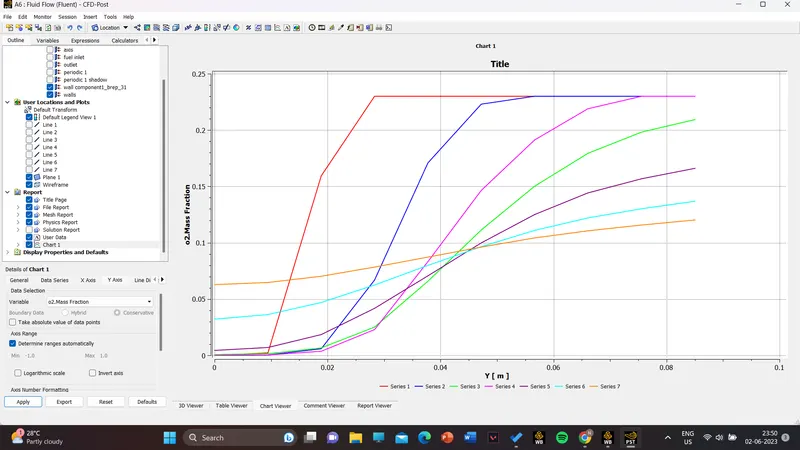
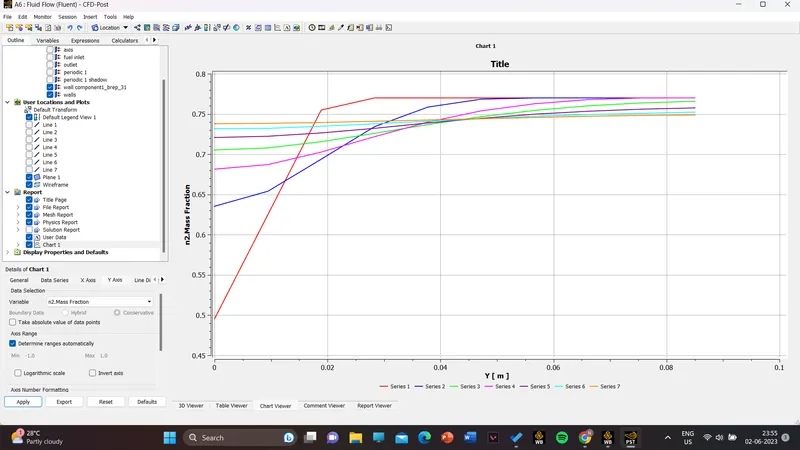
N2 contour and mass fraction chart
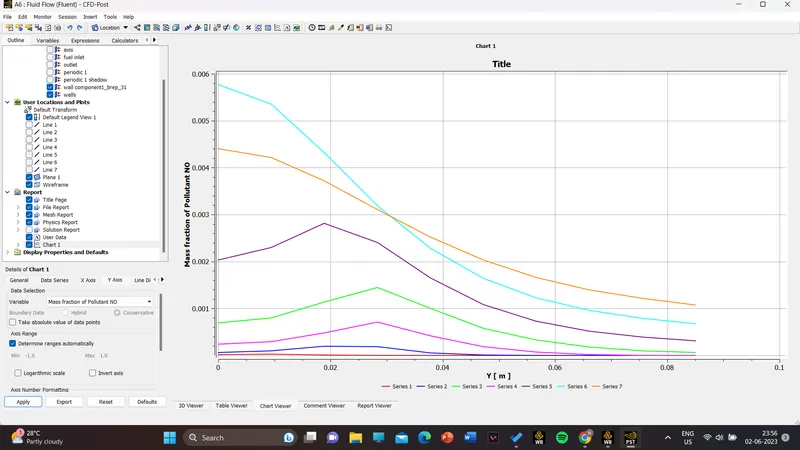
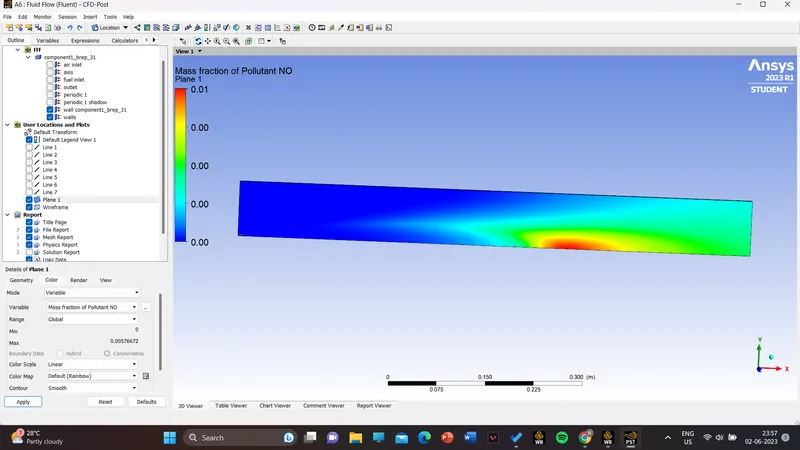
NO pollutants and mass fraction chart
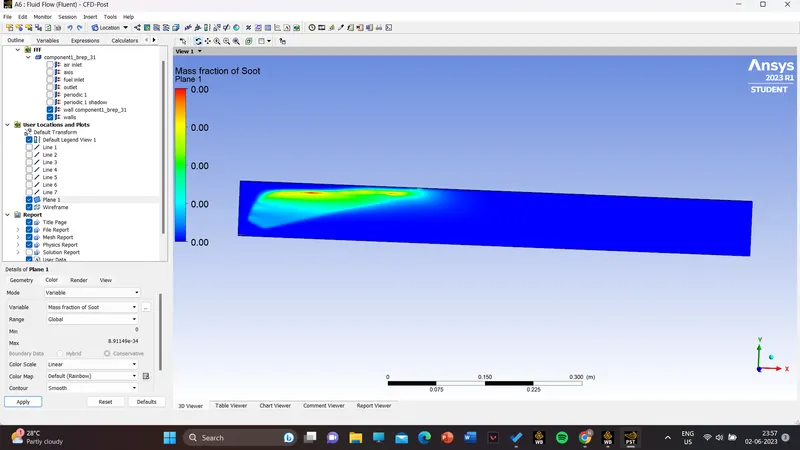
soot formation and mass fraction chart
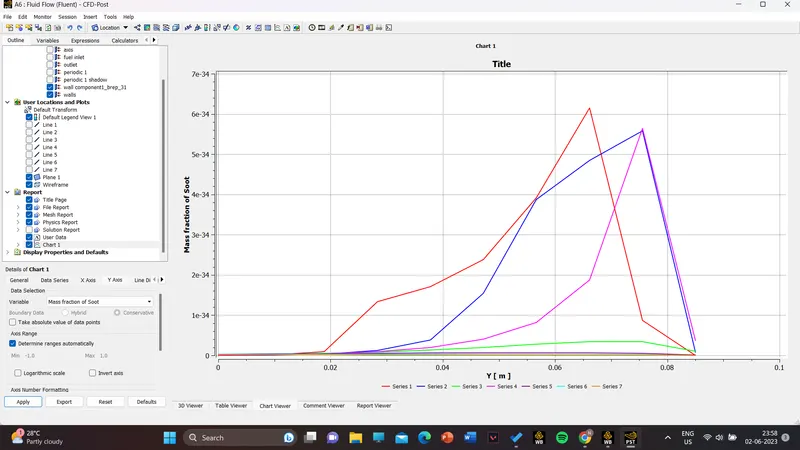
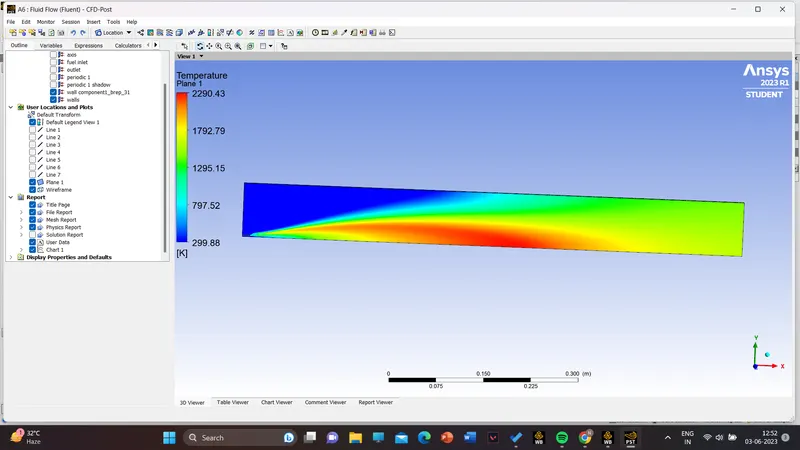
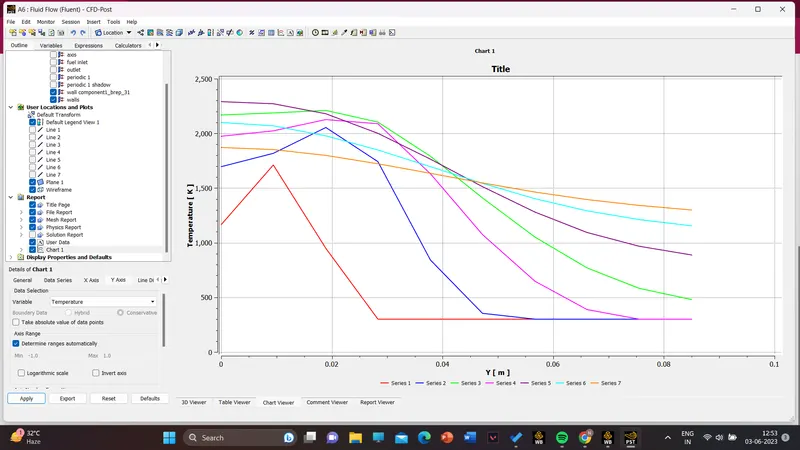
CH4 90% with 10% water
Temperature contour
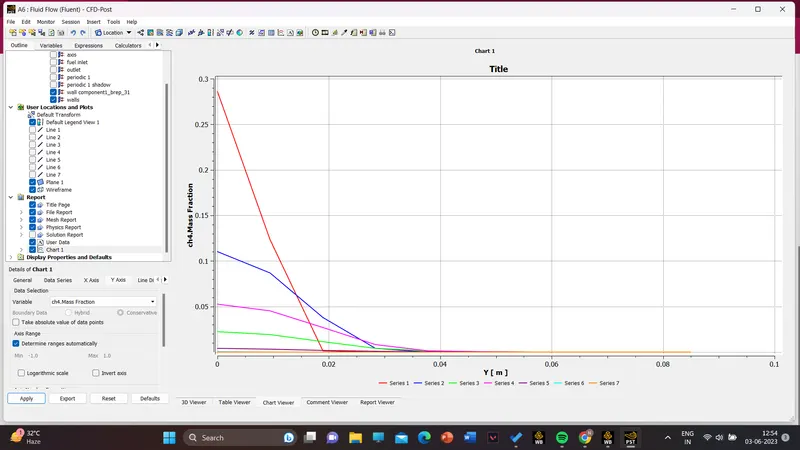
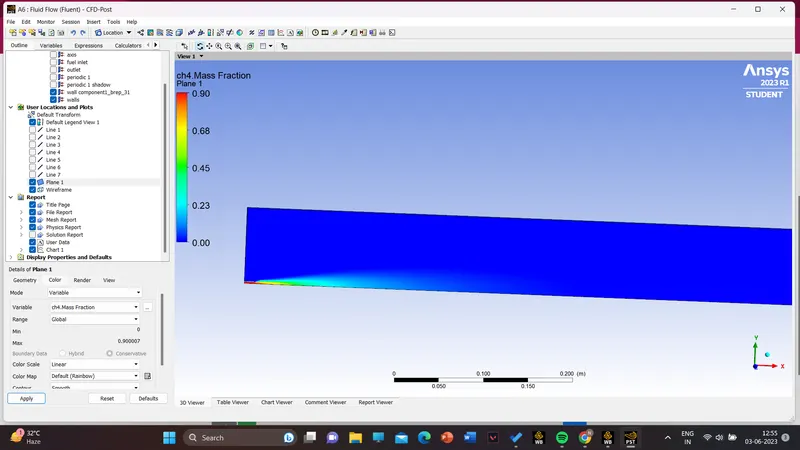
CH4 contour and mass fraction chart
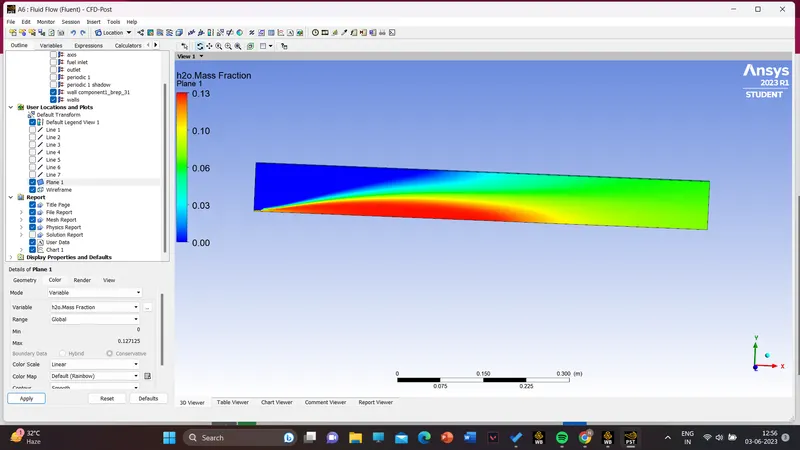
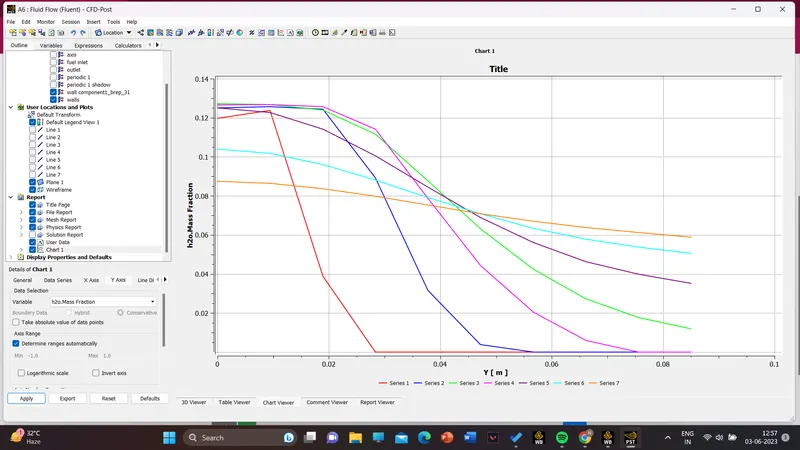
H20 contour and mass fraction chart
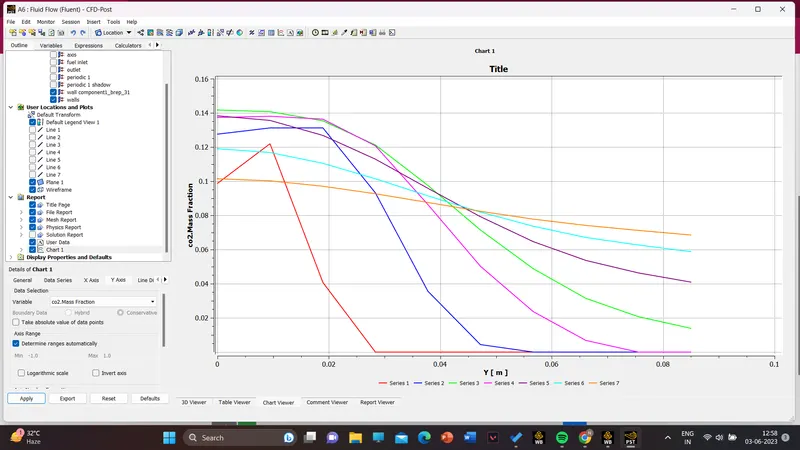
CO2 contour and mass fraction
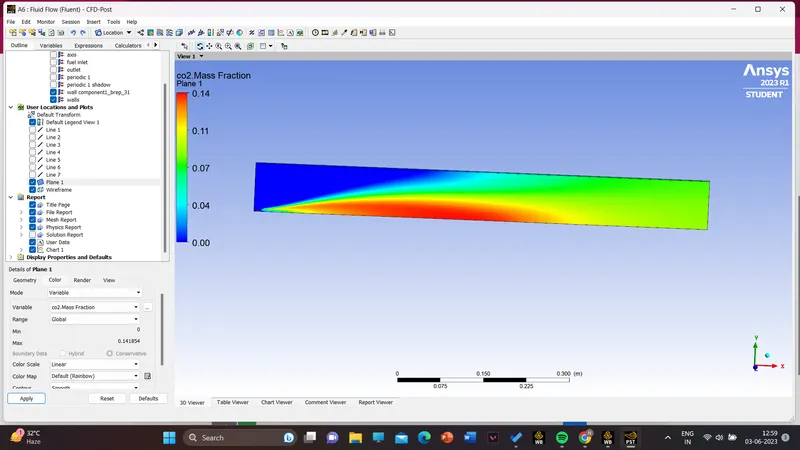
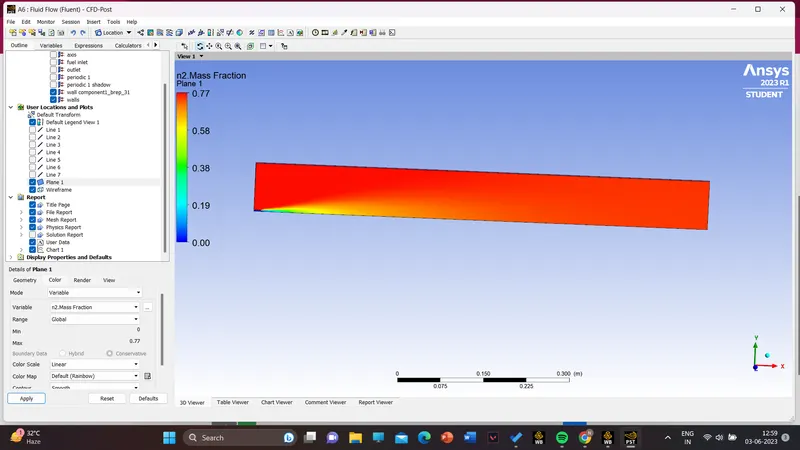
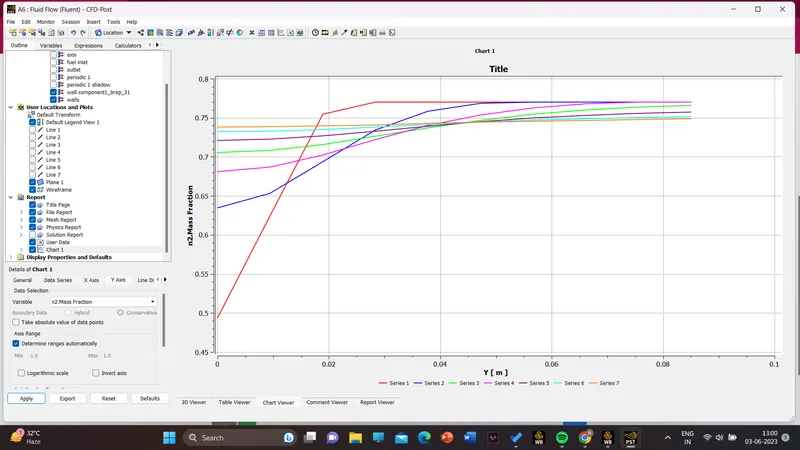
N2 contour and mass fraction chart
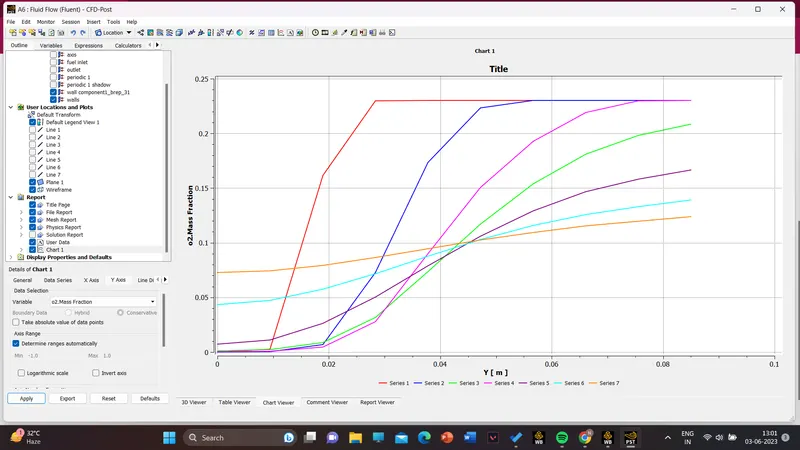
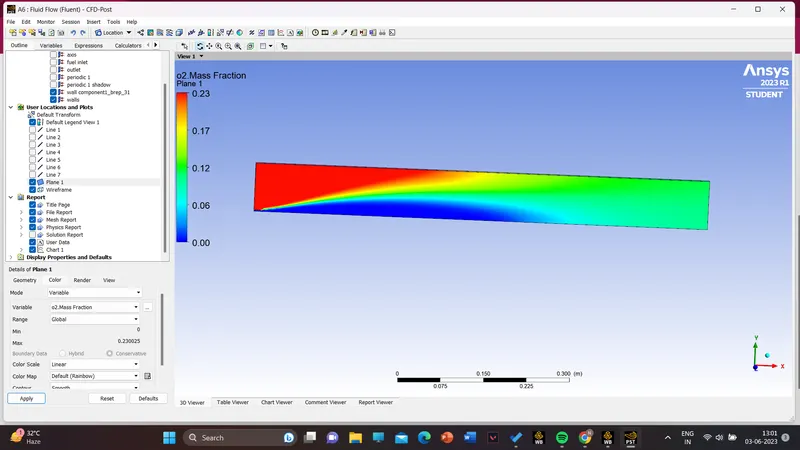
O2 countour and mass fraction chart
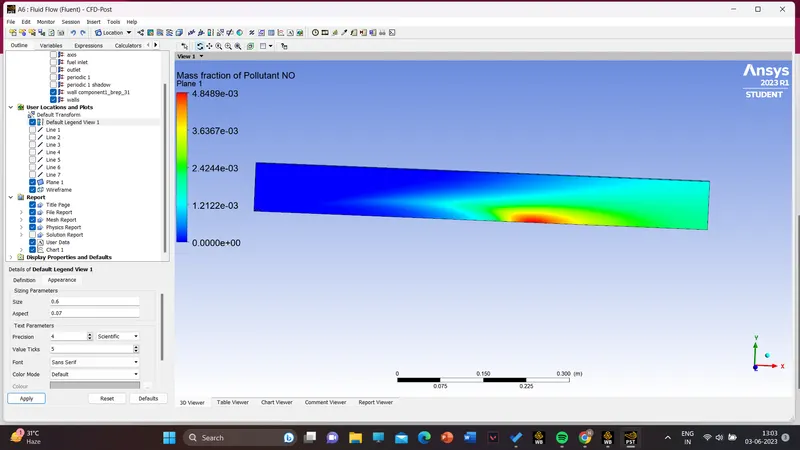
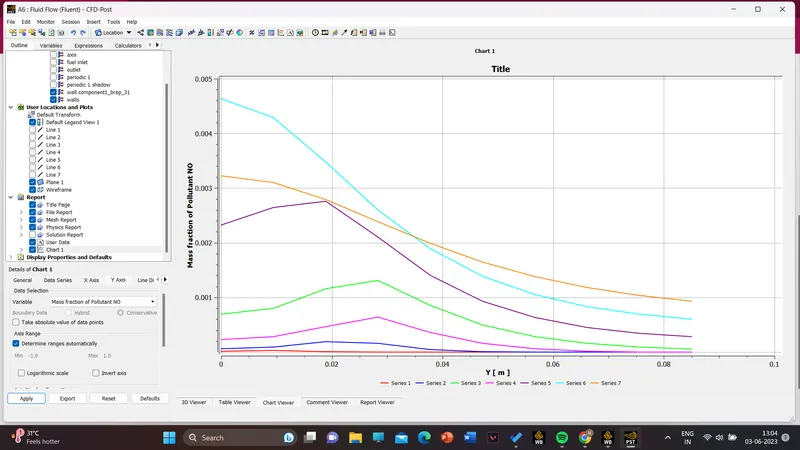
NOX pollutant contour and mass fraction
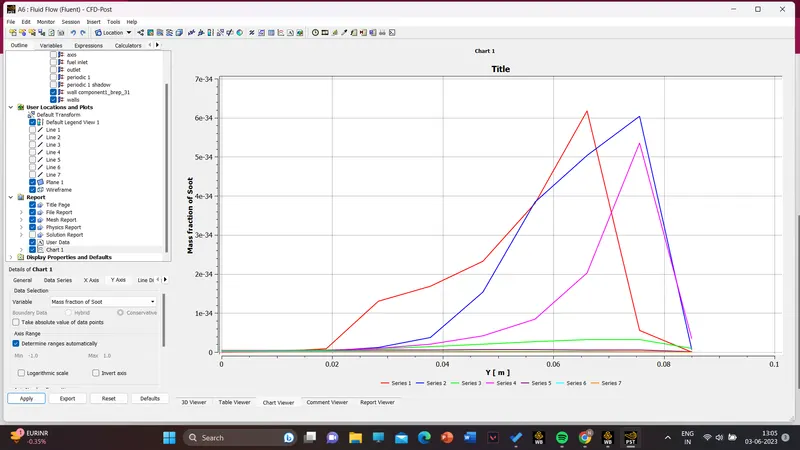
soot formation contour and mass fraction chart
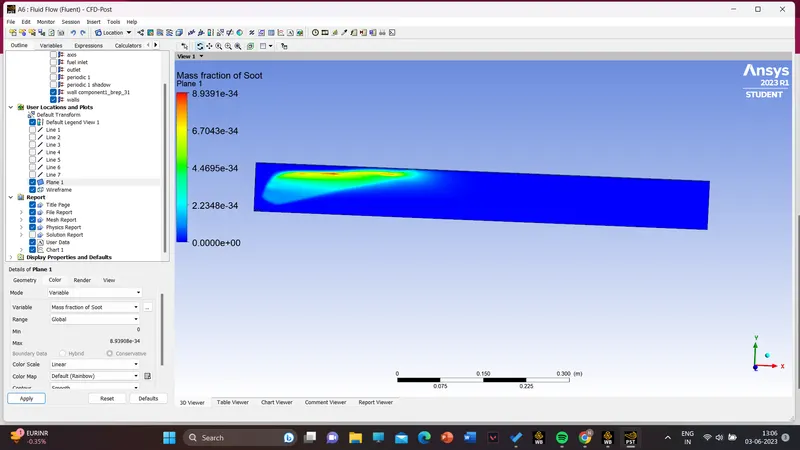
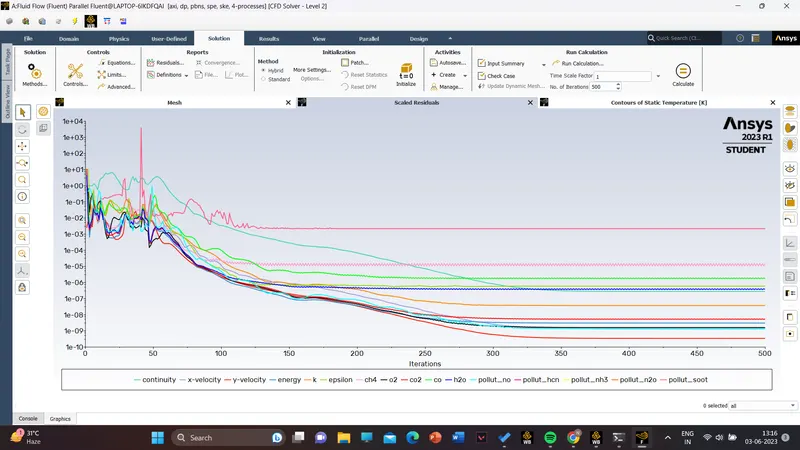
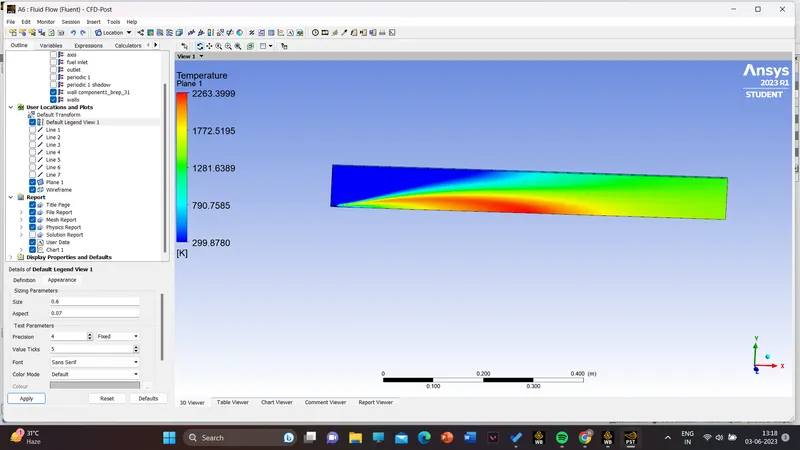
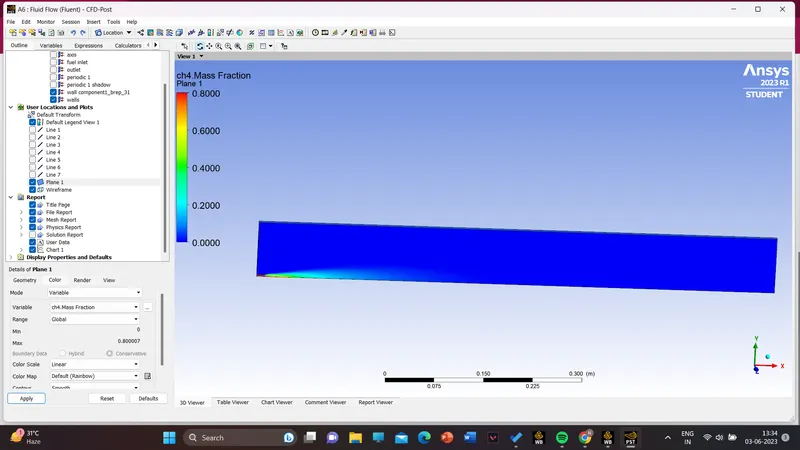
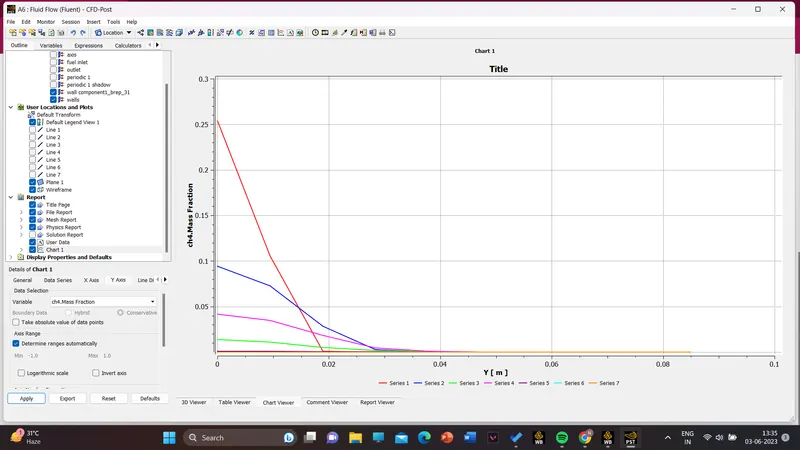
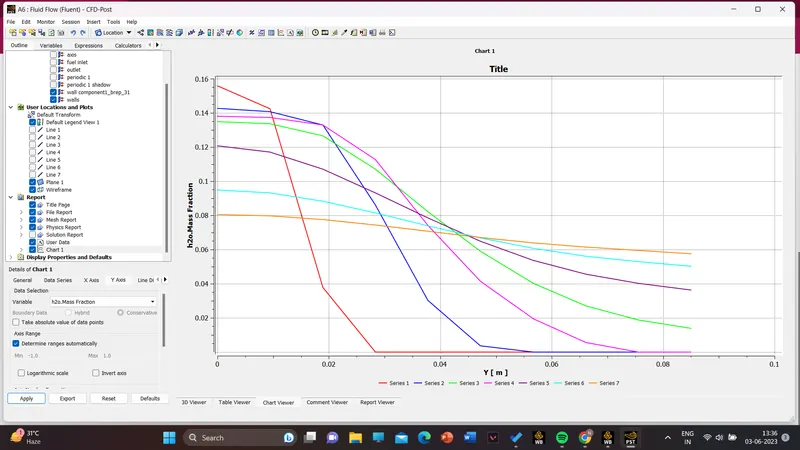
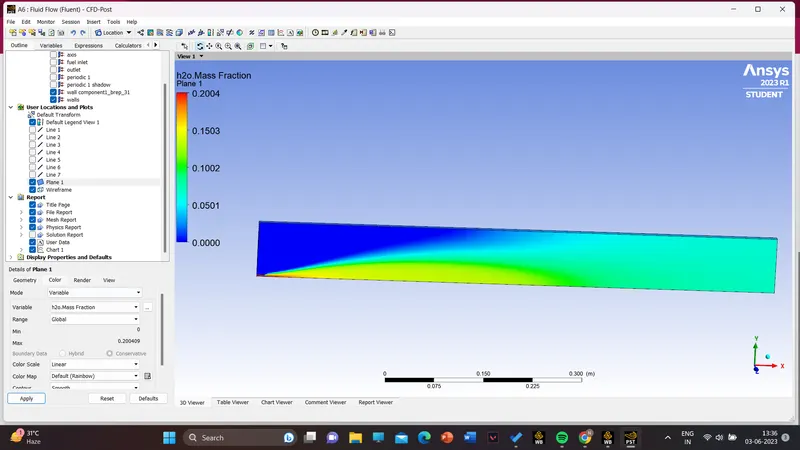
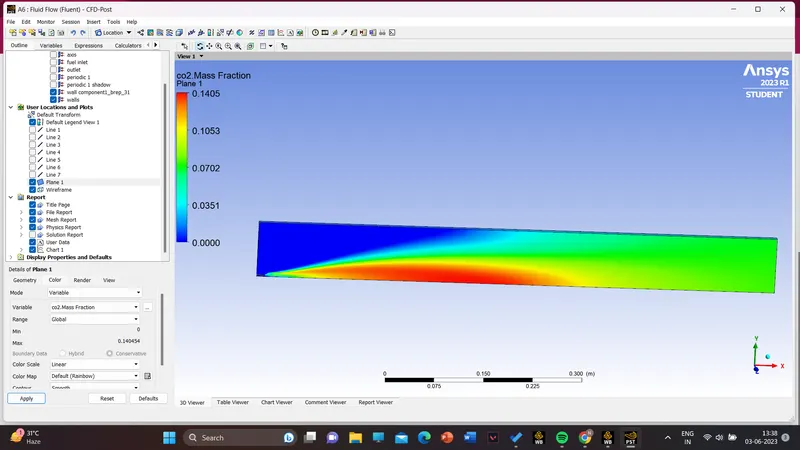
result of 20% water with 80% of CH4
Residual
temperature contour
CH4 contour and mass fraction chart
H20 contour and mass fraction chart
CO2 contour and mass fraction chart
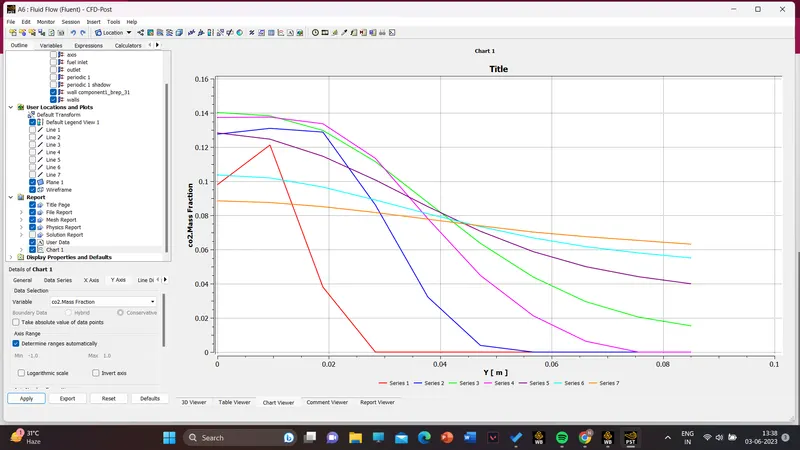
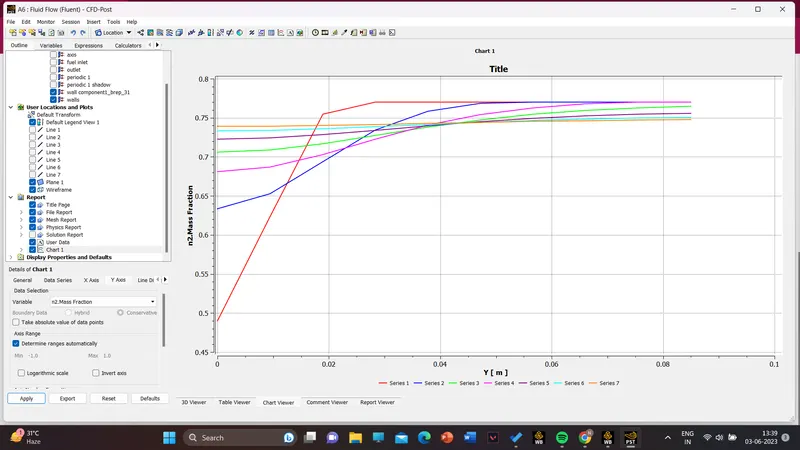
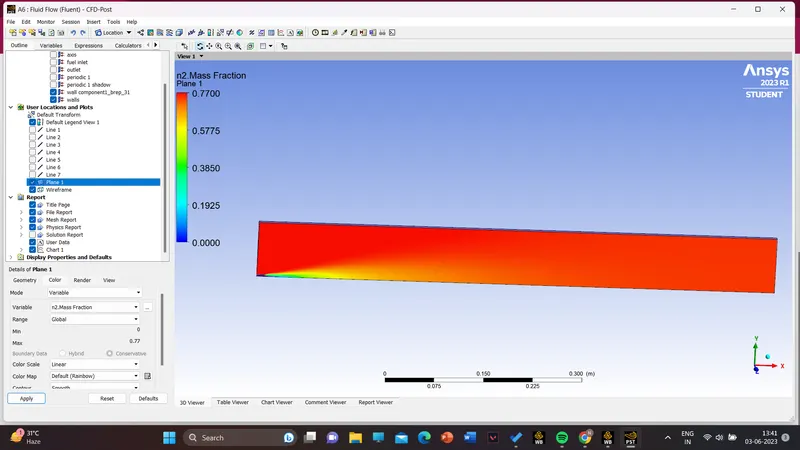
N2 contour and mass fraction chart
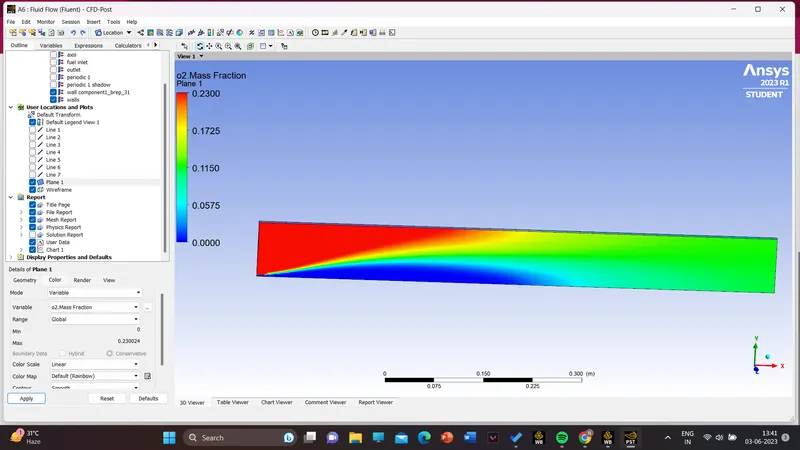
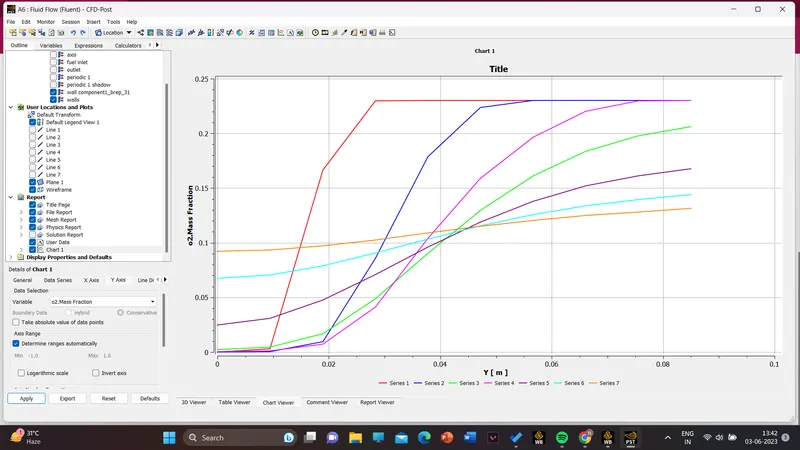
O2 contour and mass fraction chart
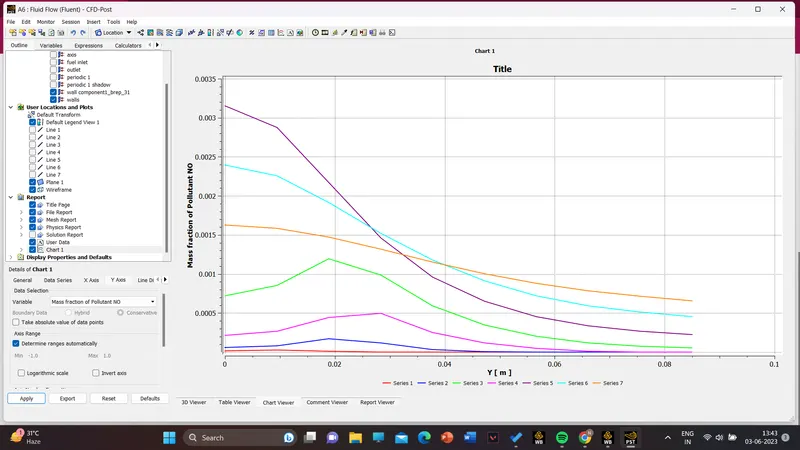
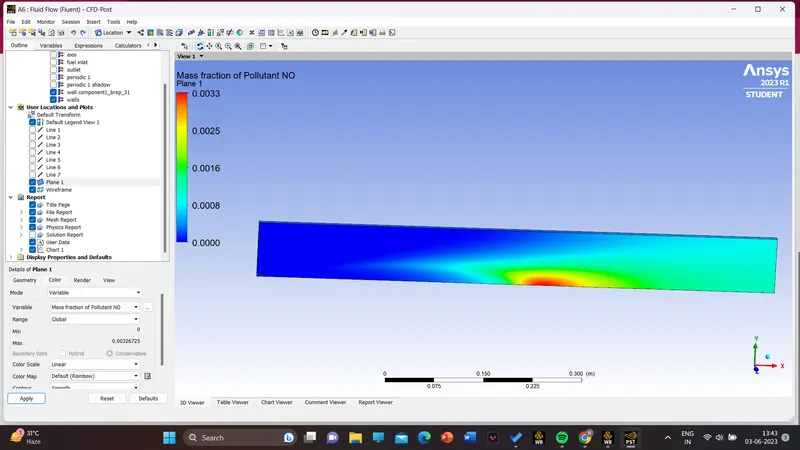
NO pollutant contour and mass fraction chart
soot formation contour and mass fraction chart
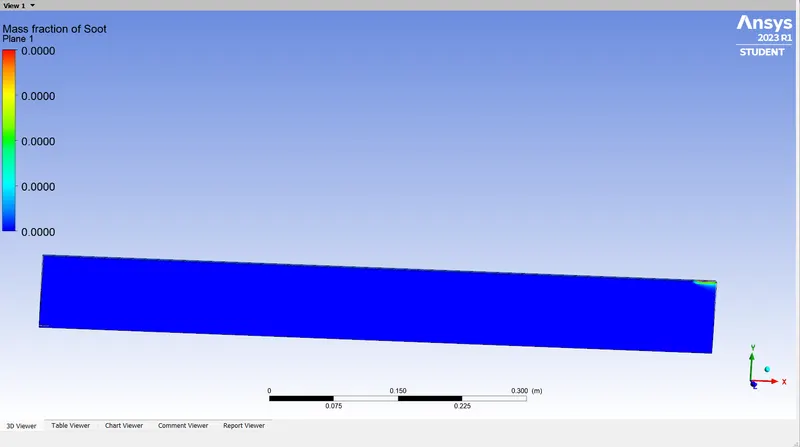
Result
30% water with 70% ch4
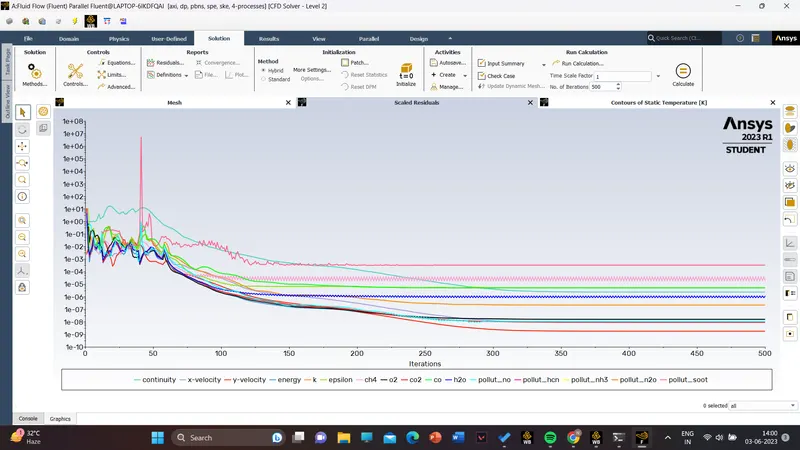
residual
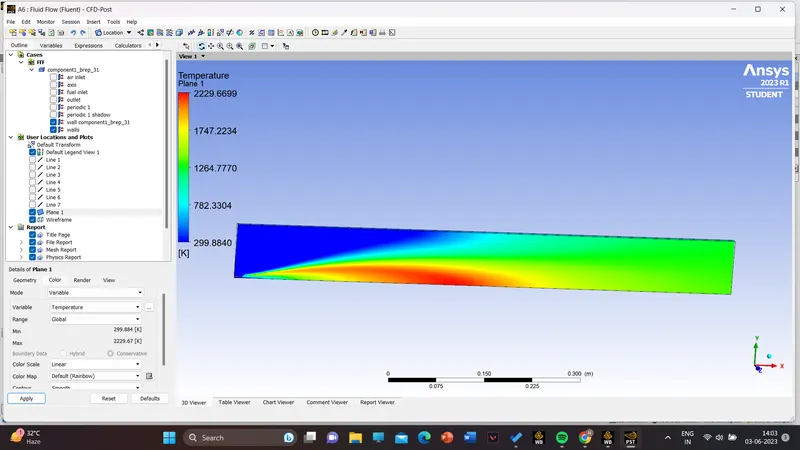
temperature contour
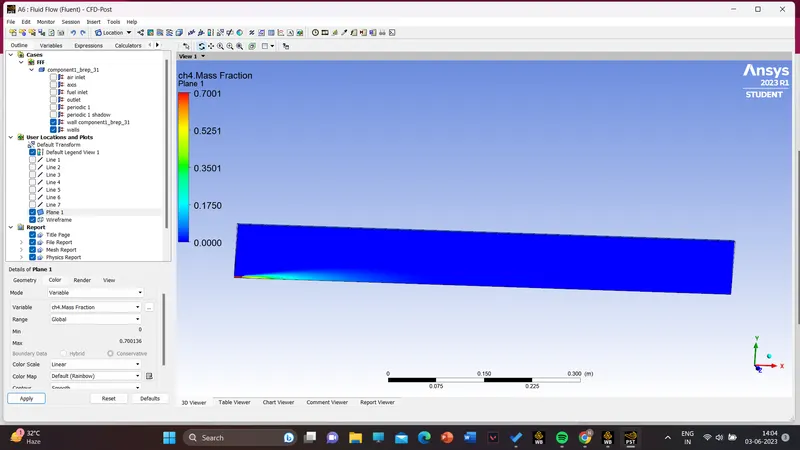
CH4 contour and mass fraction chart
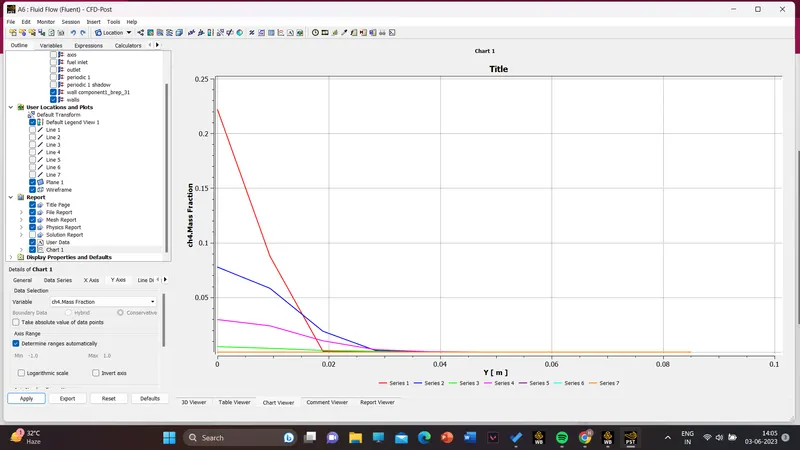
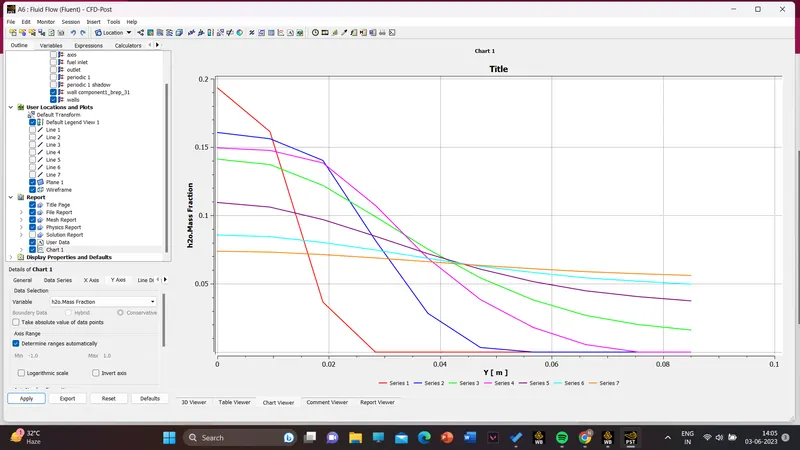
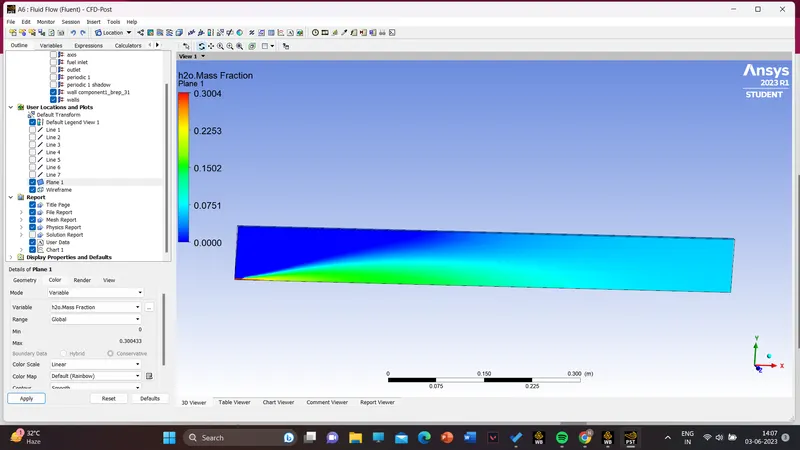
H2O contour and mass fraction chart
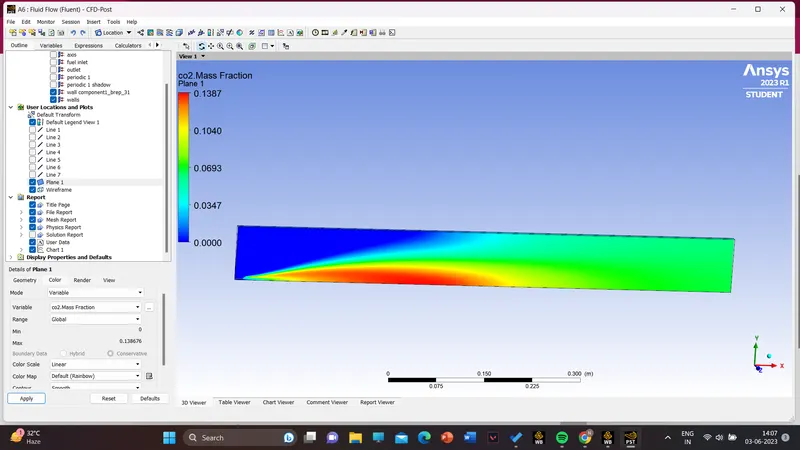
CO2 contour and mss fraction chart
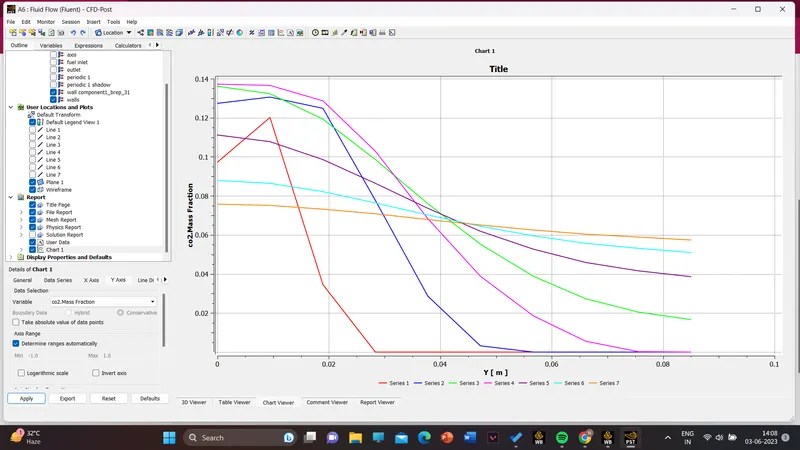
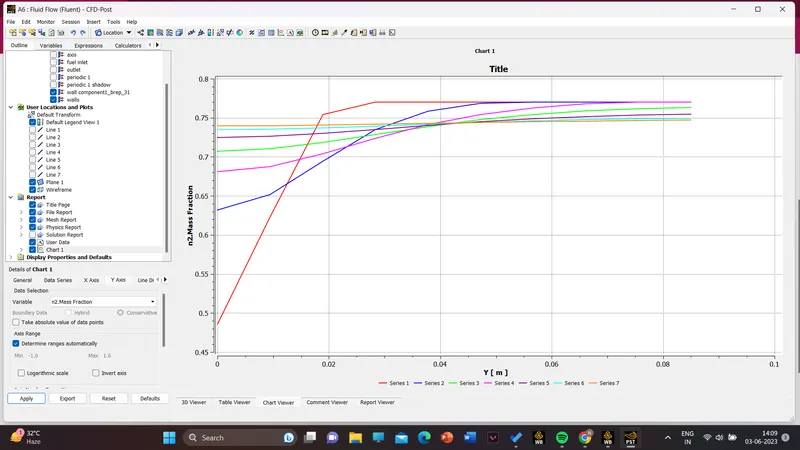
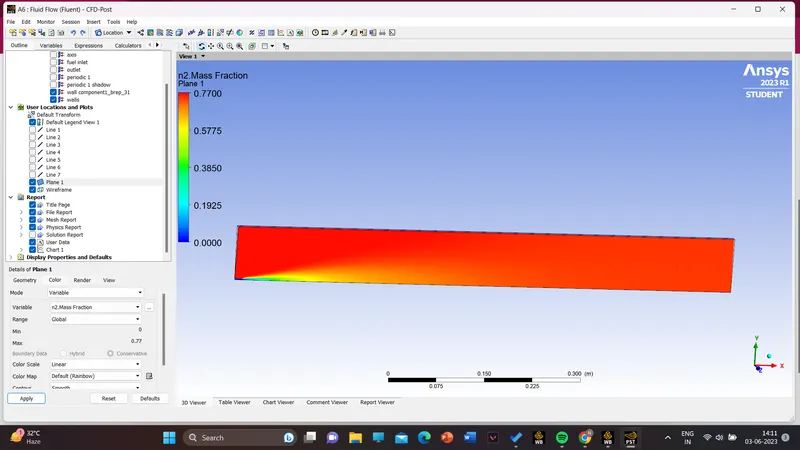
N2 contour and mass fraction chart
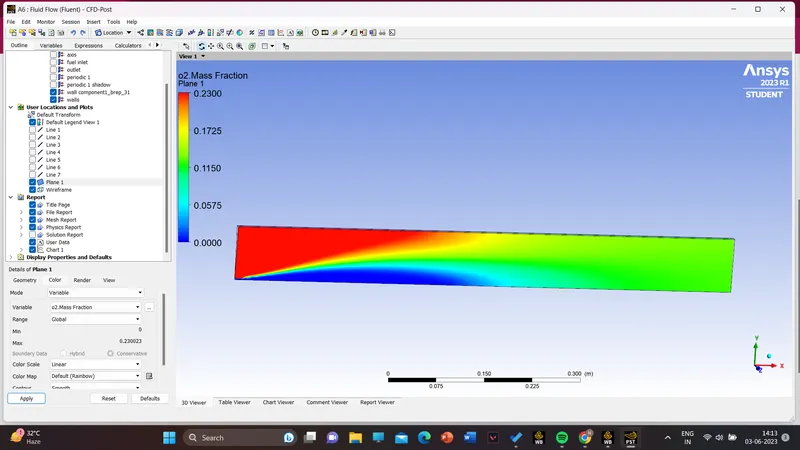
O2 contour and mass fraction chart
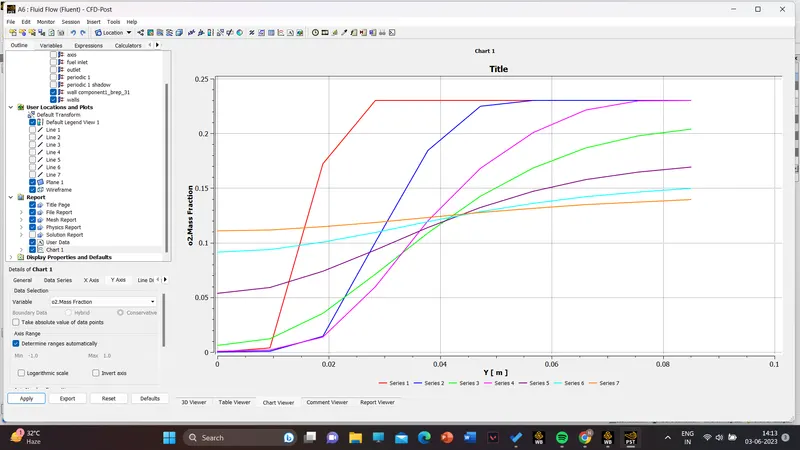
NOX pollutant contour and mass fraction chart
soot formation contour and mass fraction chart
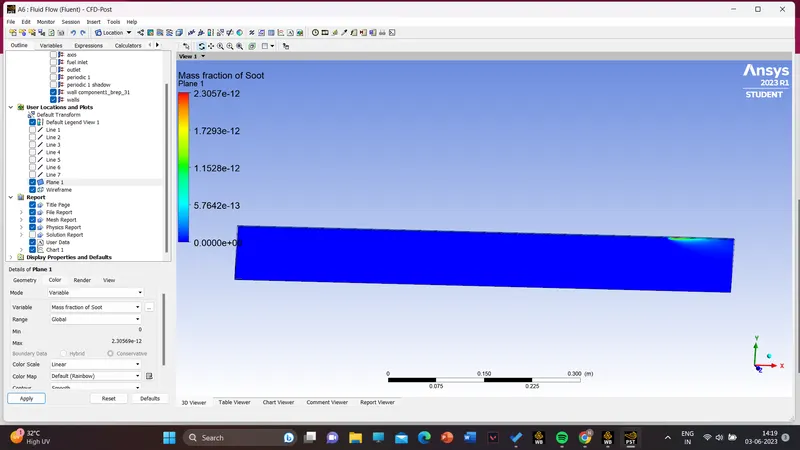
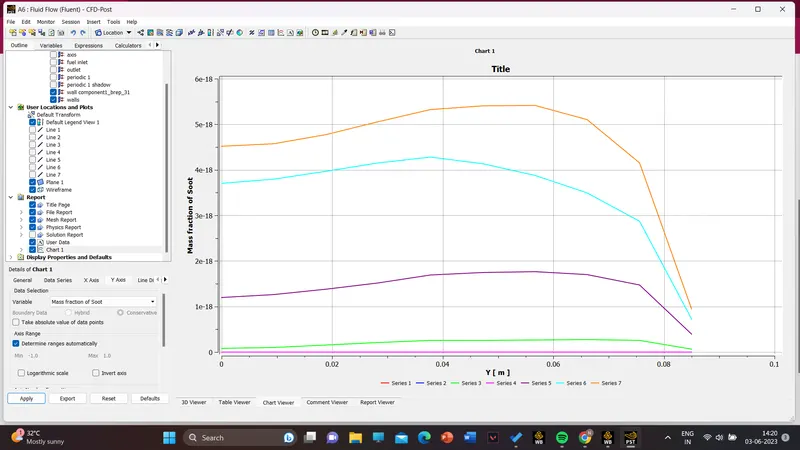
Table of comparison
| sl.no | composition | sum of mass fraction of soot at outlet | sum of mass fraction of NO pollutant at outlet | temperature at outlet (K) |
| 1 | 5% h2o 95% ch4 | 1.81e-35 | .094 | 1570.23 |
| 2 | 10%h2o 90% ch4 | 1.56e-35 | .075 | 1517.66 |
| 3 | 20%h2o 80%ch4 | 1.66-11 | .043 | 1409.06 |
| 4 | 30%h2o 70%ch4 | .023 | .023 | 1295.51 |
Conclusion:
- As per above observations, we can say that addition of water to the fuel helps in decreasing NOx and SOOT Formation.
- Water addition leads to increase OH radicals that might have a significant impact in SOOT Oxidation and reduce the SOOT formed in Gas Phase.
- Added water dilutes calories generatd by combustion. That decreases combustion temperature. If temperature reduces sufficiently, NOx cannot form in great concentration.
- We can see small decrease in temperature. Reducing combustion temperature means avoiding stoichiometric ratio. If this ratio is low, it generates lower concentration of thermal NOx.
- So, with these or various types of technologies, we can reduce NOx emissions and SOOT formation, which helps us to meet regulatory requirements by government. And we can reduce its harmful effects on environment and humans.
So briefly we can conclude that the simulation provides a complete temperature distribution along the geometry. Contours of various species can be studied.By adding water, the pollutant soot and NOx formation at the outlet is reduced. The plots of the same is also looked into.