Week 10 - Simulating Combustion of Natural Gas.
Abstract:
A steady-state combustion simulation of methane with air in a combustor is carried out. The mass fraction of the different species (CO2, H2O, CH4, N2, O2, NOx emissions & Soot) produced during combustion is studied using line probes at different locations of the combustor. A parametric study is done with moles of CH_4 & H_2O as input parameters in ANSYS Workbench. The simulations are carried out with commercially available CFD tool ANSYS® Fluent® 2021 R2 Student version.
Introduction:
A combustor is a component used in gas turbines, scramjet & jet engines for burning fuel. High temperatures are thus a common occurrence inside the combustor and causes dissociation of nitrogen in the air & some fuel species into intermediate species. Certain intermediary reactions produce undesirable products like soot & pollutants (NOx, SOx).
Pollution regulatory norms worldwide cap the emission of pollutants from gas turbines. These norms are bound to get stricter as the environmental impact increases every year. Hence in an attempt to reduce pollutant outflow, water is introduced in fuel (methane) and the effects are studied.
A simple combustor model is considered for this purpose. Methane enters axially through the nozzle at 80 m//s and air at 0.5 m//s from the annular space. Since the geometry & flow in the domain are simple the model is reduced to a 2D axisymmetric representation as shown below.
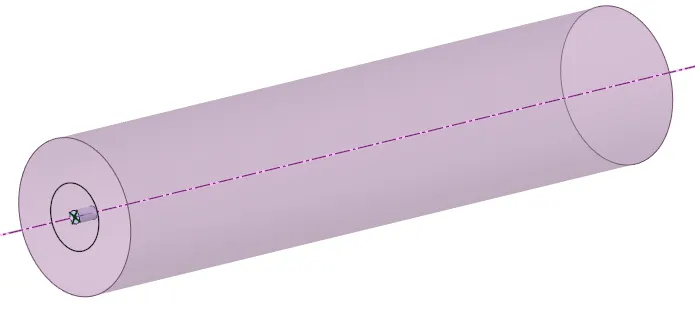
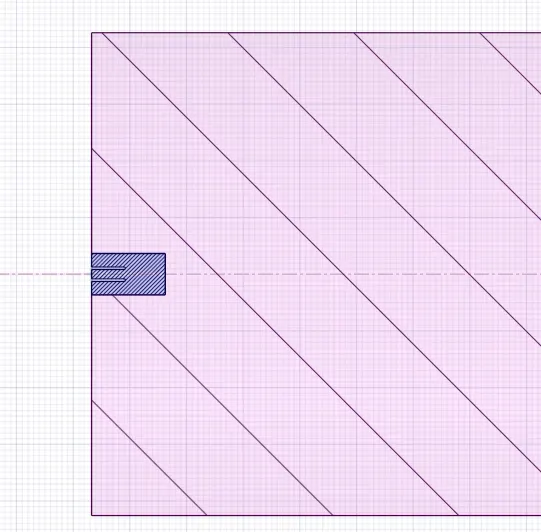
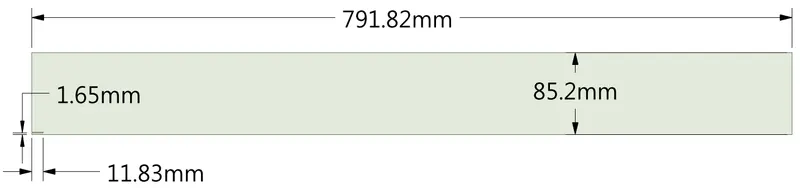
Combustion of methane in air
By mole fraction (i.e., by number of molecules), dry air contains 78.08% nitrogen, 20.95% oxygen, 0.93% argon, 0.04% carbon dioxide, and small amounts of other gases.[1] Air also contains a variable amount of water vapor, on average around 1% at sea level, and 0.4% over the entire atmosphere. Since O2 and N2 are the major components that affect combustion, we can safely ignore trace gases and assume mole fractions in dry air as 0.21 O2 & 0.79 N2 for analytical purposes.
Methane undergoes the following reaction during combustion with 1 mole of O2 in air.
CH4+2(O2+3.762N2)→CO2+2H2O+7.454N2
Mole fractions in air mixture,
O2=2/9.524=0.21
N2=7.524/9.524=0.79
Mole fraction in fuel mixture,
CH4=1/1=1
Computational domain:
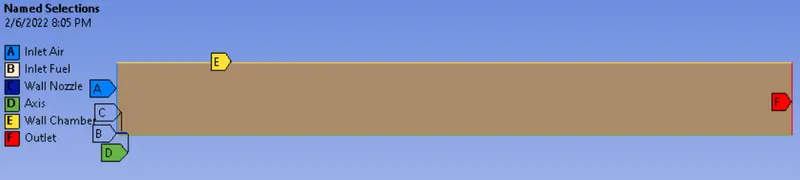
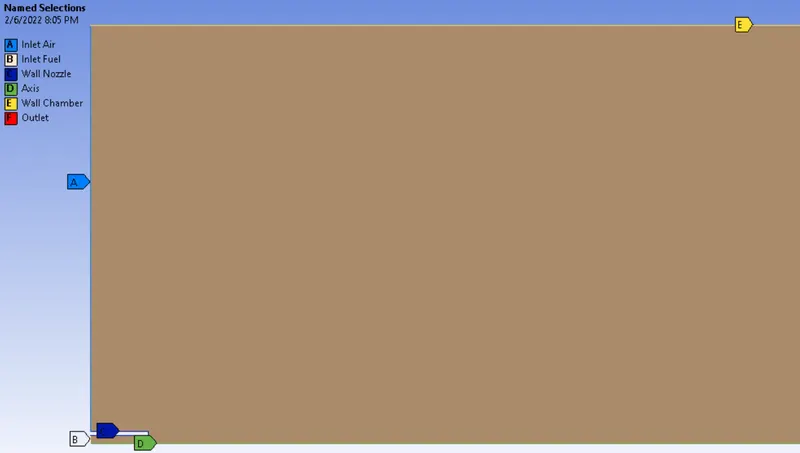
Since the geometry is simple, high-quality quad cells are used. The mesh is fine with an element size of 1.5 mm and 30211 cells. The mesh & mesh settings are as shown below.

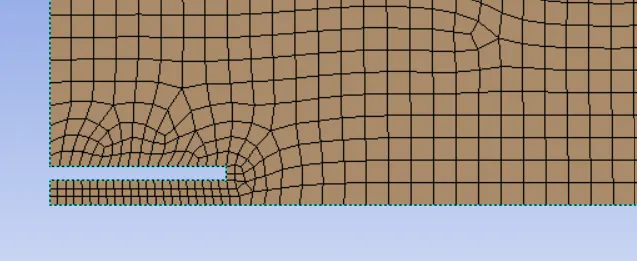
Edges are named so that fluent can apply wall Boundary conditions on these surfaces.
Numerical model:
Turbulence model:
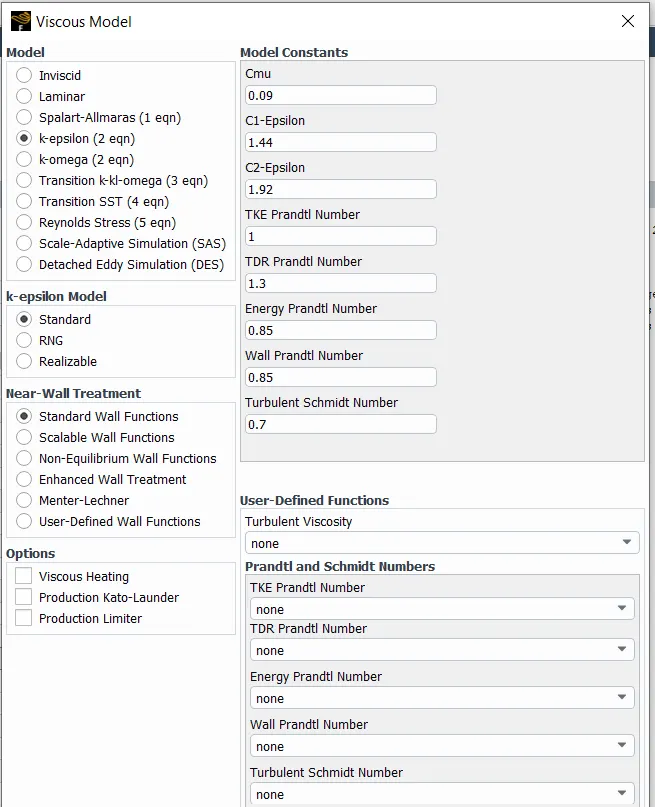
The flow in the domain won’t undergo flow separation and much interaction with adiabatic walls of combustor hence, for reduced computational effort RANS based standard k−ε turbulence model is used with standard wall functions for near-wall modeling.
Species transport model:
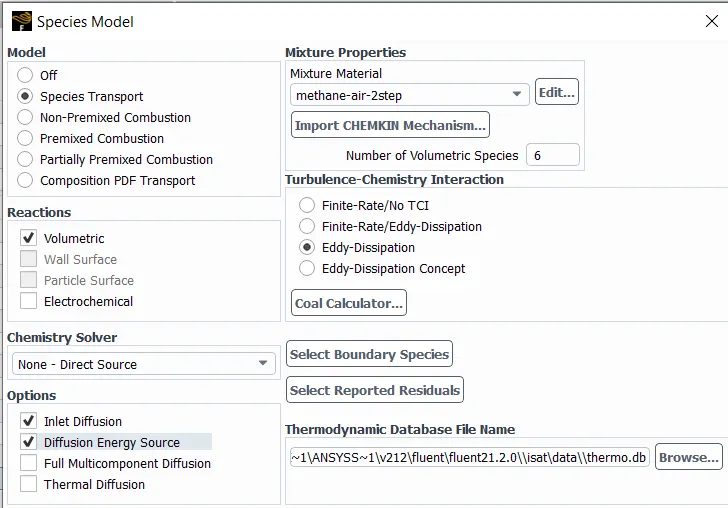
Predefined Methane-air-2step mixture is used for simulating 2 step methane combustion and reactions are set to volumetric since all reactions are in a gaseous state. As ignition delay is not the main concern of this study the Eddy-Dissipation turbulence-chemistry interaction is used with diffusion as an energy source. This reduces the computational effort for solving chemical kinetics.
- Nox model:
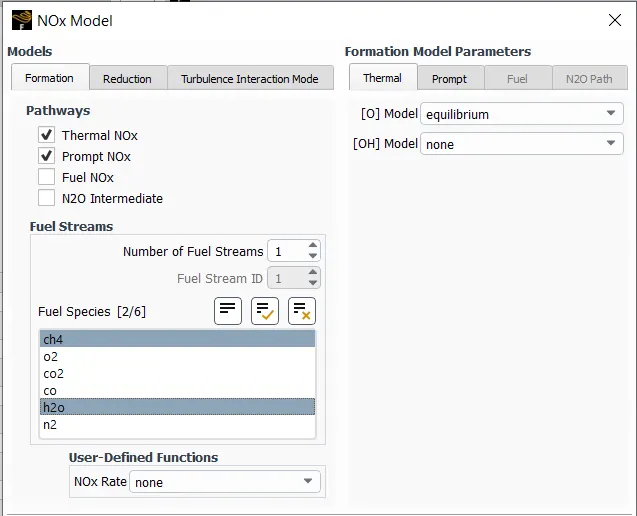
Thermal & prompt NOx pathways are used to compute NOx generation. Since fuel (CH_4) doesn’t contain nitrogen fuel NOx pathway is not needed. Also, the process is high temperature & low pressure so, NOx won’t be generated through intermediate N_2O pathways. - Soot model:
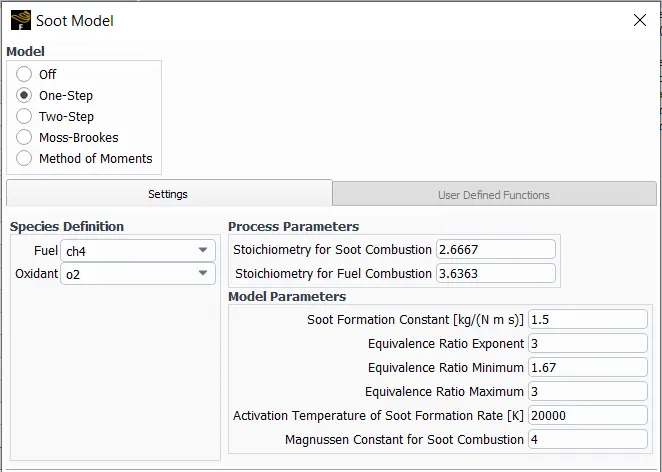
One-step soot model is used for qualitative prediction of soot in the combustor.
Solution method:
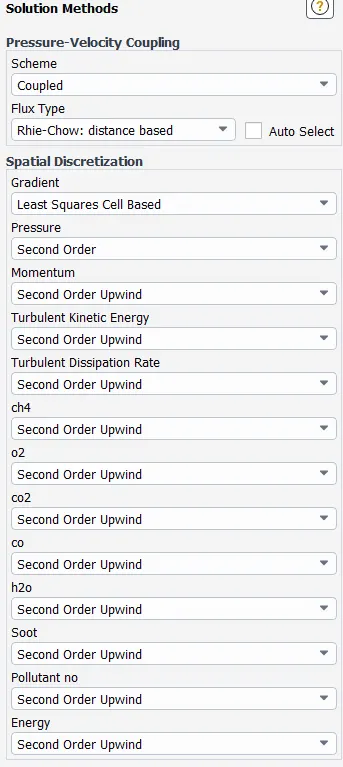
The solution procedure is iterative and is based on coupled scheme for Pressure-Velocity coupling. The discretization is 2nd order for pressure and 2nd order upwind for other variables. The gradient is computed using the Rhie-Chow distance-based method. Commercially available CFD tool ANSYS® Fluent® 2021 R2 Student version is used which has a limit of 512,000 cells in the mesh.
Boundary Conditions:
Explicitly defined boundary conditions are given below rest of the conditions are kept as software defaults.
Solver settings:
- The Mach no. of flow (80/343= 0.23) is less than 0.3 hence steady-state pressure-based solver is used in axisymmetric 2D space.
- Standard k−ε model with standard wall treatment is used for capturing turbulence.
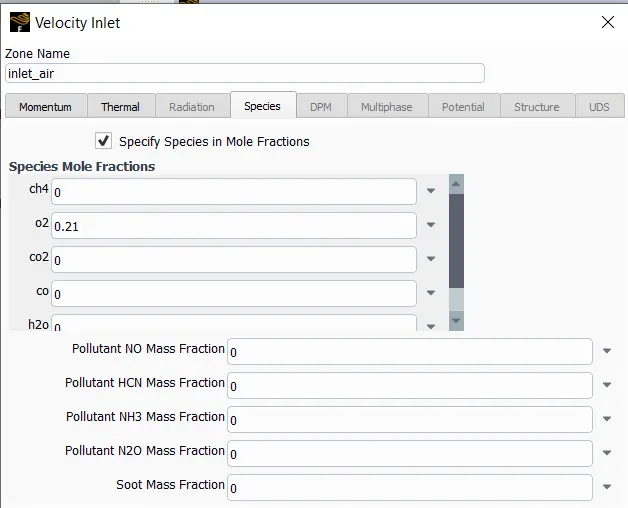
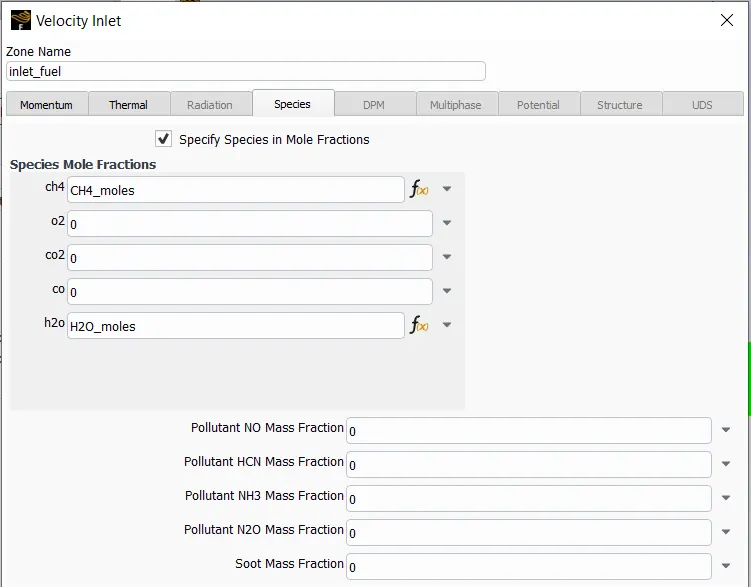
- Mole fractions are set to 0.21 for O_2 at the air inlet. At the fuel inlet, CH_4 & H_2O mole fractions are set as workbench input parameters.
- Air inflows at 0.5 m/s & fuel inflows at 80 m/s.
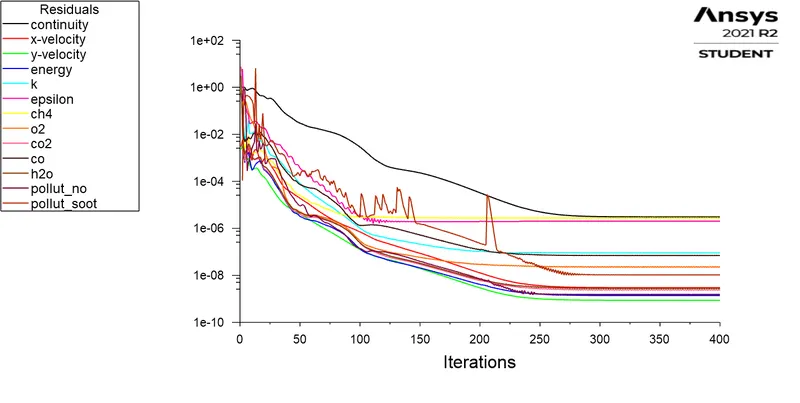
- The simulations were done for 400 iterations after hybrid initialization.
CFD-post output parameters
After the initial simulation, a few expressions were defined in CFD-post and then set as output parameters for the purpose of analysis as shown below.
| Output Parameter | Expression | ||
|---|---|---|---|
| CO Mass fraction at outlet | areaAve(co.Mass Fraction)@outlet | ||
| CO2 Mass fraction at outlet | areaAve(co2.Mass Fraction)@outlet | ||
| NO Mass fraction at outlet | areaAve(Mass fraction of Pollutant NO)@outlet | ||
| Soot Mass fraction at outlet | areaAve(Mass fraction of Soot)@outlet | ||
| Max. Temperature [K] | maxVal(Temperature)@fff_surface |
PART I
Results:
Convergence plots
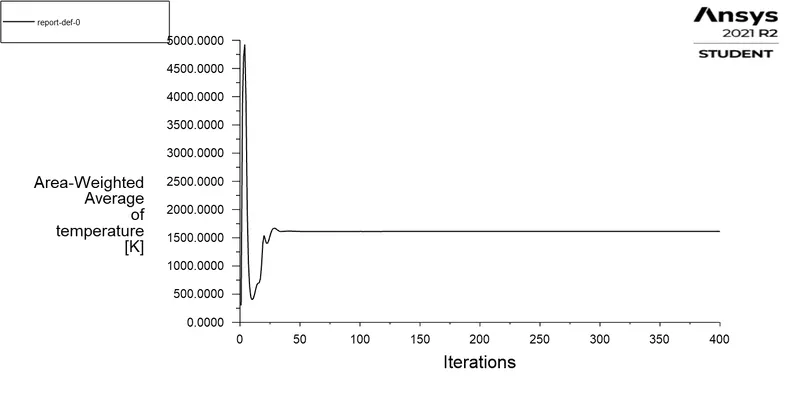
The residual for the case with no water addition is shown below. It can be seen that the area-weighted average temperature at the outlet converges after about 40 iterations and residuals stop dropping after around 300 iterations hence all simulations were carried out for 400 iterations.
Contours
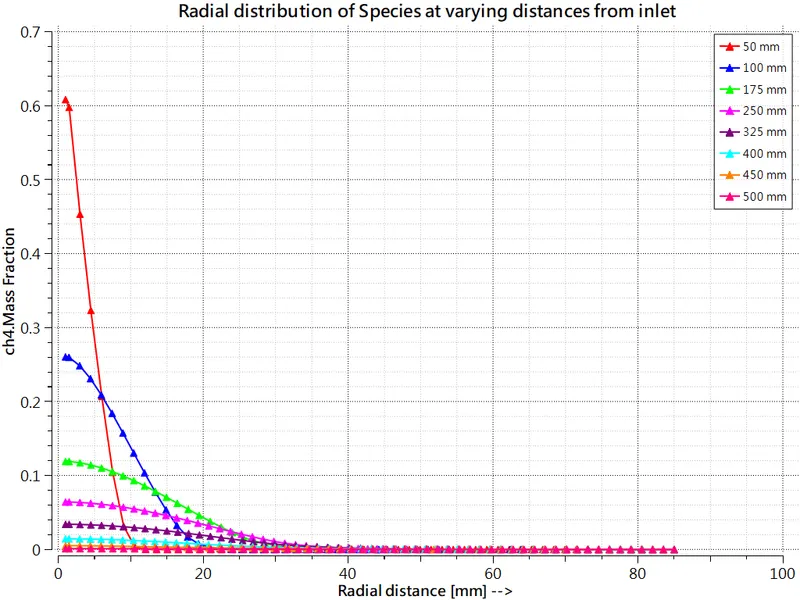
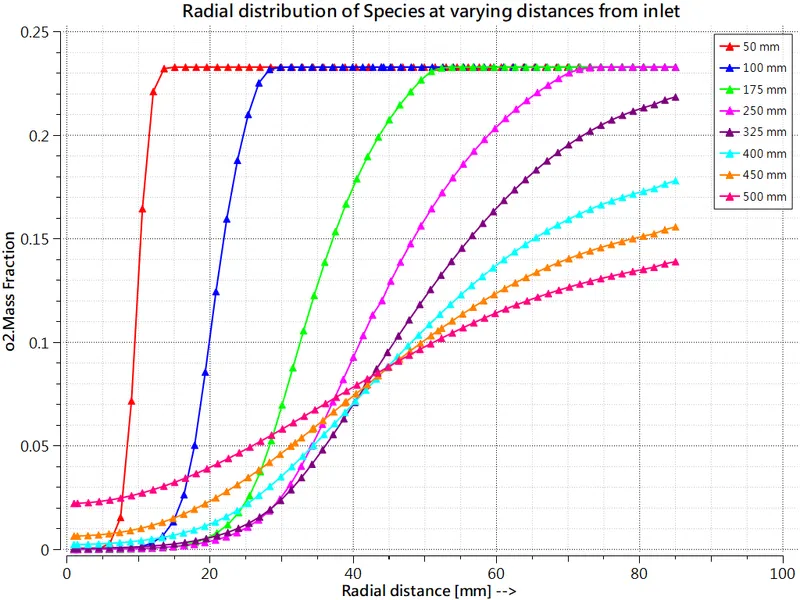
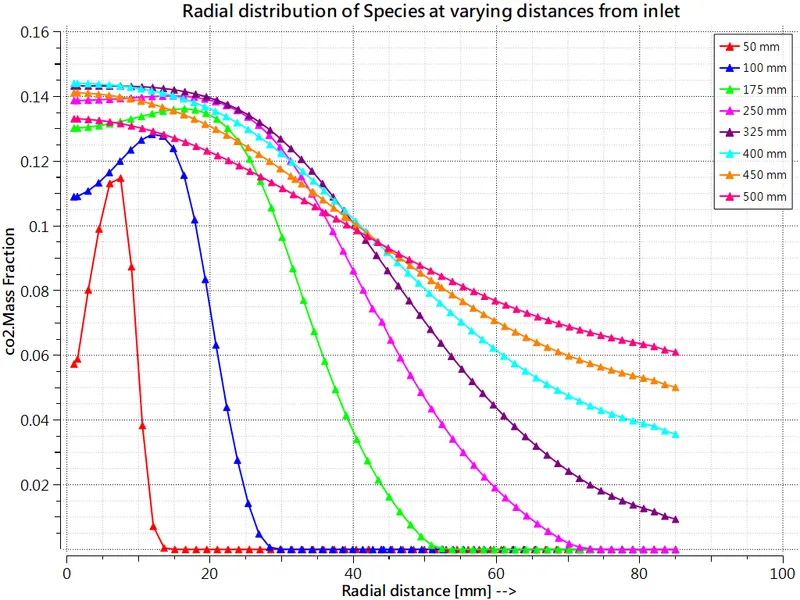
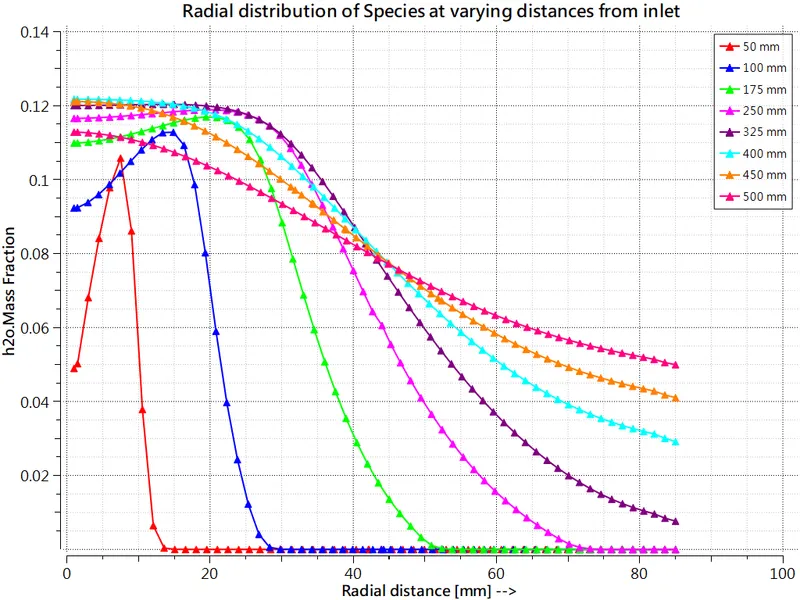
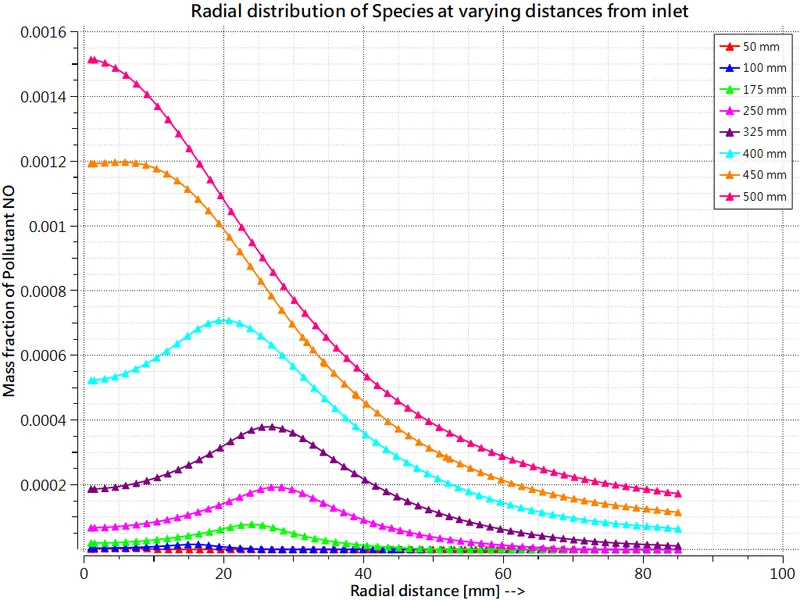
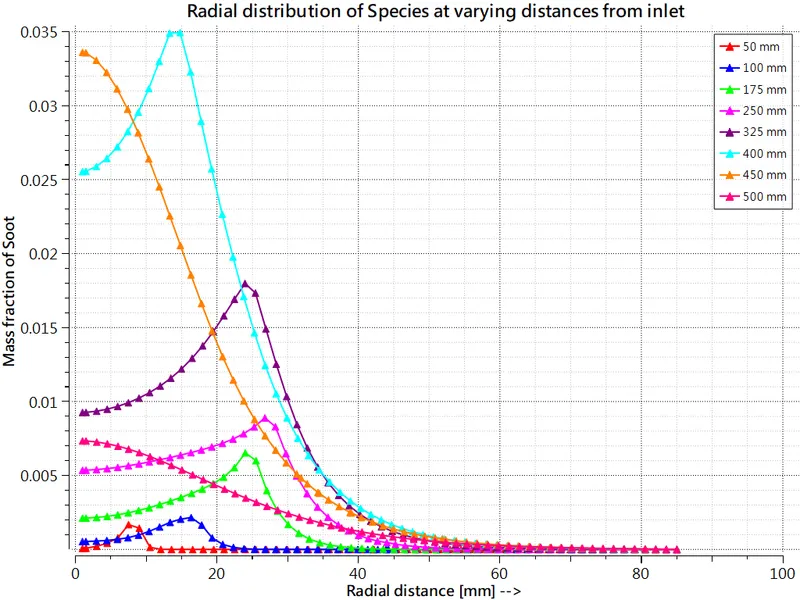
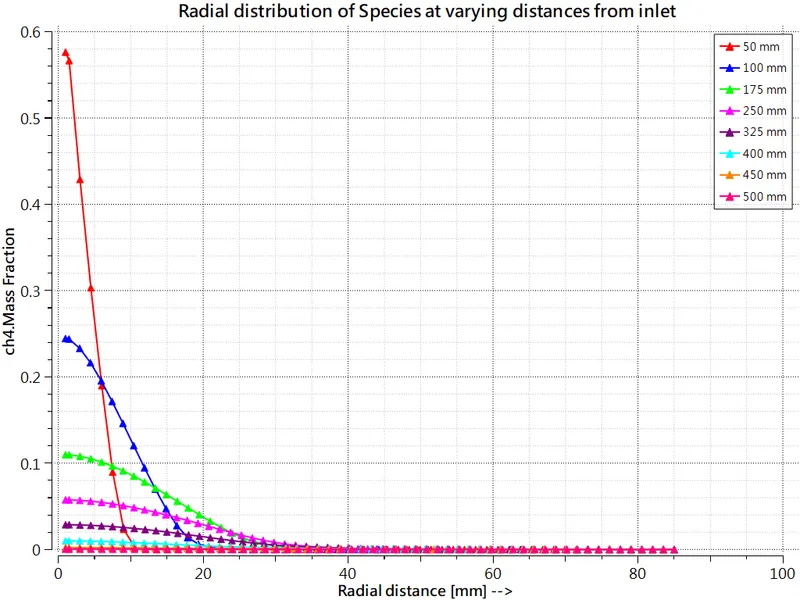
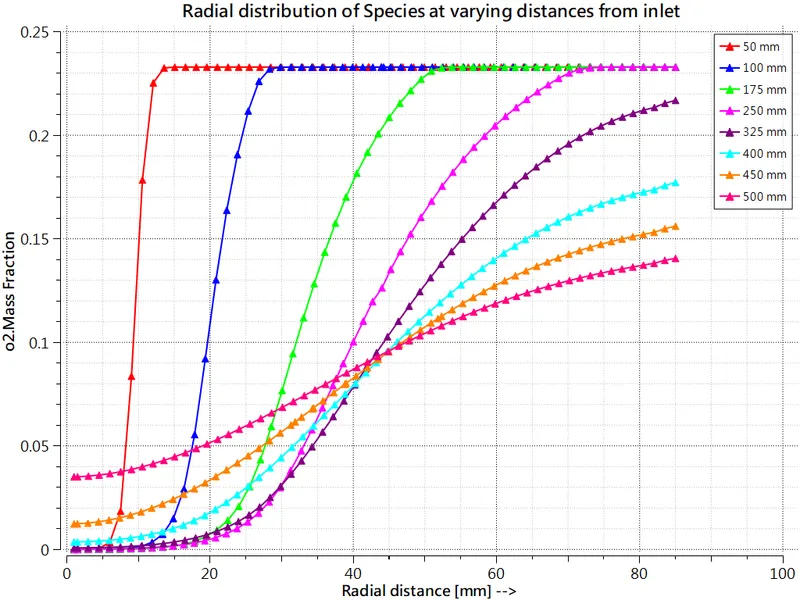
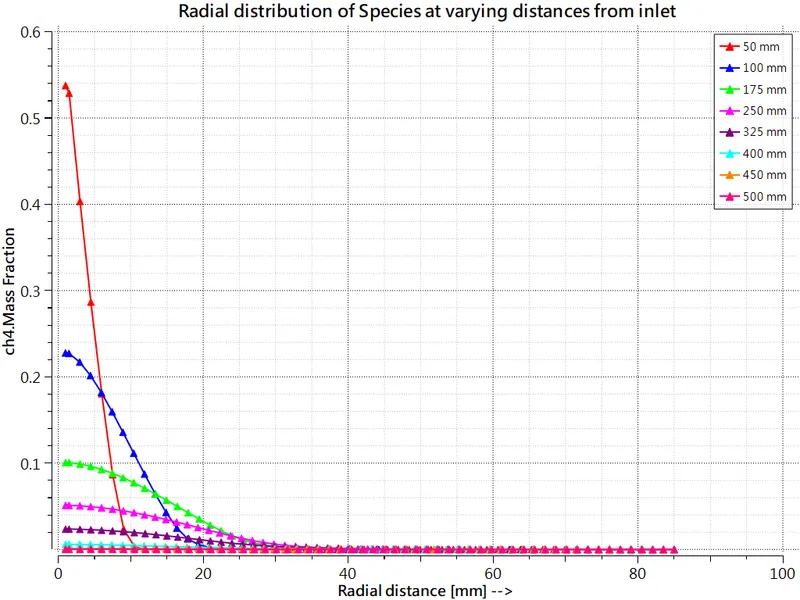
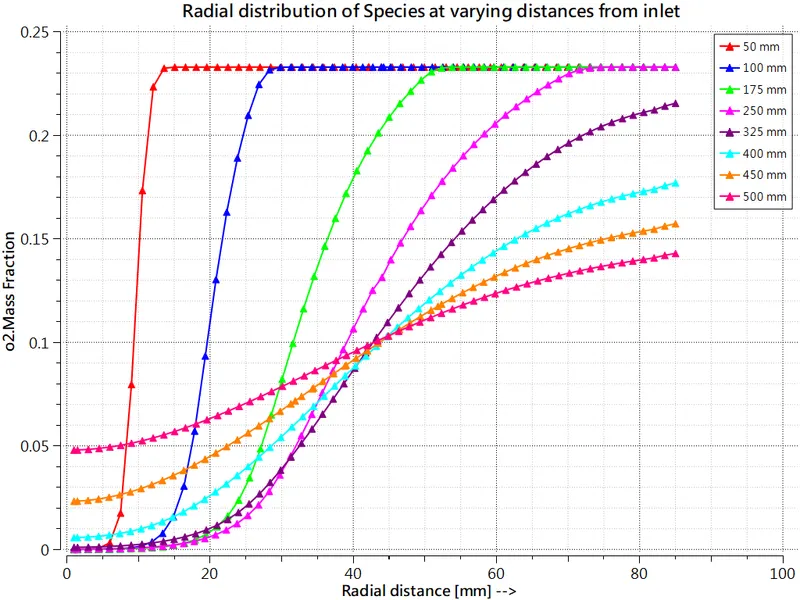
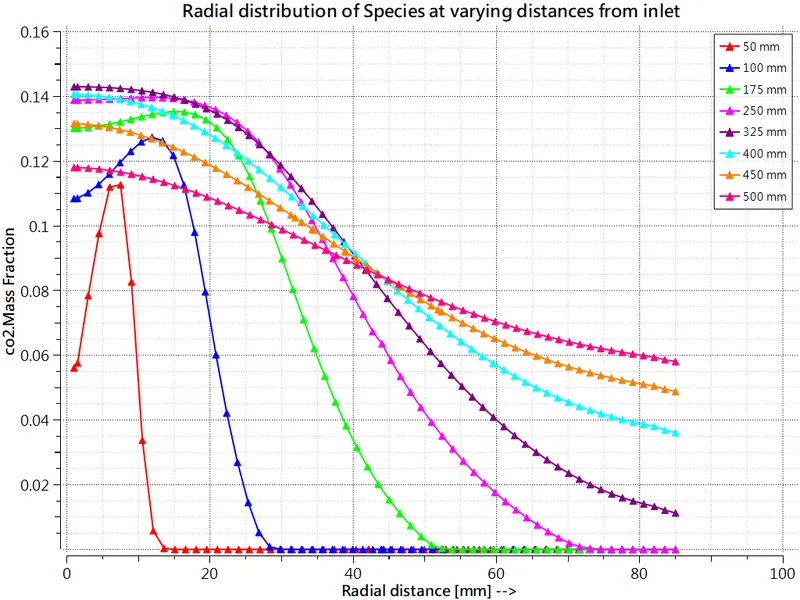
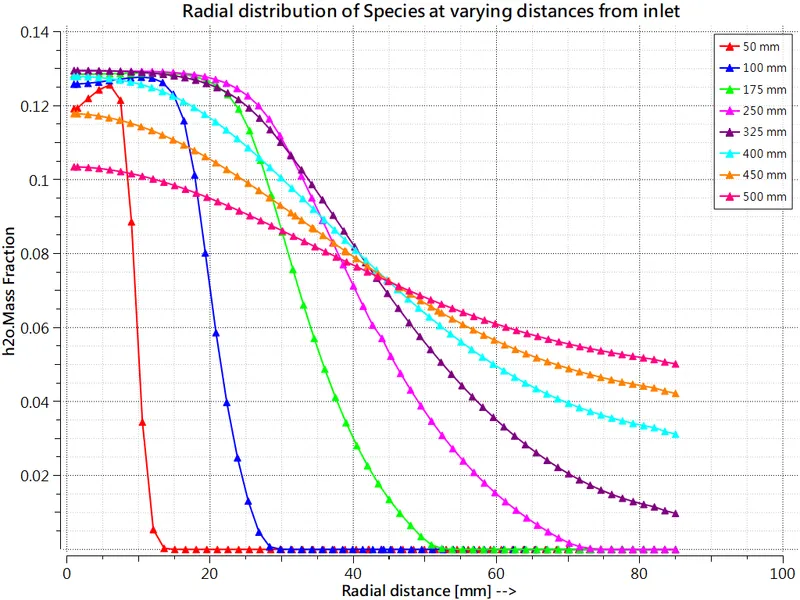
Species mass fractions
PART II
Contours (5% Water)
Species mass fractions (5% Water)
Contours (10% Water)
Species mass fractions (10% Water)
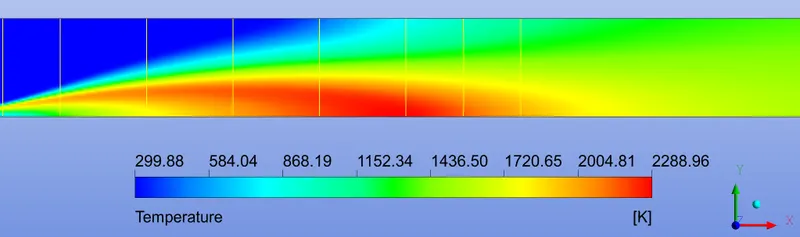
Contours (15% Water)
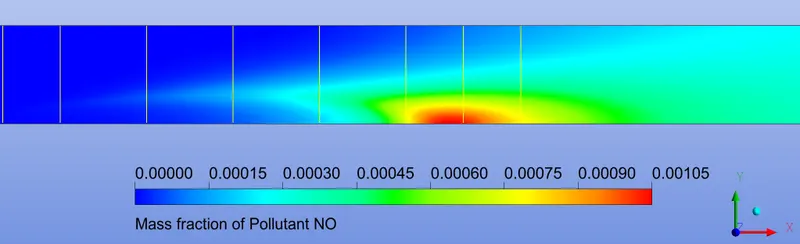
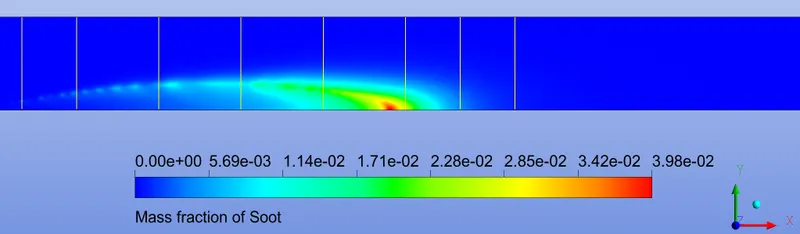
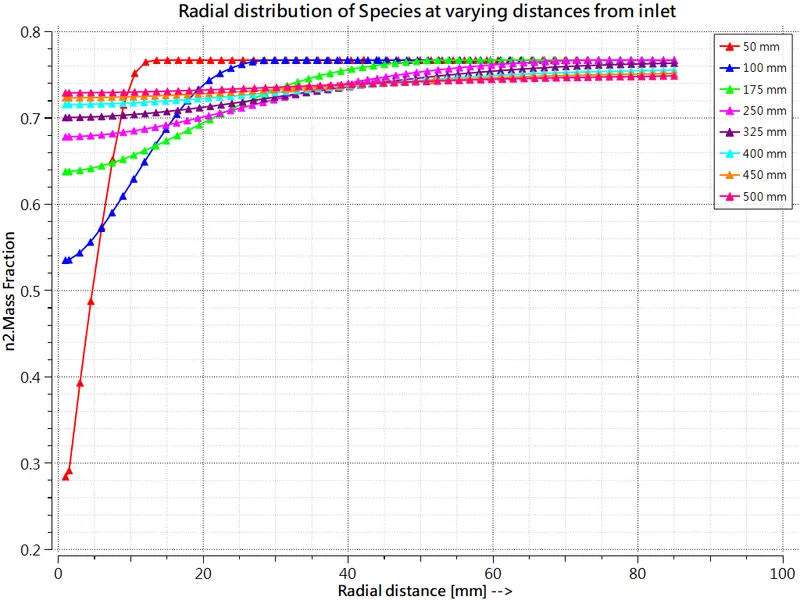
Species mass fractions (15% Water)
Contours (20% Water)
Species mass fractions (20% Water)
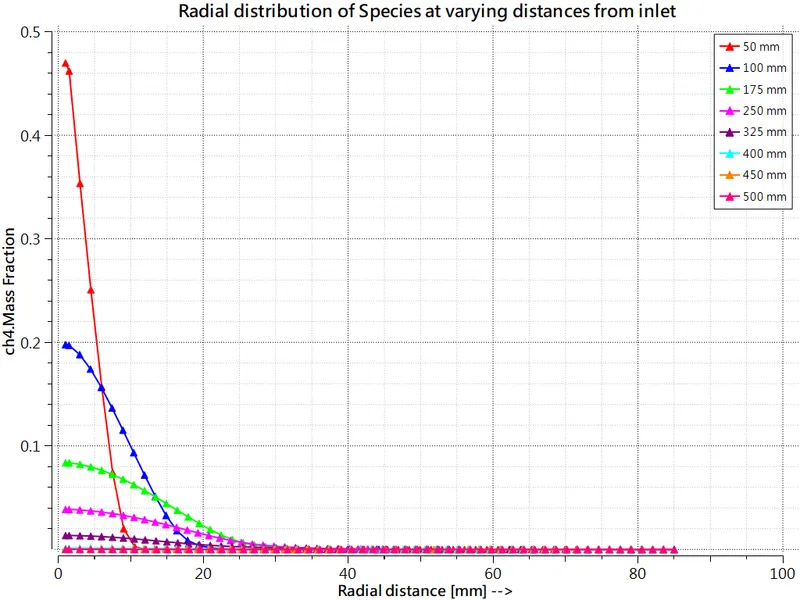
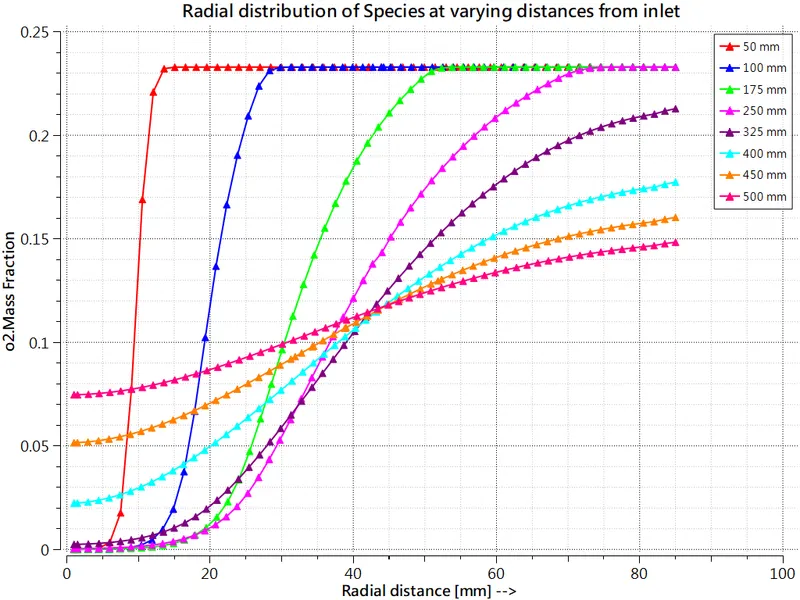
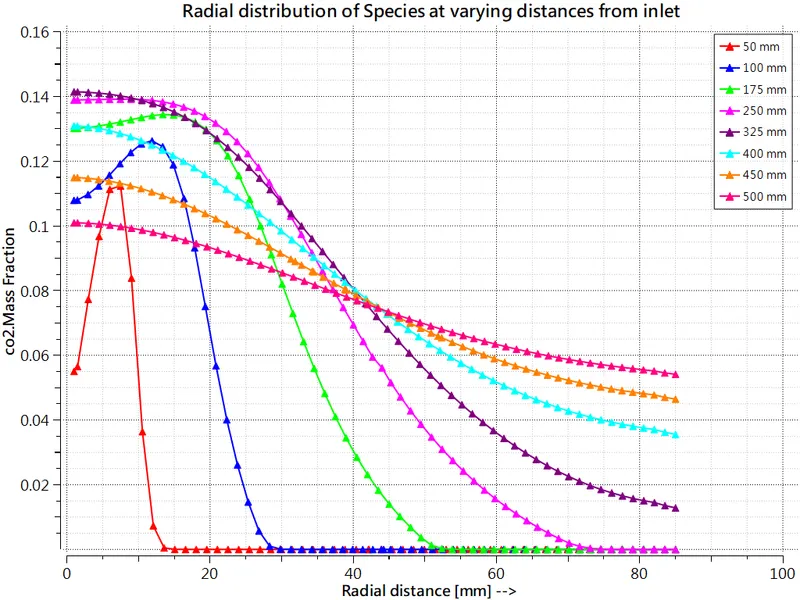
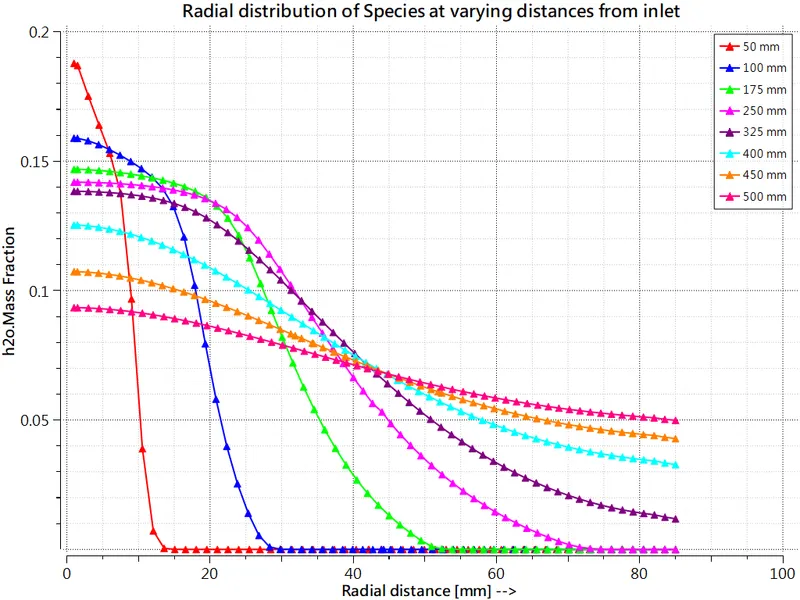
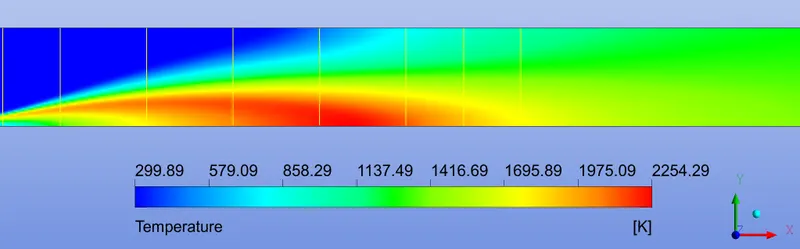
Contours (20% Water)
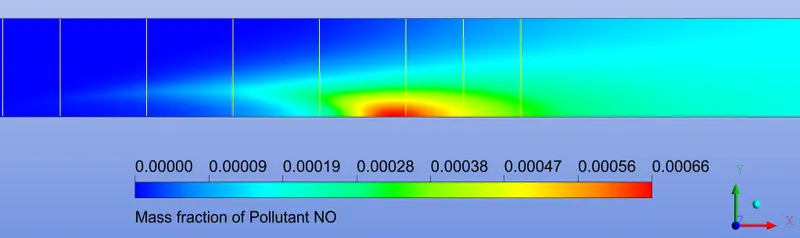
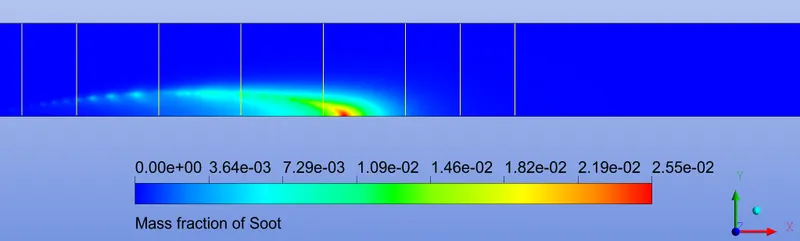
Species mass fractions (20% Water)
Contours (25% Water)
Species mass fractions (25% Water)
Contours (30% Water)
Species mass fractions (30% Water)
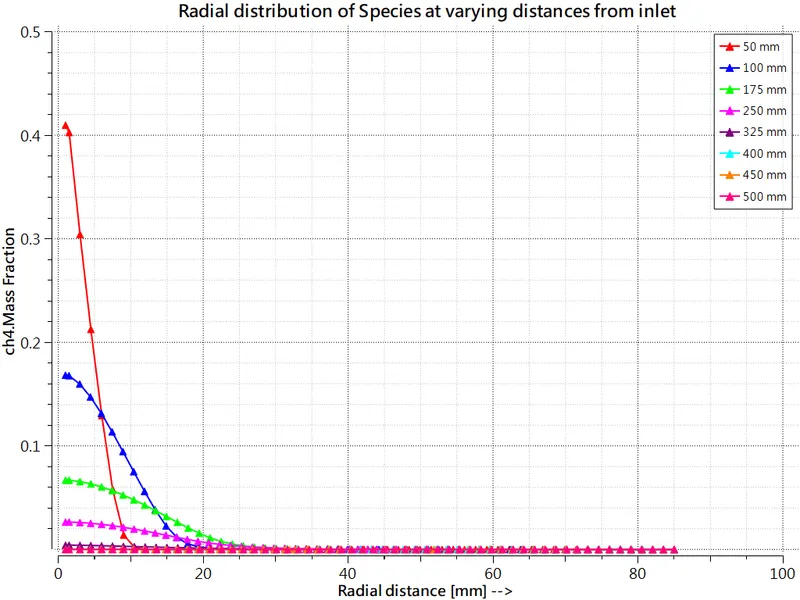
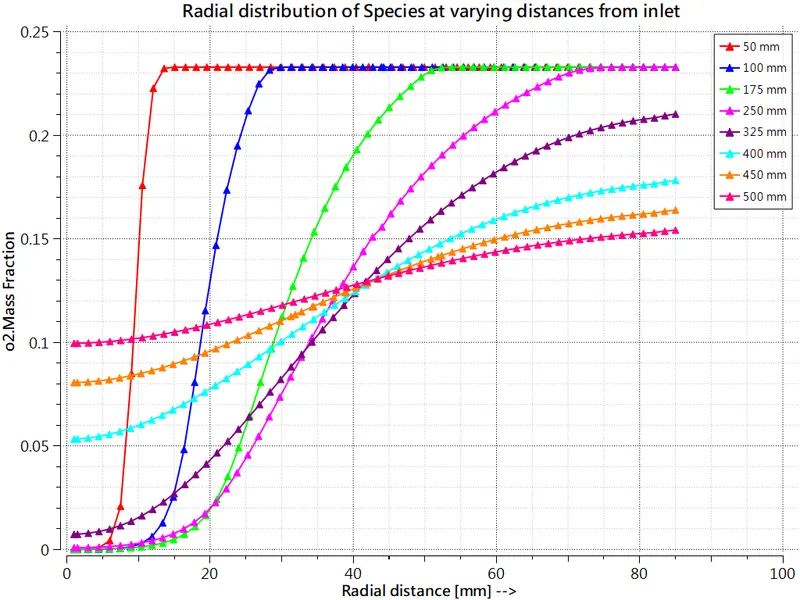
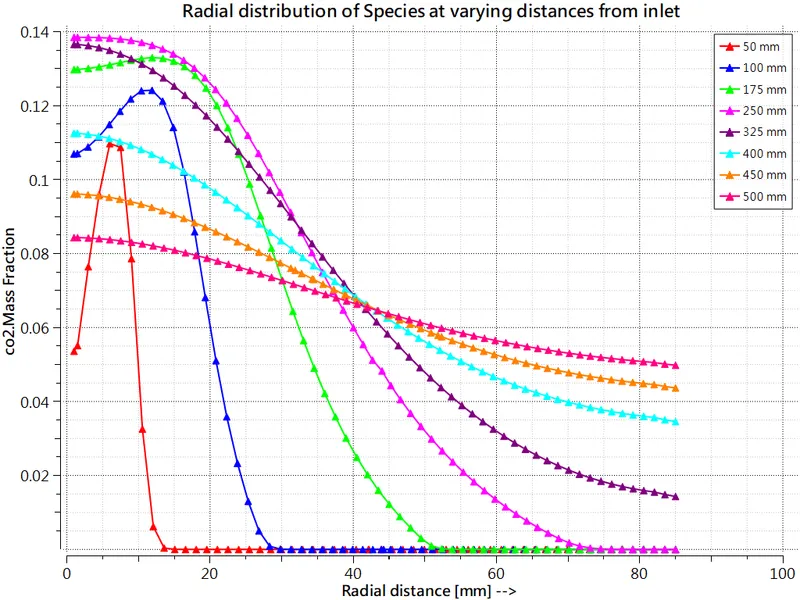
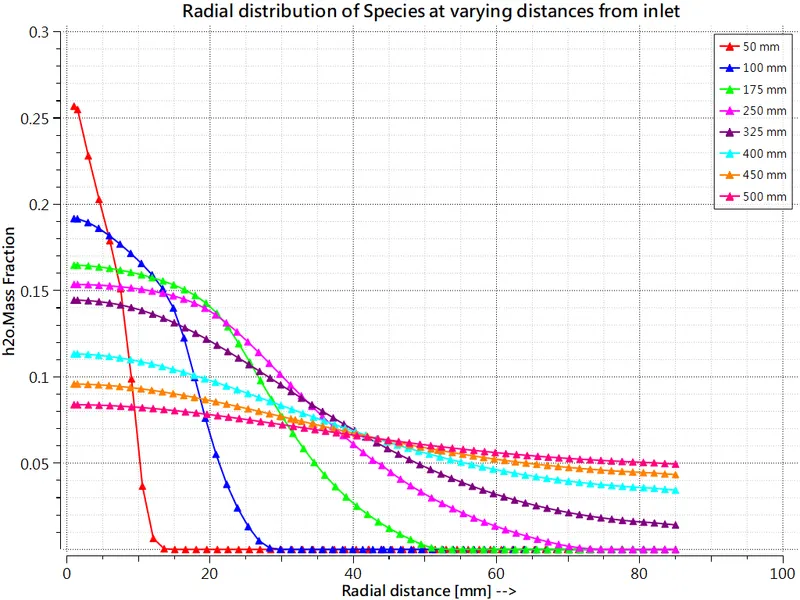
Design points table
Inferences:
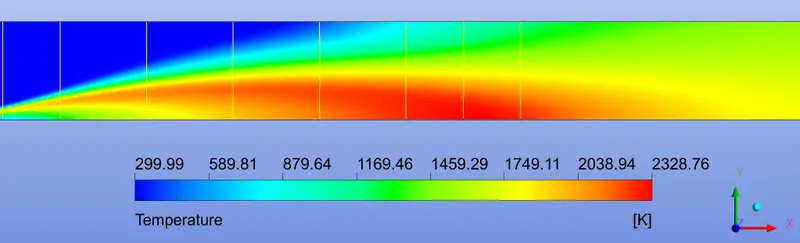
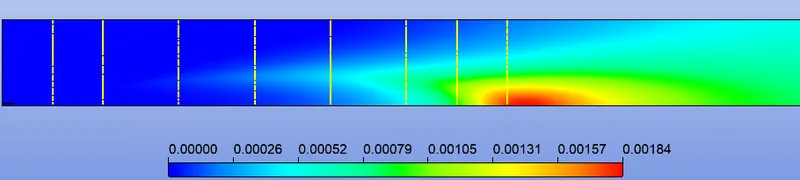
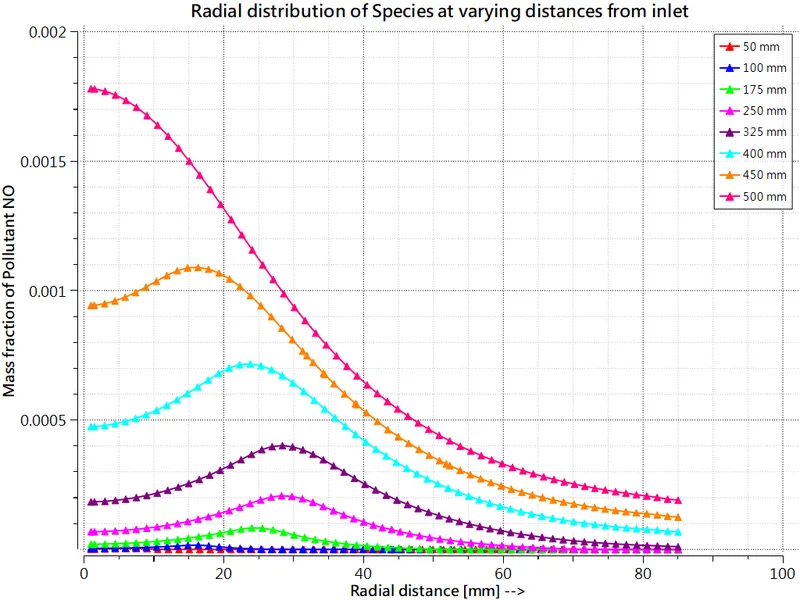
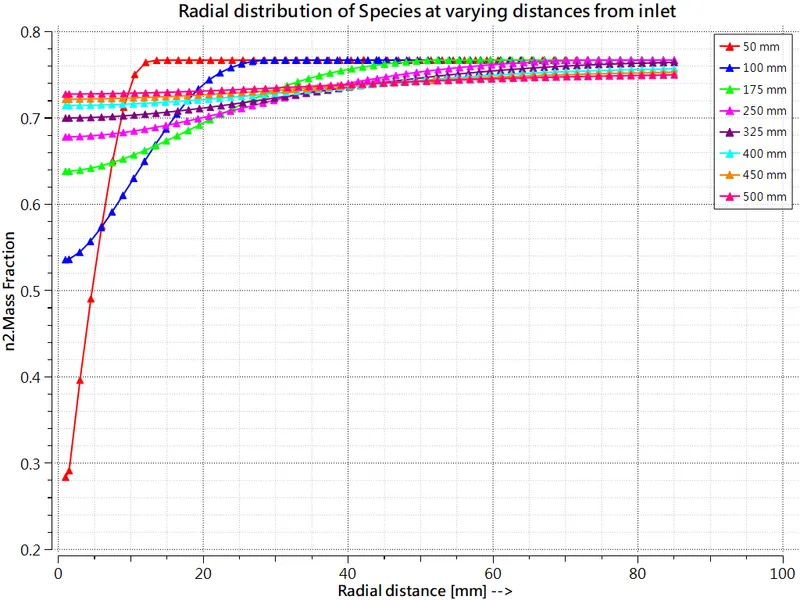
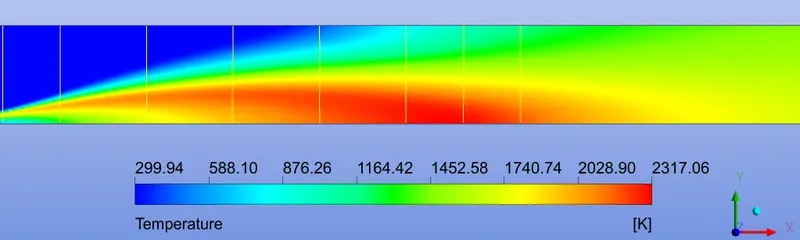
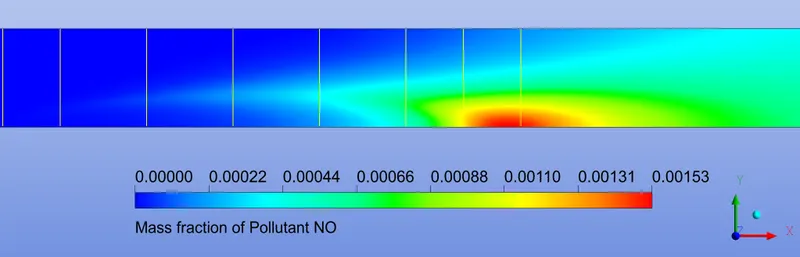
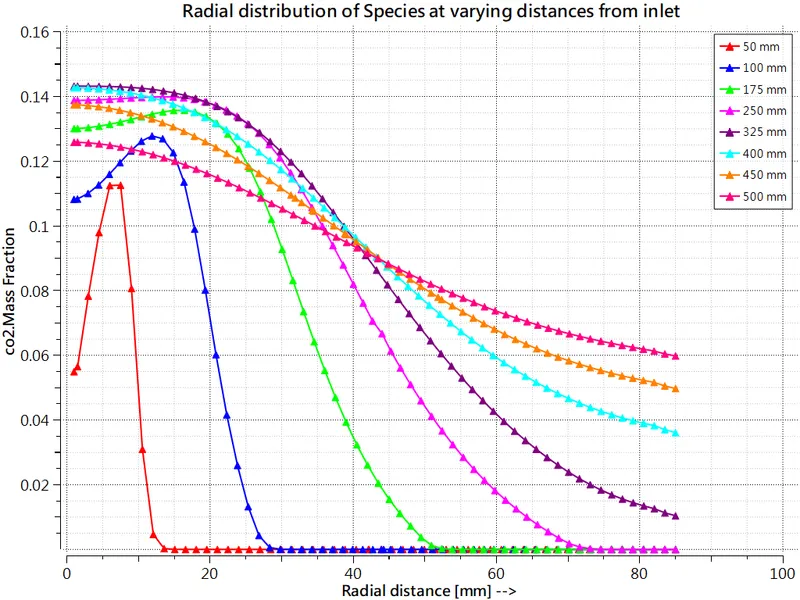
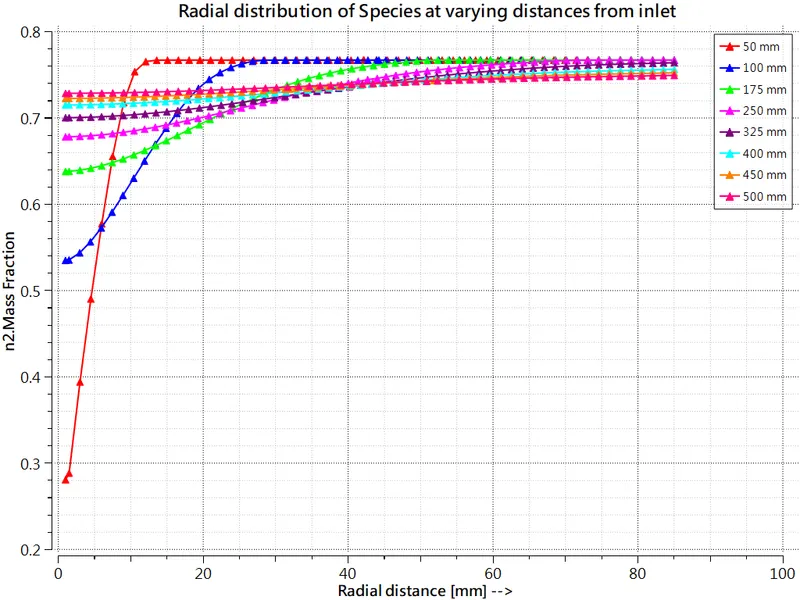
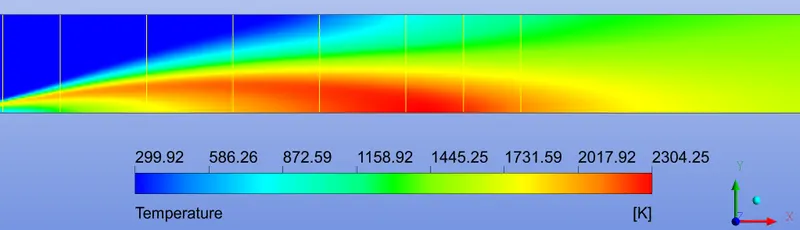
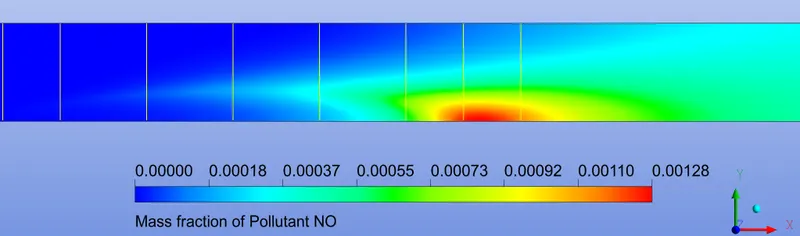
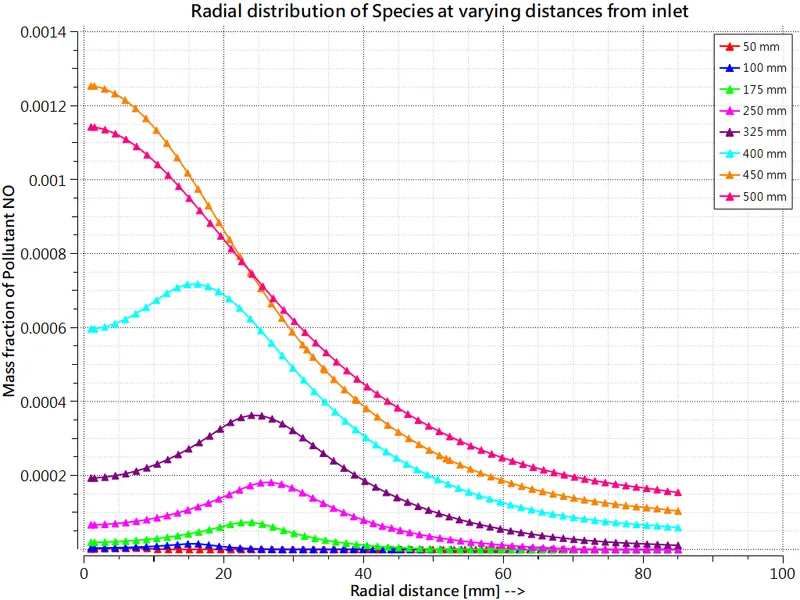
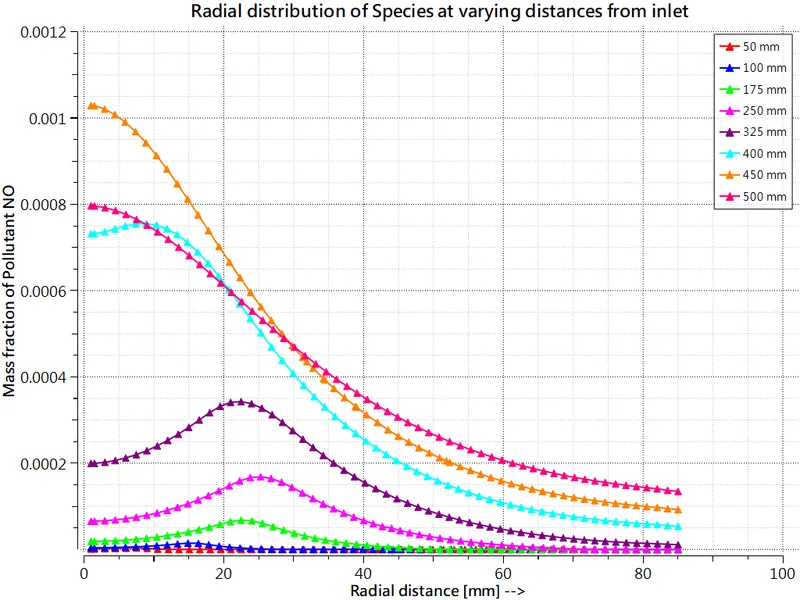
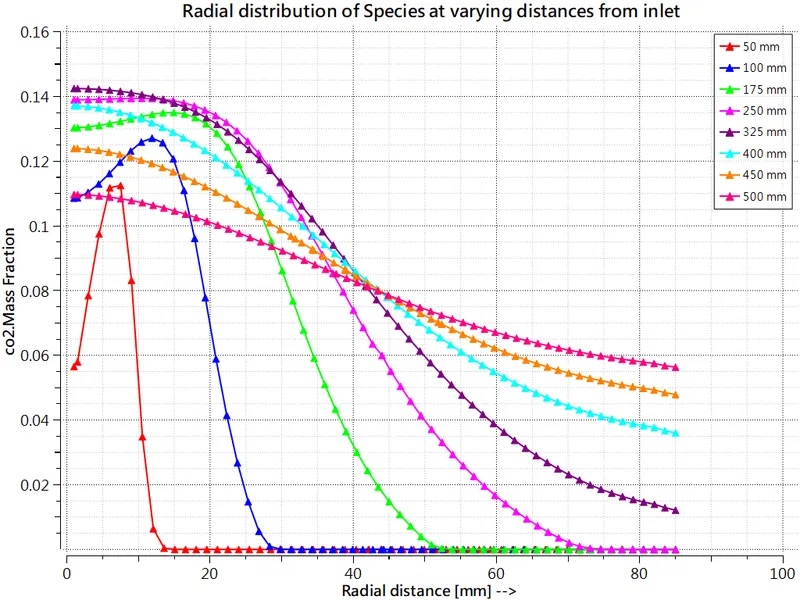
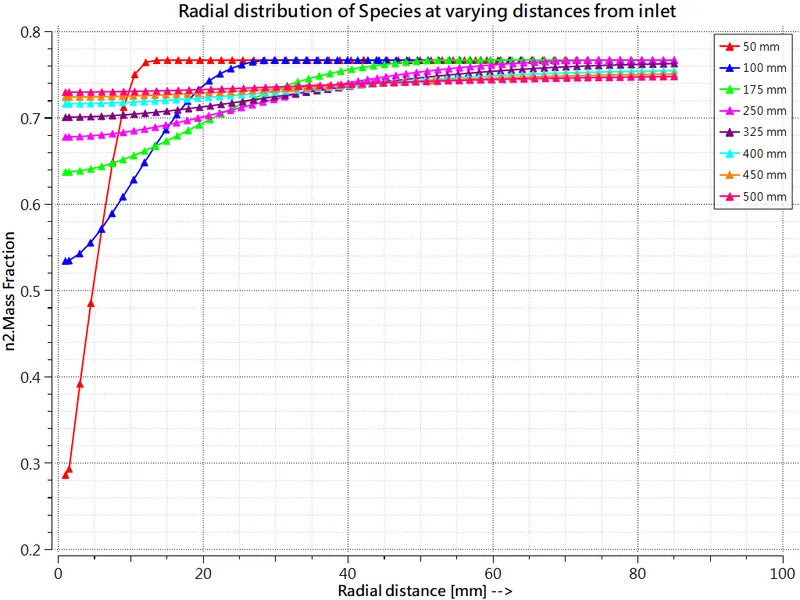
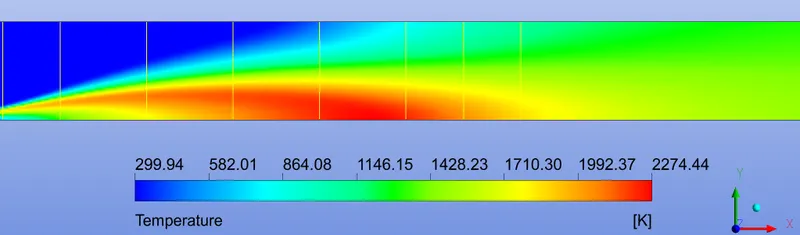
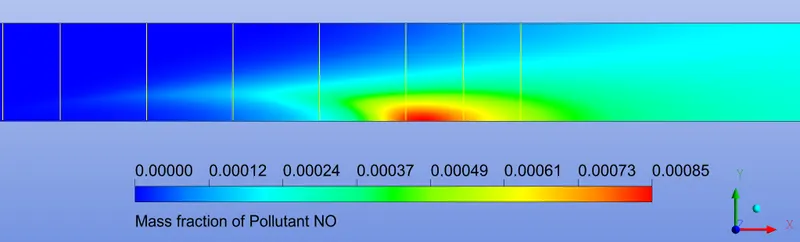
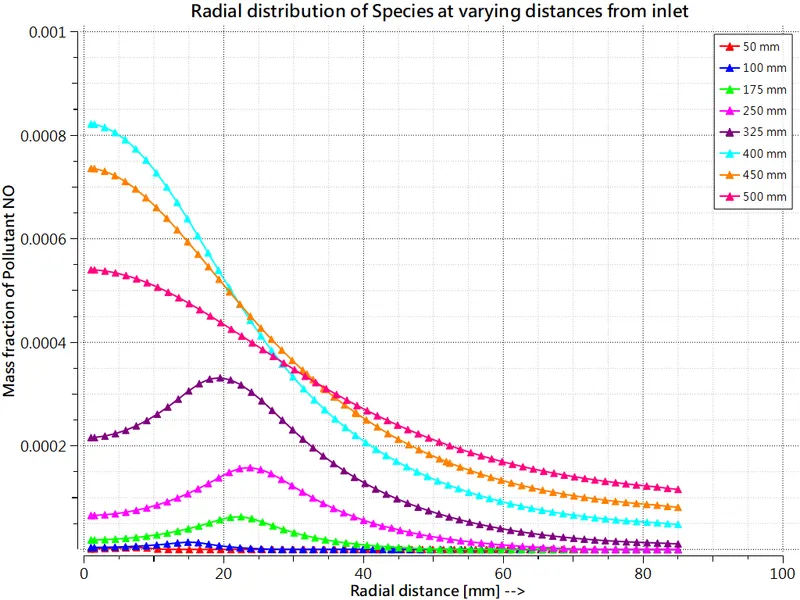
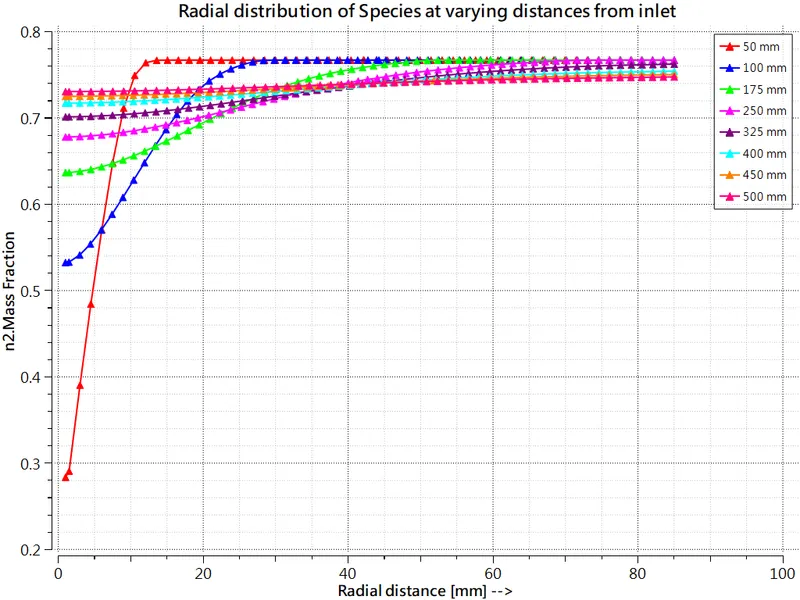
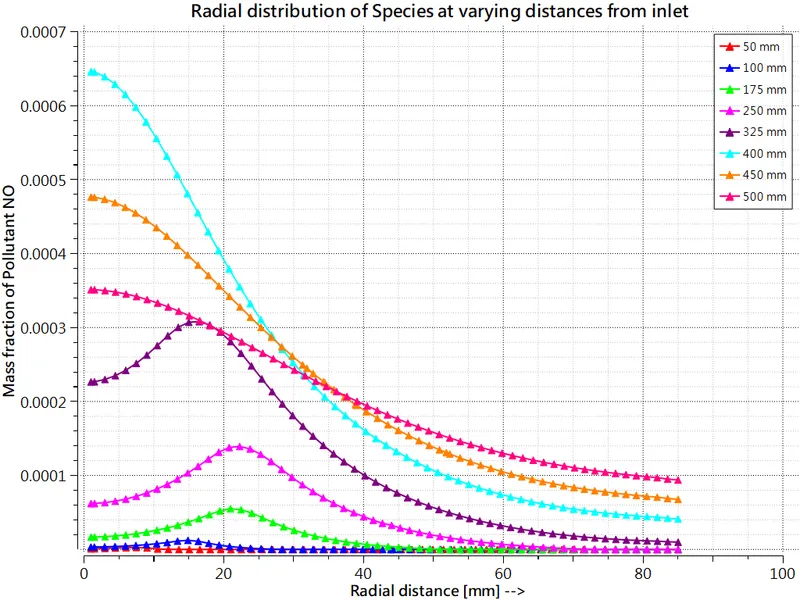
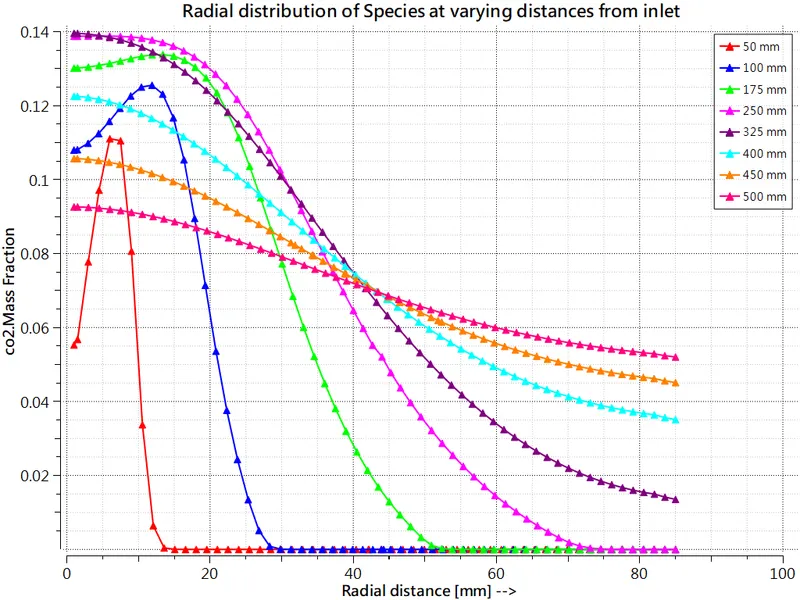
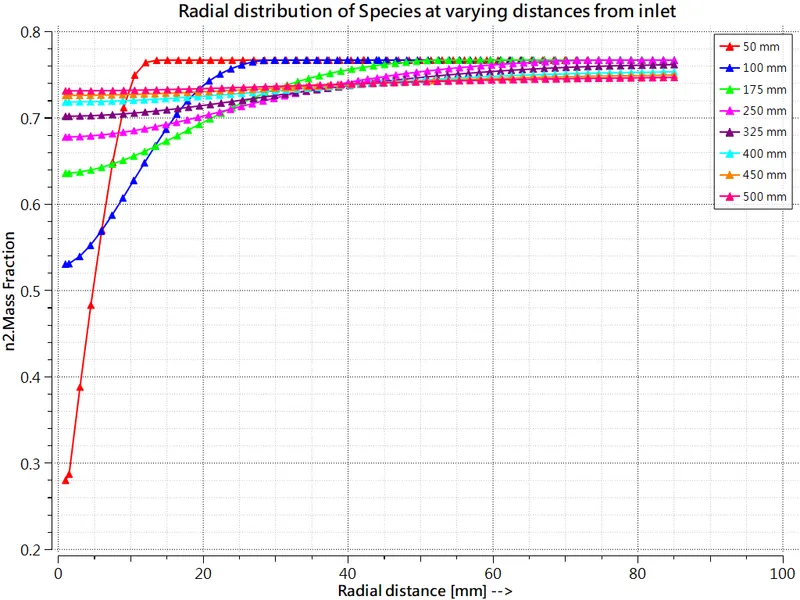
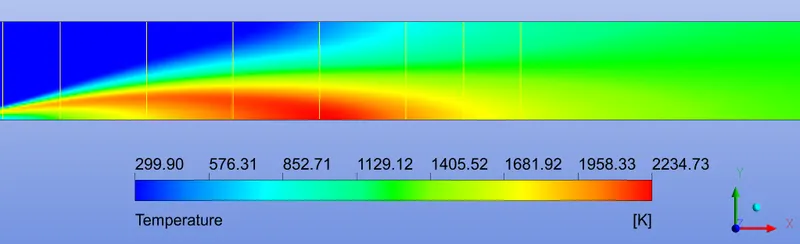
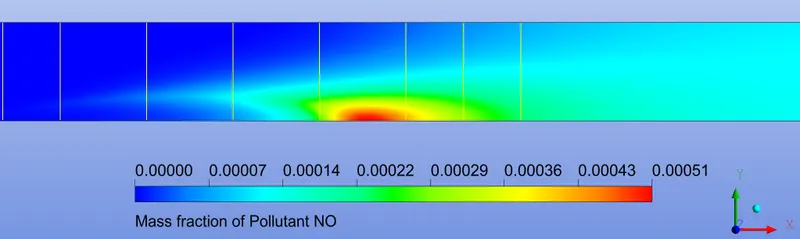
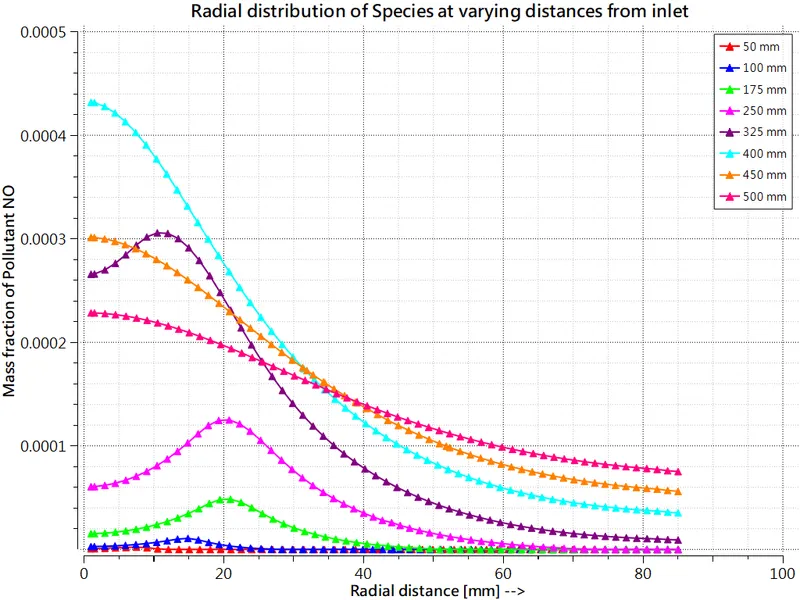
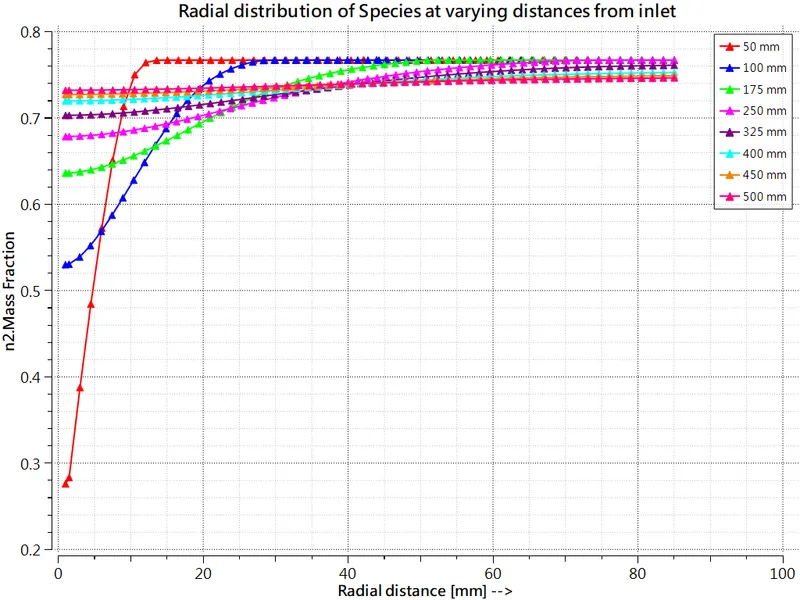
- From the contour plots, it can be seen that max dissociation of N_2 starts near the mid-region in the chamber. This is also where the flow reaches max temperatures.
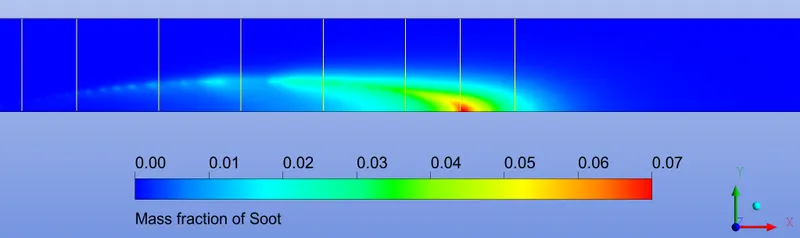
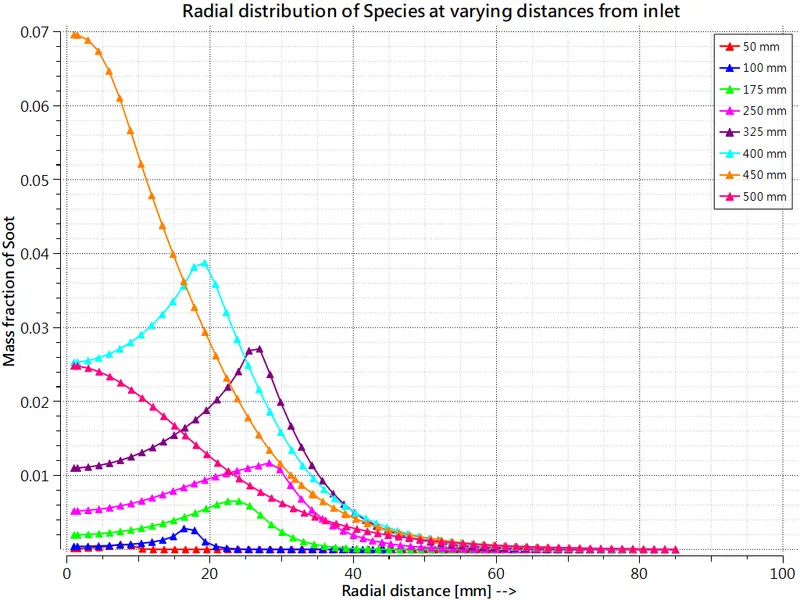
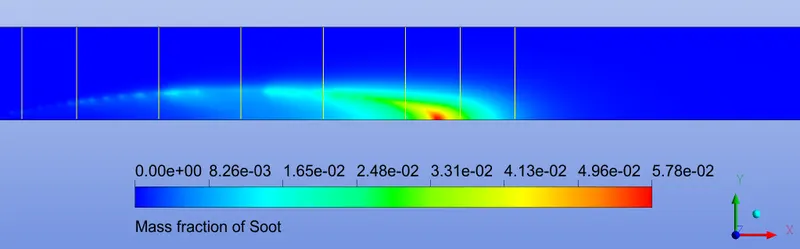
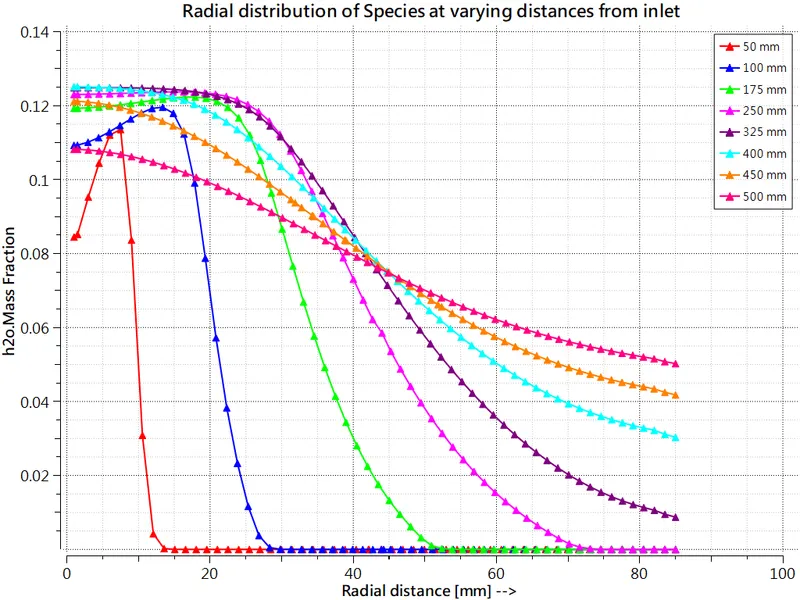
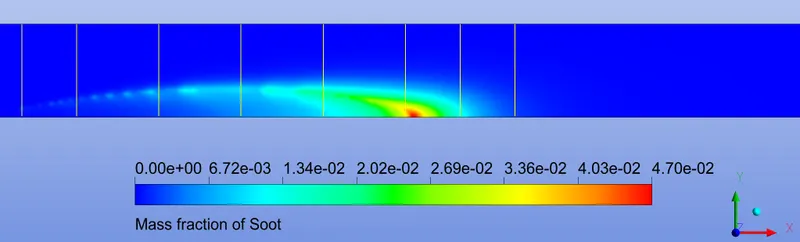
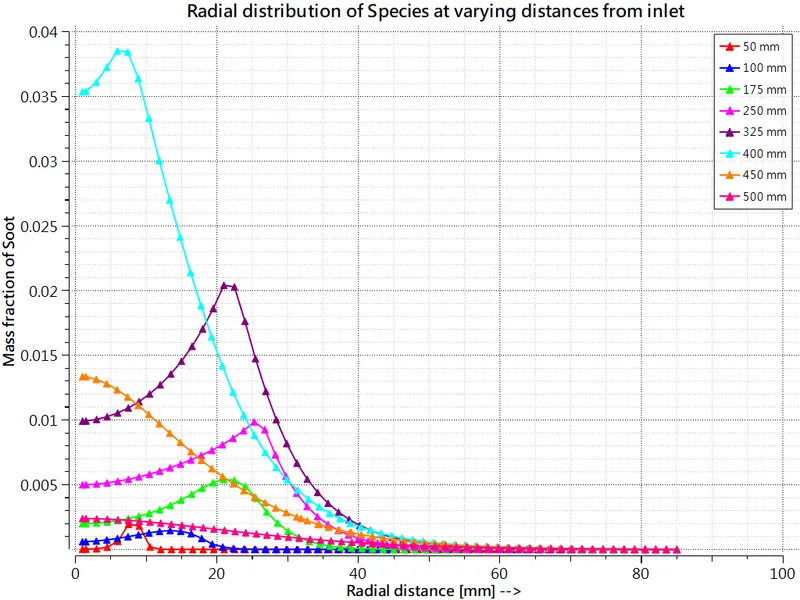
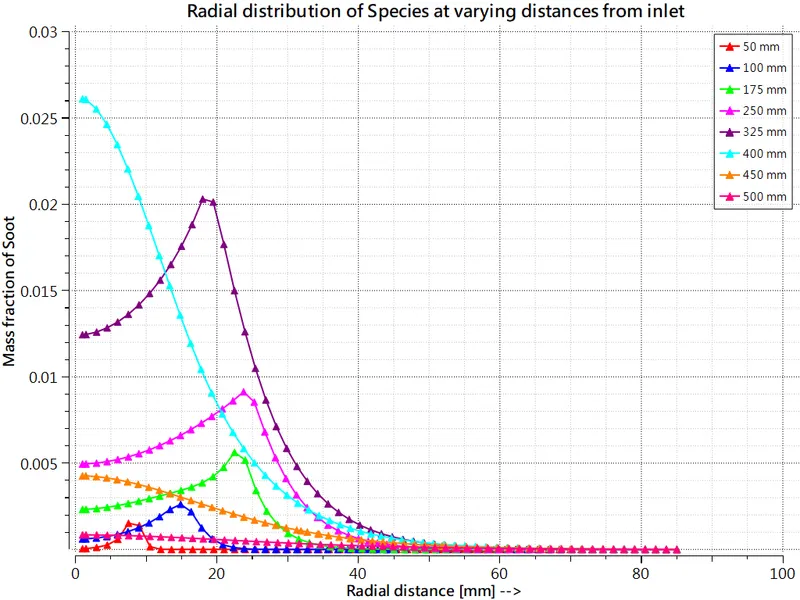
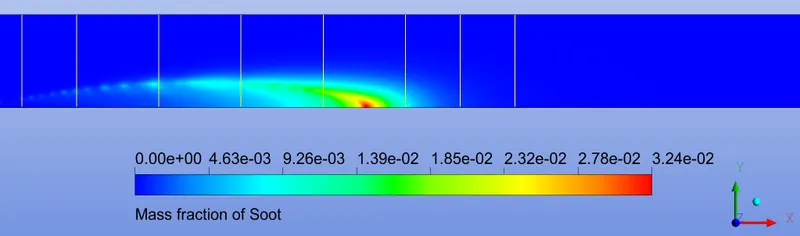
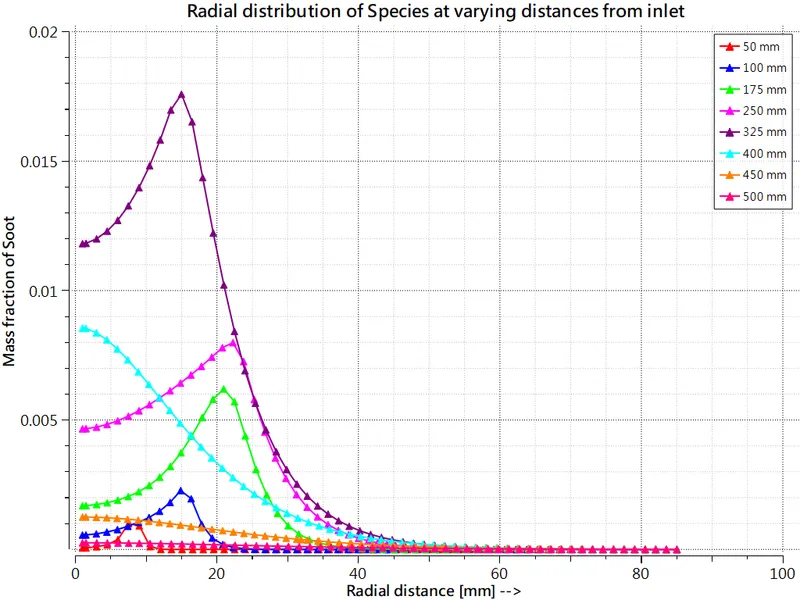
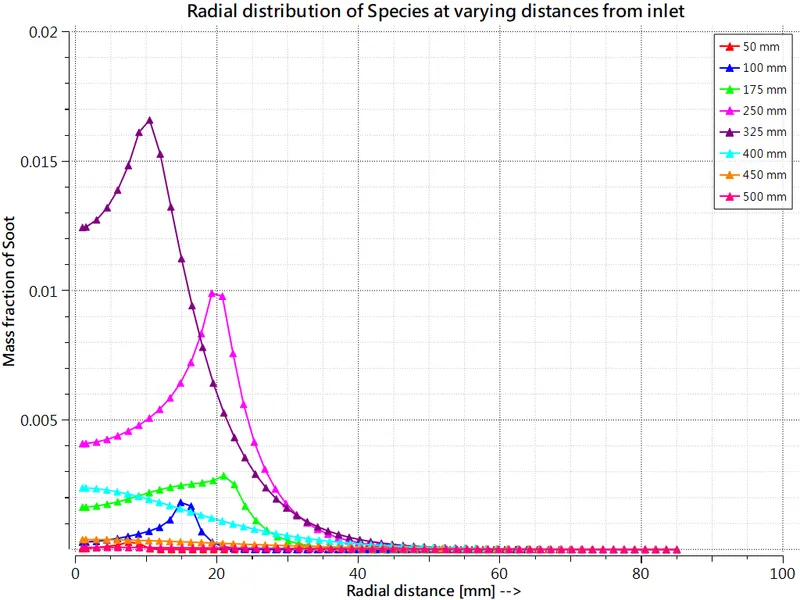
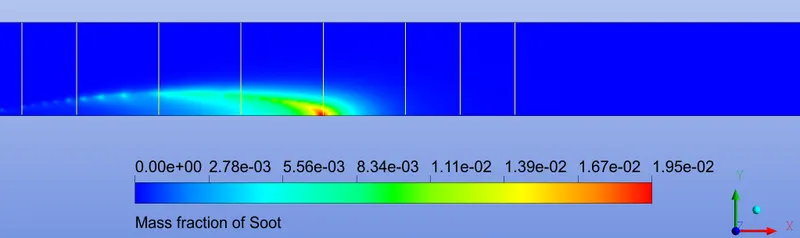
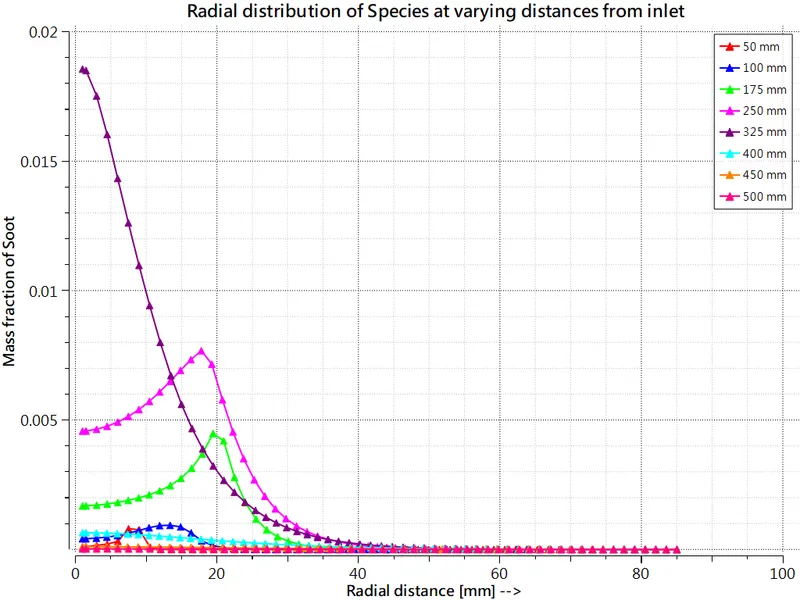
- Line probes & line plots reveal that maximum soot production occurs approximately 325 mm away from the inlet near the axis of combustor.
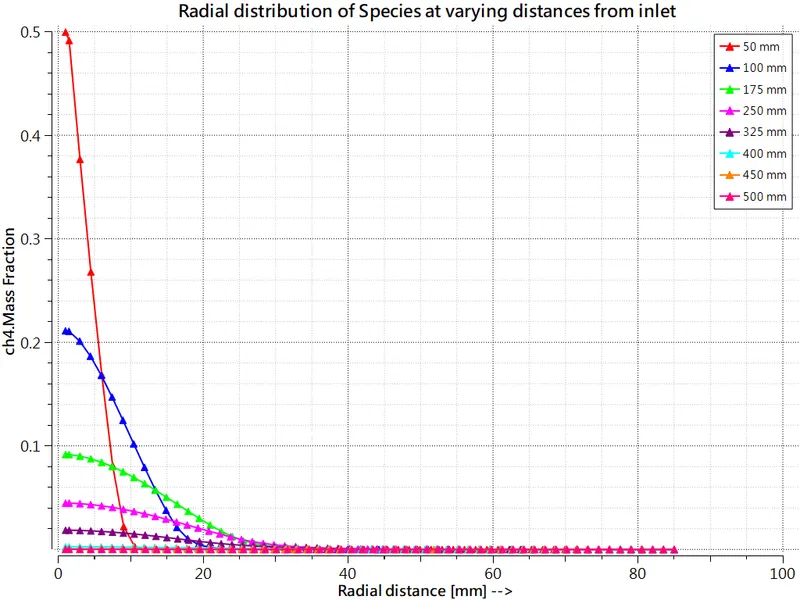
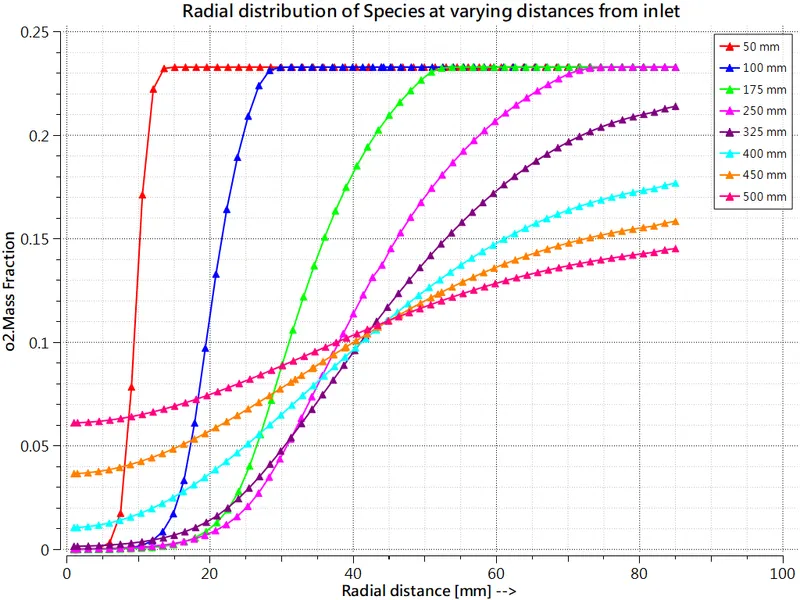
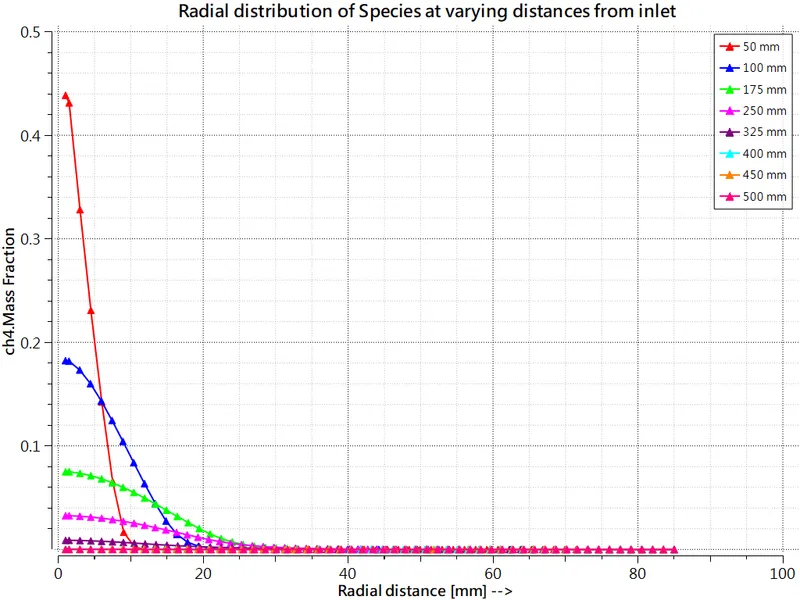
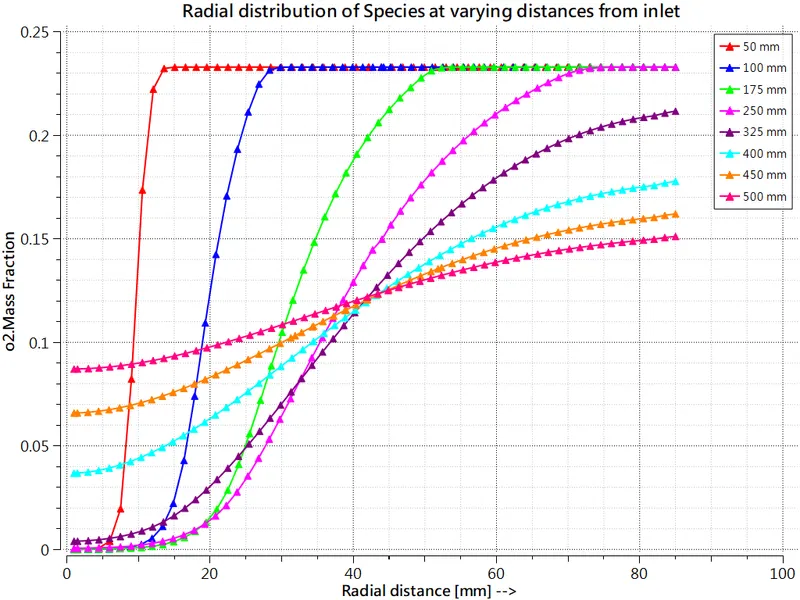
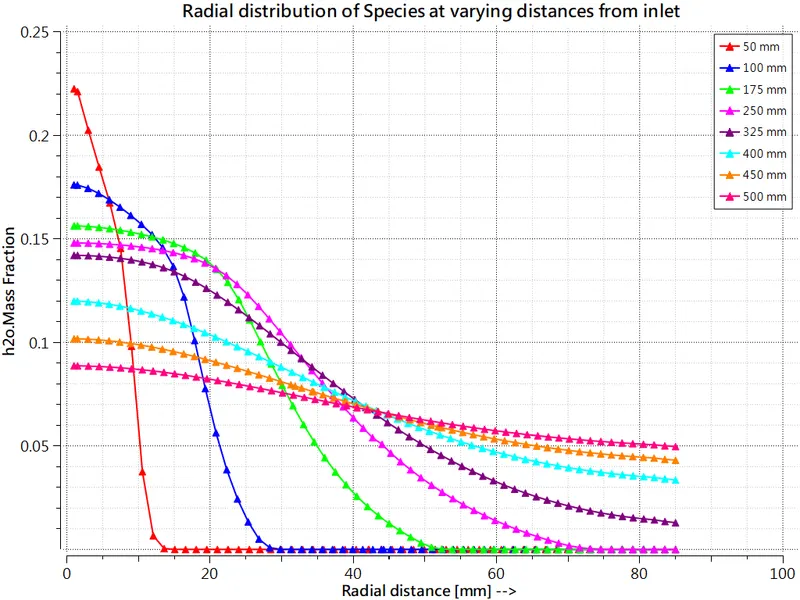
- Radial distribution of O2 shows that combustion occurs mainly along the combustor axis.
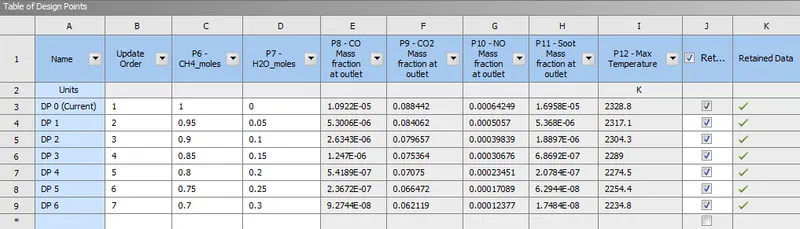
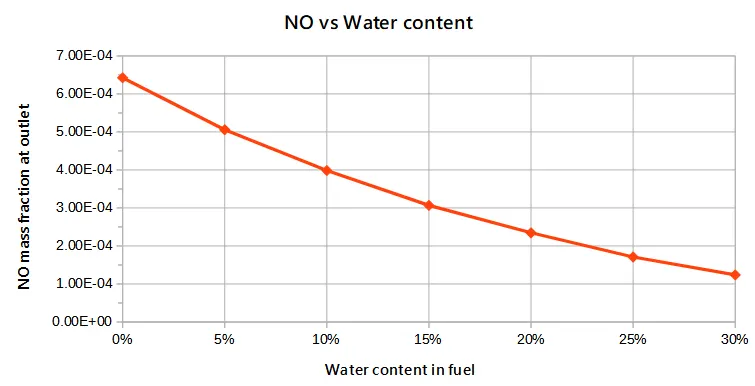
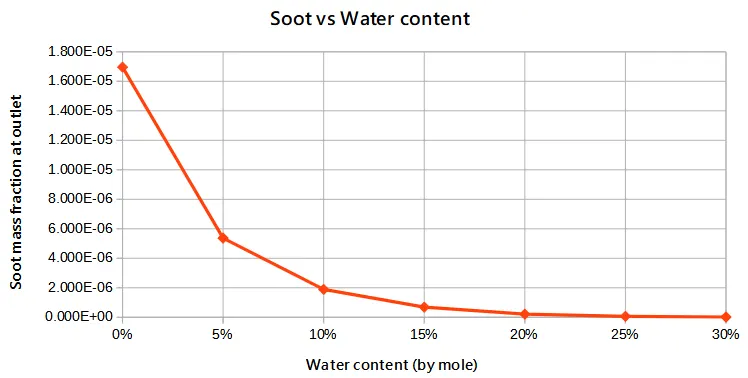
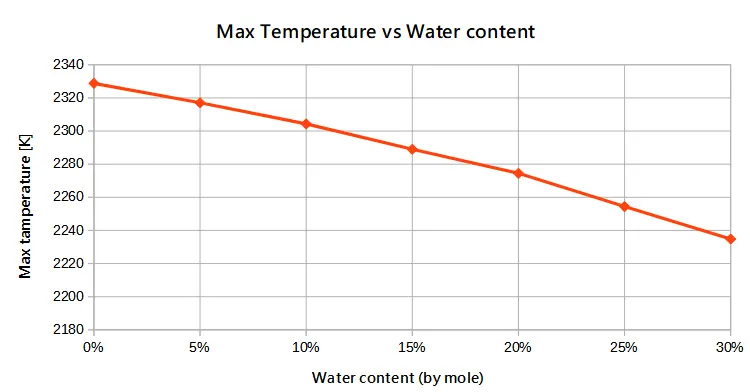
- The trends of max. temperature, CO,NO & soot formation are shown below.
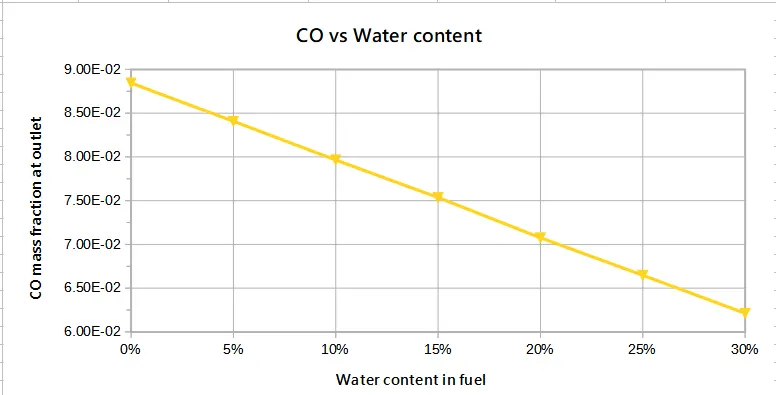
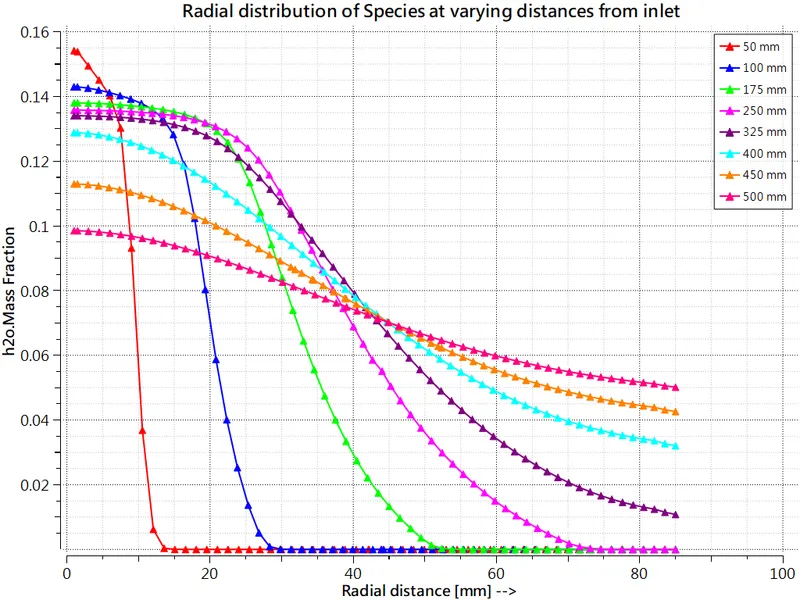
- The generation of CO in the outlet is an indication of incomplete combustion. It is seen that CO at the outlet reduces linearly with water content this is because H_2O molecules provide the needed oxygen for complete burning.
- As water absorbs latent heat during vaporization, the maximum combustion temperature reduces with water content.
- Most thermal NOx is formed in high-temperature stoichiometric flame pockets downstream of the fuel injectors where combustion air has mixed sufficiently with the fuel to produce the peak temperature fuel/air interface.[1] Hence max temperature reduction leads to NO reduction at the outlet with water content.
- It is seen that water exponentially reduces soot formation in the combustor.