Week 10: Project 1 - FULL HYDRO case set up (PFI)
AIM:
To set up a combustion simulation with the details given in the challenge and study different properties of combustion by post-processing the results obtained by the calculation of the full hydro-dynamic set-up for the given geometry.
OBJECTIVE:
- To explain the compression ratio of the engine
- To describe need for wall heat transfer model and to predict the wall temperature from CFD simulation
- To calculate the combustion efficiency of the engine
- Using the engine performance caluclator to determine the power and torque for the engine.
DESCRIPTION:
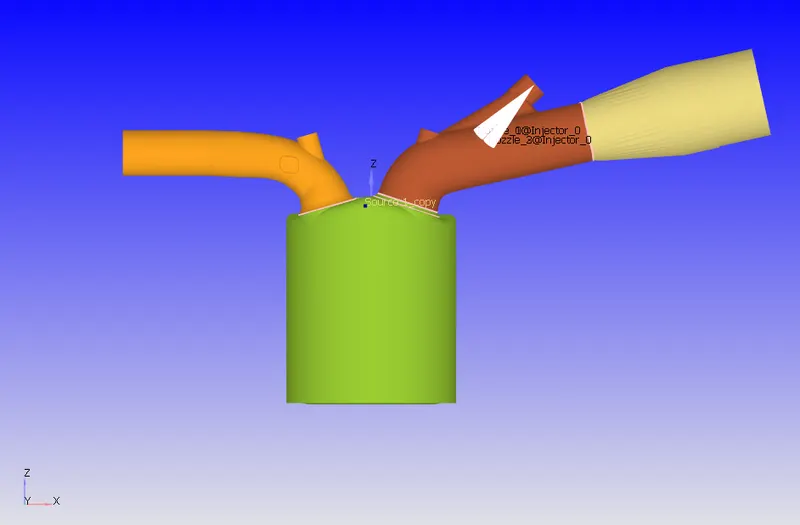
As the surface preparation and boundary flagging of the geometry are done in the previous project1 for no hydro case, we use the same file and do the case set-up for full hydrodynamic case.
Once the desired error-free geometry is ready, the full hydro case is setup using the information given in the challenge.
CASE SET-UP FOR FULL HYDRO:
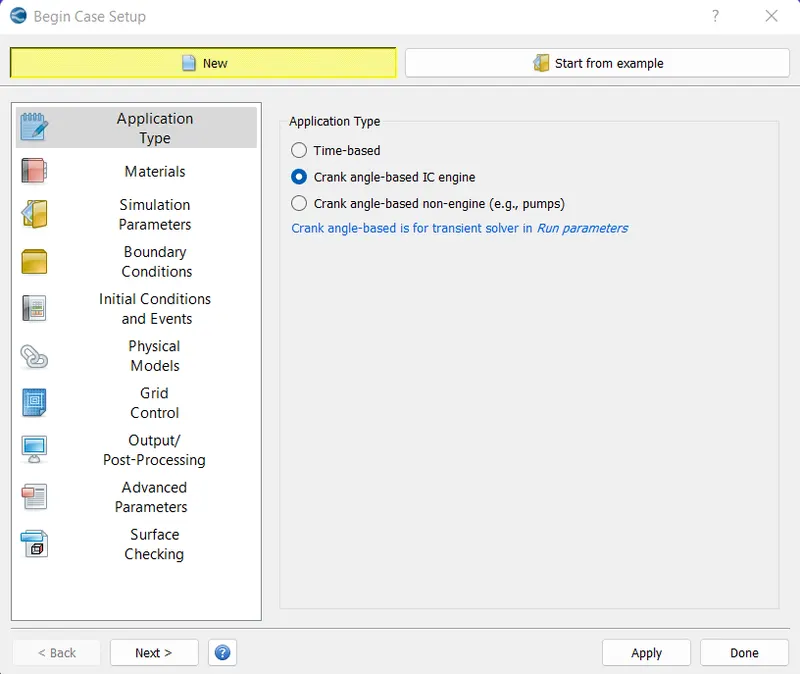
The application type is set to crank angle based as we are simulating an IC engine cylinder.
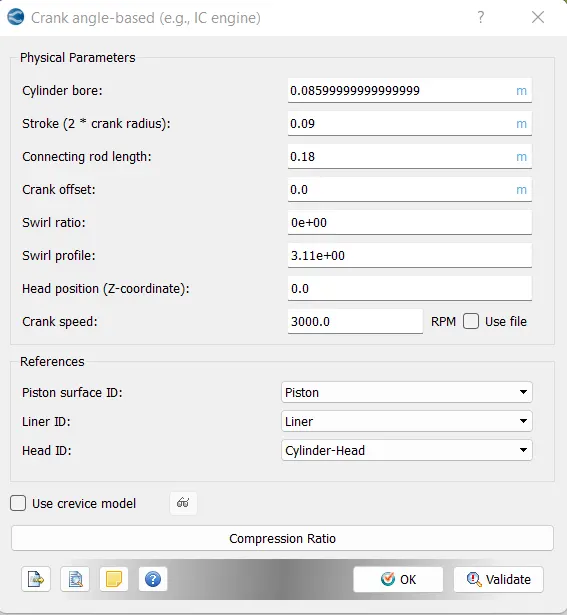
The measurements for the cylinder are specified by referring to the data given
- Bore =0.086 m
- Stroke = 0.09 m
- Connecting rod length = 0.18 m
- RPM = 3000
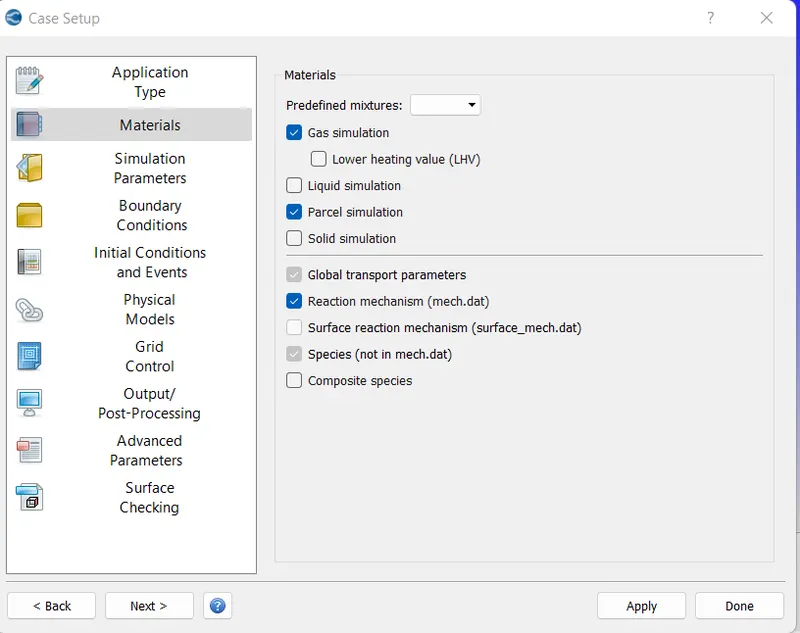
For materials enabling the parcel simulation
Then adding IC8H18 isooctane as fuel
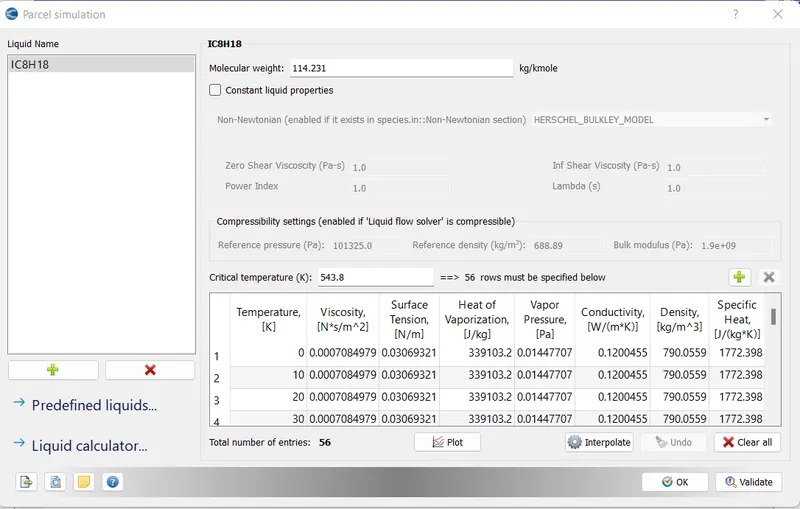
Importing the 'mech.dat' and 'therm.dat' in the materials tree to specify the reactions taking place between inside the cylinder during combustion.
For reaction mechanism using the mech.dat file
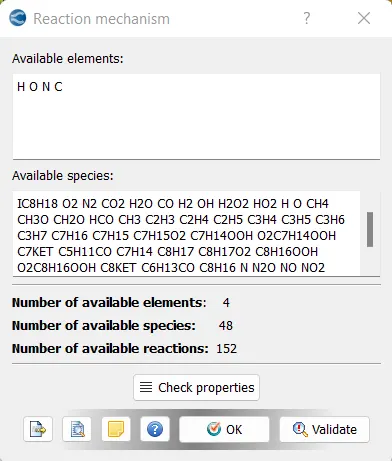
Imporing the thermo.dat file in gas simulation
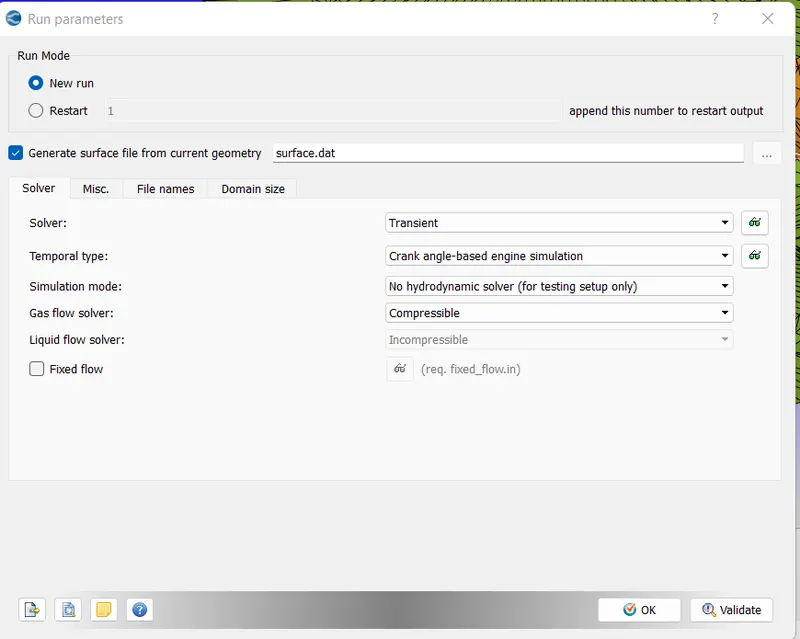
In the run parameters we set up a transient simulation and select the no hydrodynamic solver as simulation mode. The gas flow solver is set to be compressible.
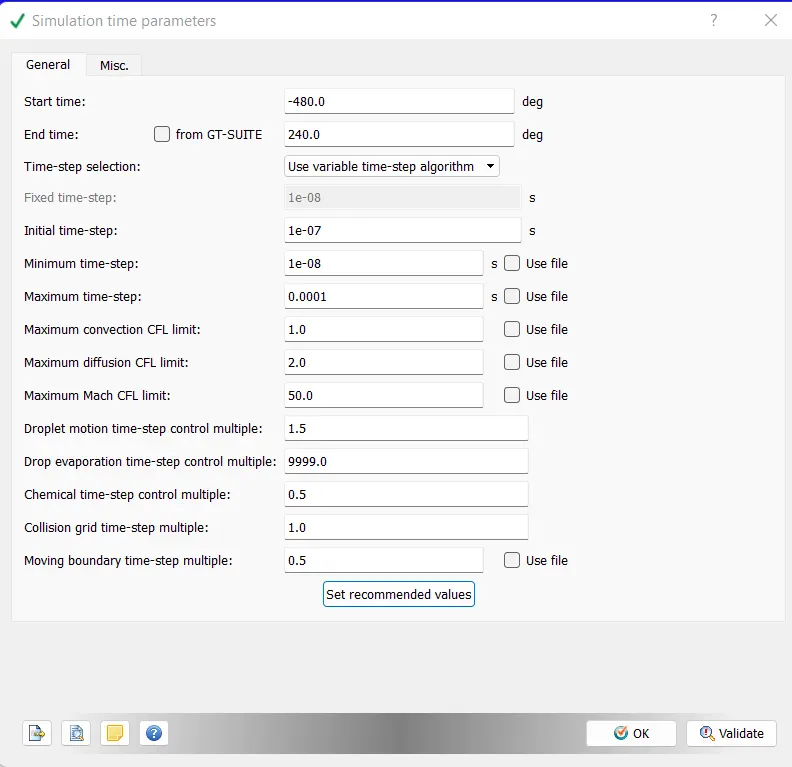
The simulation time parameters is set from -480 degeres to 240 degree as the simulation is made to run for a total of 720 degree crank angle which completes one revolution.
BOUNDARY CONDITIONS:
A. The Liner, cylinder head, spark plug, spark plug terminal, exhaust port, intake port, inflow & outflow are set as fixed non-moving walls with different temperature profiles which are taken from the given data file
- Liner temperature - 450K
- Head temperature - 450K
- Spark Plug temperature - 550K
- Spark Plug electrode temperature - 600K
- Exhaust ports temperature - 500K
- Exhaut outflow - 1 bar
- Exhaust outlflow temperature - 800k
- Exhaust species concentration - the stoichiometric condition i.e N2 (0.71913), CO2(0.19235), H2O (0.088525)
- Intake port - 1 temperature 425K
- Intake port - 2 temperature 425K
- Inflow pressure - 1 bar total pressure
- Inflow temperature - 363K
- Inflow species - Air
B. The Piston is set to be moving wall and it is considerd to be following the piston profile
- Piston temperature - 450K
C. The exhaust valve top, bottom and angle are also taken as moving walls following the profile of a given data file (ehaust_lift.in)
- Exhaust valve top temperature - 525K
- Exhaust valve angle temperature - 525K
- Exhaust valve bottom temeprature - 525K
D. Similarly the intake port is specified to follow intake_lift.in with following temperature
- Intake valve top temperature - 480K
- Intake valve angle temperature - 480K
- Intake valve bottom temeprature - 480K
REGIONS, INITIALIZATION & EVENTS:
The geometry is split into 4 different regions namely Cylinder region, Intake port-1, Intake port-2 and Exhaust port.
All the regions have different temperatures and pressure values as follows
- Intake port - 1 (closer to combustion chamber)
- ic8h18 - 0.025508
- o2 - 0.20157
- n2 - 0.77292
- Temperature - 390k
- pressure - 1 bar
- Intake port - 2 (away from combustion chamber)
- Air
- Temperature - 370K
- Pressure - 1 bar
- Cylinder
- Pressure - 1.85731 bar
- Temperature - 1360K
- Stoichiometric composition i.e N2 (0.71913), CO2(0.19235), H2O (0.088525)
- Exhaust port
- Pressure - 1.03737 bar
- Temperature - 1215K
- Stoichiometric composition i.e N2 (0.71913), CO2(0.19235), H2O (0.088525)
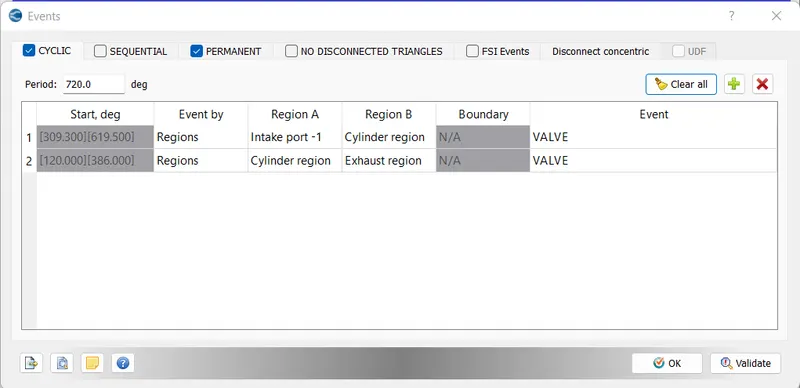
The events is set for three different pairs of regions
The Intake port-1 - Cylinder head set as valve event following the motion profiles as follows
The Cylinder head - Exhaust port is also set as valve event following the motion profile as follows and both under cyclic events as follows
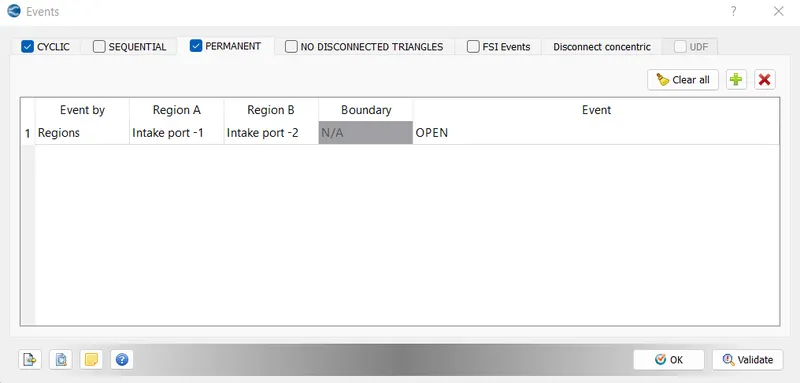
Under permanents events, Intake port-1 - Intake port-2 is set to open permanently
TURBULENCE AND PHYSICS MODELLING:
The first step in physics modelling is to set up the injection fuel into the cylinder at a specific interval of time.
SPRAY MODELLING:
Converge includes state of art physical models for a wide variety of phenomena, including chemistry, turbulence, multiphase fluid flow, spray and radiation and it automaticaly couples these models so you don't have to. if you're looking for a shorter runtime, you can choose one of Converge's simplified combustion models. If accuracy is paramount, Converges detailed chemical kinetica solver will help you obtain the results you need for turbulence modelling, you can choode from a host of both RANS and LEs models.
For spray modelling converge can capture physical processes from liquid injection and spray breakup to drop/wall interaction and evaporation. Converge also includes several volume of fluid modelling options to simulate multi-phase flows.
Select the spray modelling parameter in the physics models. In the spray modelling we are using O'Rourke model to intializa the spray of the fuel.
The species to be injected is selected as the fuel element 1C8H18, which is selected as the parcel particle in the material properties.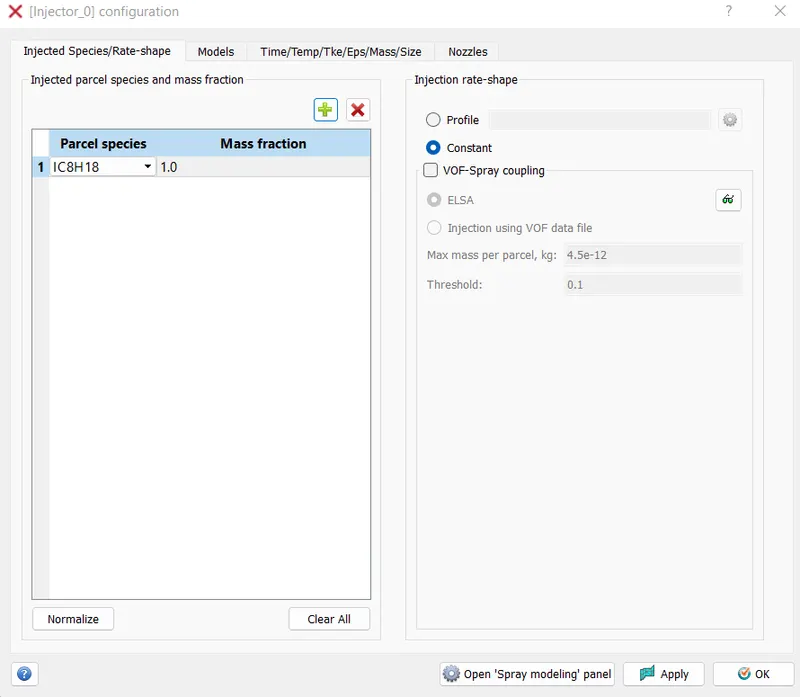
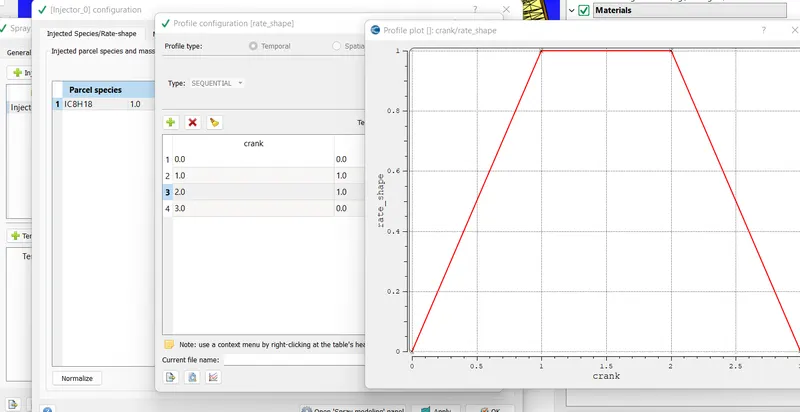
The following parameter values are introduced for the specifications of fuel injection
- Fuel flow rate = 7.5e-4 Kg/second
- Injection start time = -480.0
- Injection duration = 191.2
- Fuel temperature = 330K
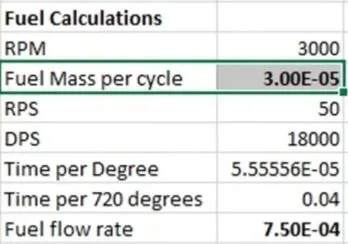
Total fuel mass injected per cycle is 7.5e-4 x 0.04 = 3e-5
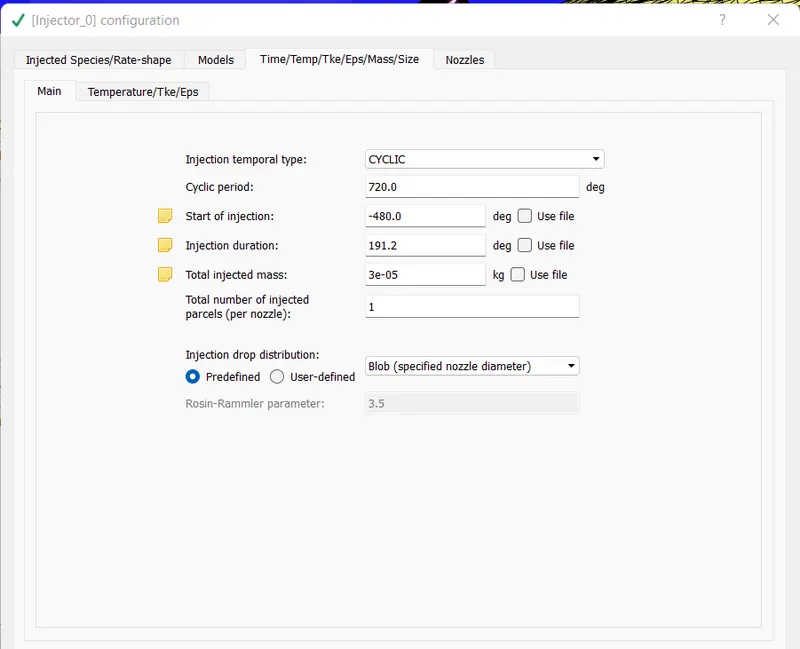
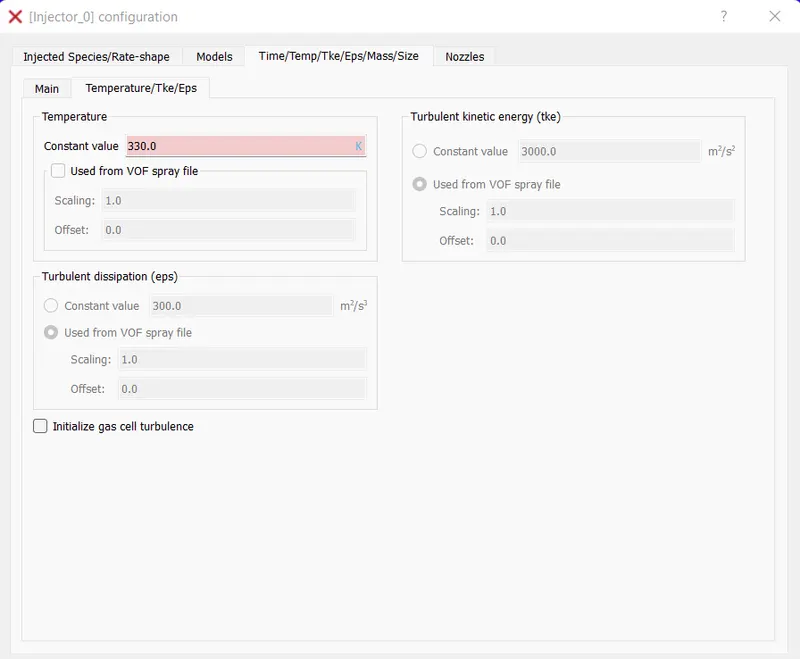
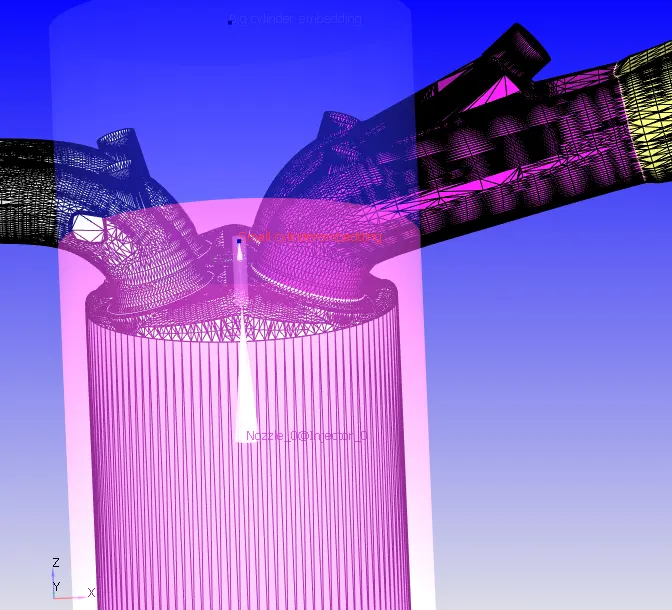
As we get the injector at the place shown in figure we use the Nozzle data and set it to near inlet port 1.
The Kelvin-Helmholtz, Rayleigh Taylor & discharge coefficient models are being used for the injection.
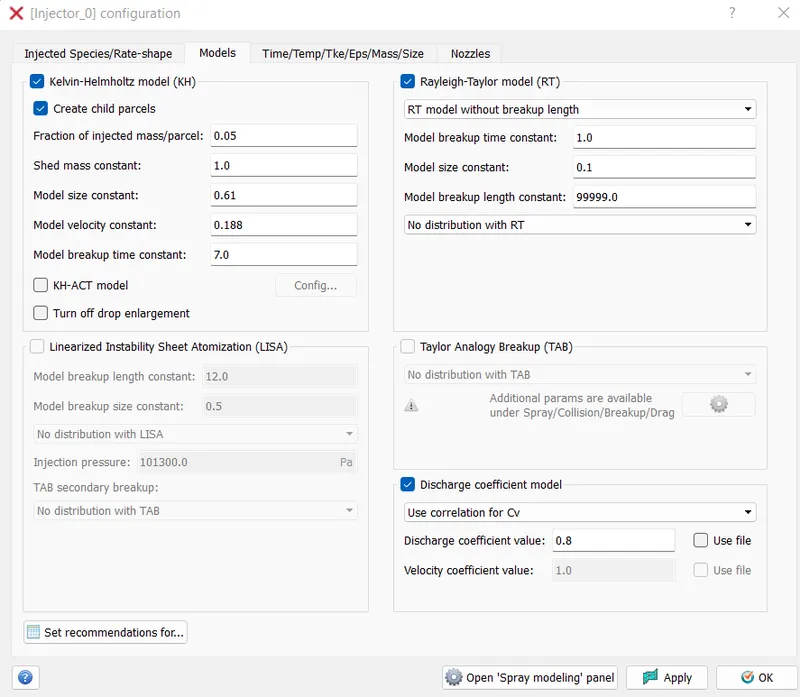
Here we are using four nozzles for spraying the fuel into the cylinder with similar specifications as follows
Nozzle diameter = 250 micro-meter
Circular injection radius = Nozzle radius
Spray cone angle = 10
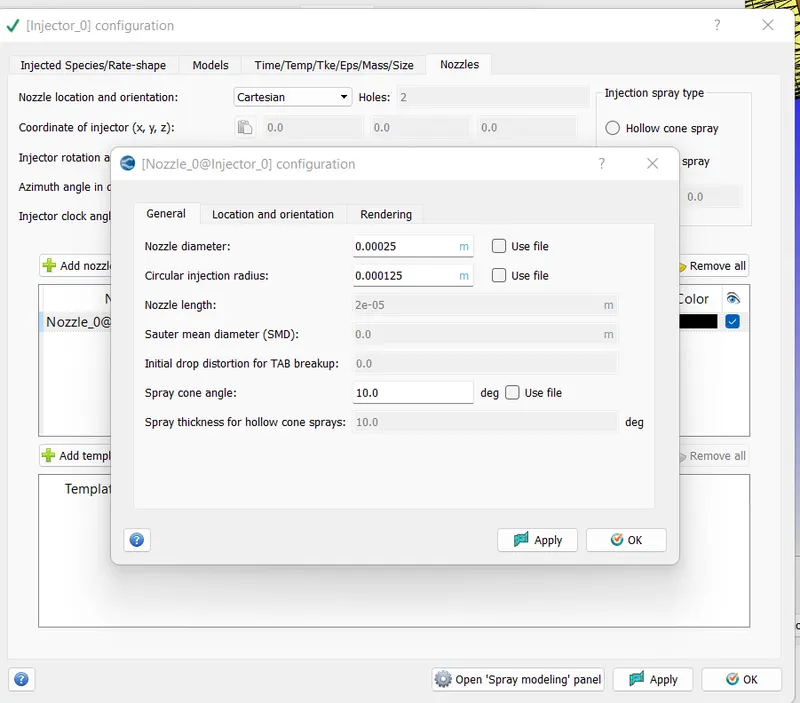
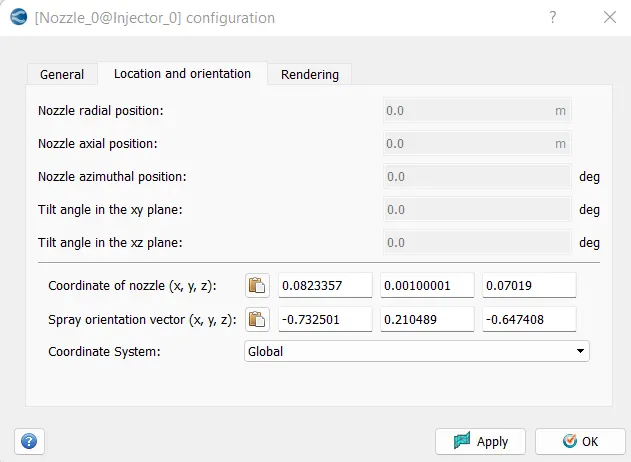
To initialize this process, co-ordinates of the injectors are needed to decide the location at which the fuel is being emerged into the cylinder. The injectors will be located in the import region-1 which is located near to the cylinder.
- Nozzle 0
- center 0.0823357 0.00100001 0.07019
- Align Vector -0.732501 0.210489 -0.647408
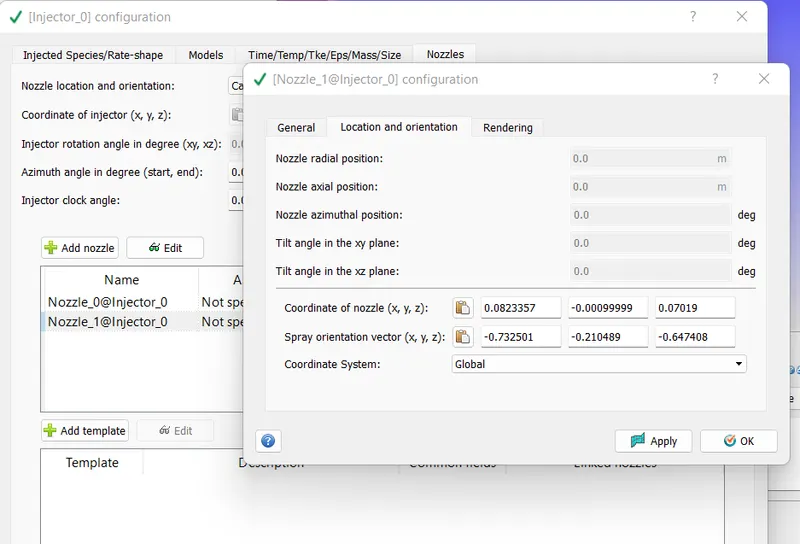
- Nozzle 1
- center 0.0823357 -0.00099999 0.07019
- Align Vector -0.732501 -0.210489 -0.647408
- Nozzle 2
- center 0.0823357 -0.0004 0.07019
- Align Vector -0.5 -0.2 -0.647408
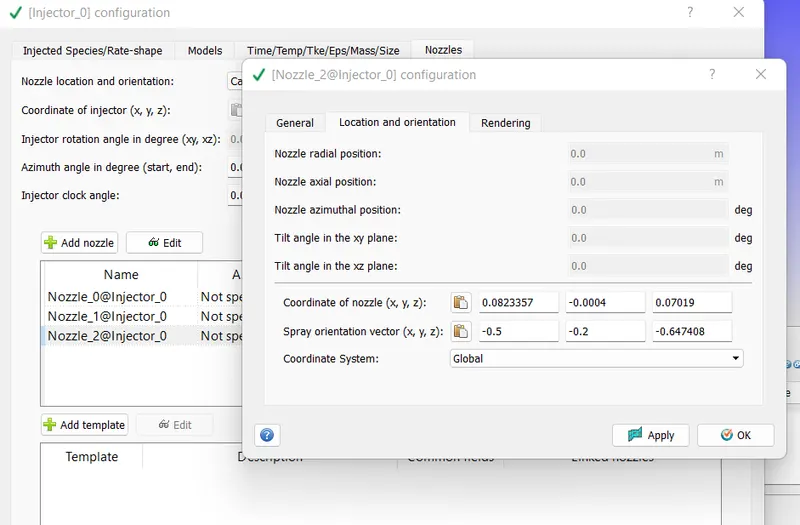
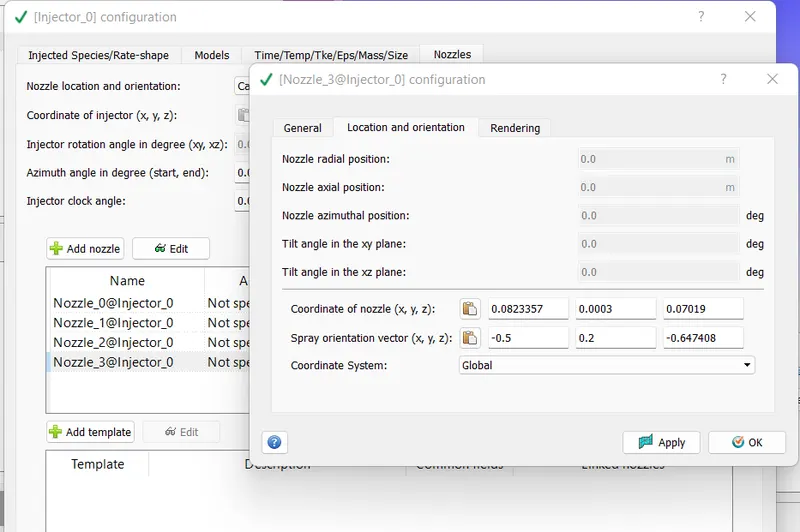
- Nozzle 3
- center 0.0823357 0.0003 0.07019
- Align Vector -0.5 0.2 -0.647408
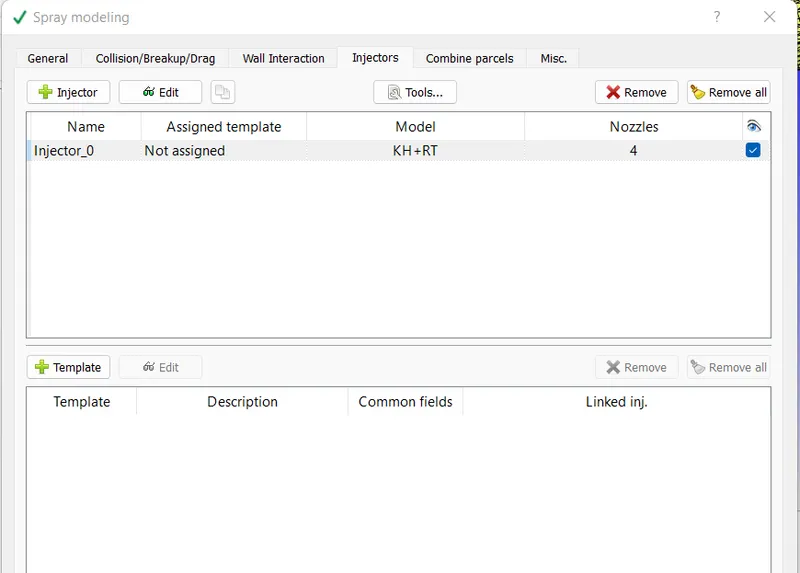
COMBUSTION MODELLING:
Converge's SAGE detailed chemistry solver uses local conditions to calculate reaction rates based on the princiles of chemical kinetics. This solver is fully coupled to the flow solver, but the chemistry and flow solver parallelize independently of one another. Which speeds up the simulation. With the appropriate mechanism, the SAGE solver can predict a wide range of cases (like a variety of fuels premixed, non-premixed, partially premixed, multiple fuels), emissions modelling and unique phenomena such as end gas auto-ignition with its accuracy and robustness, Converge can perform predictive modelling instead of merely confirming experimental results.
The next step in the modelling is the combustion modelling parameter. The values for the combustion properties like start time, end time & species is to be specified as given in the image below.
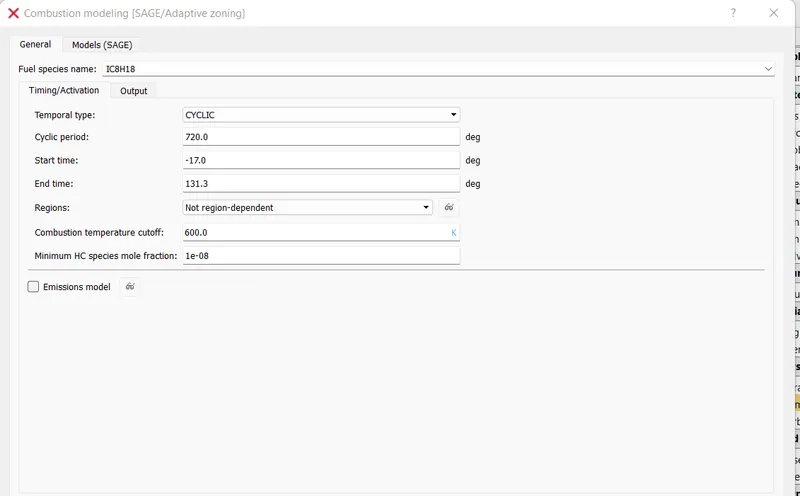
The combustion model here is taken as the SAGE model. The turbulence model is taken as RNG k-epsilon model.
SOURCE MODELLING:
Then the source of power should be specified in order to ignite the incoming fuel during the compression of the fuel. For this we select sources modelling under the physics modelling.
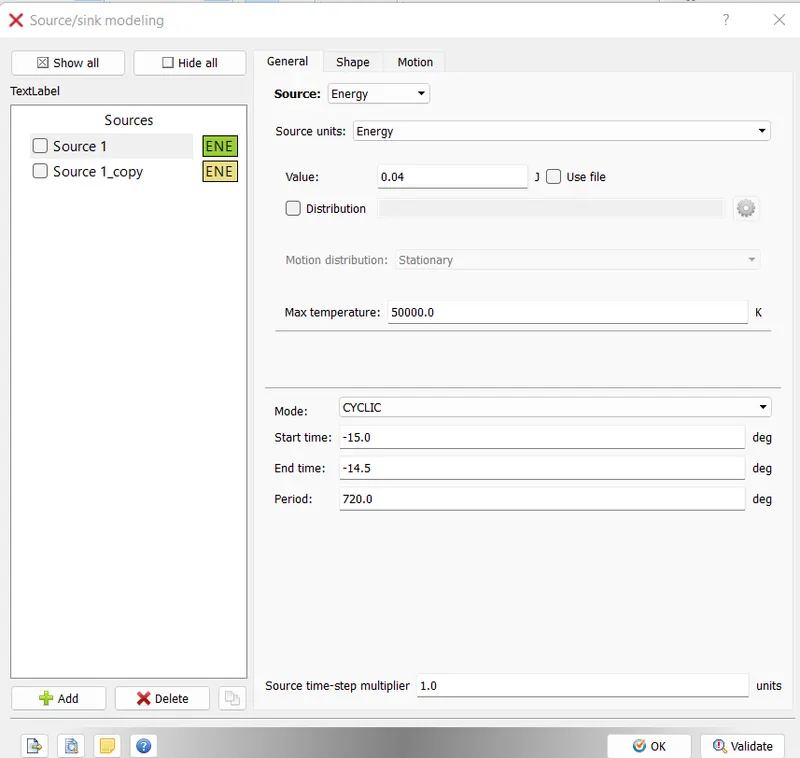
In this source modelling add two sources where both the sources have a spherical shape.
- Start of spark = -15 deg. We provide 40mJ of energy for at start for 0.5 degree
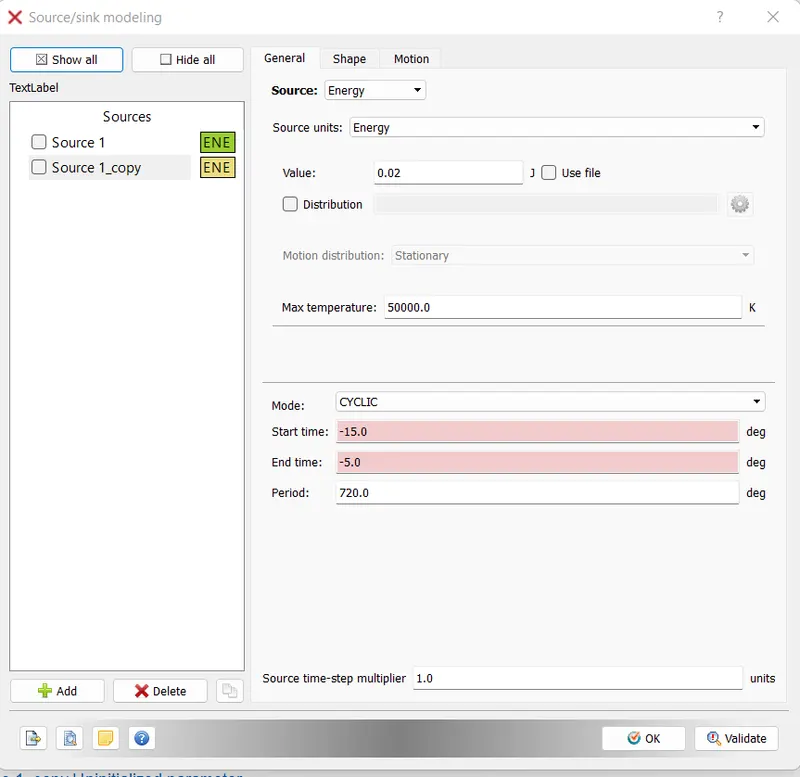
- Spark duration = 10 deg
- we provide 10mJ of energy for 10 degree for the spark
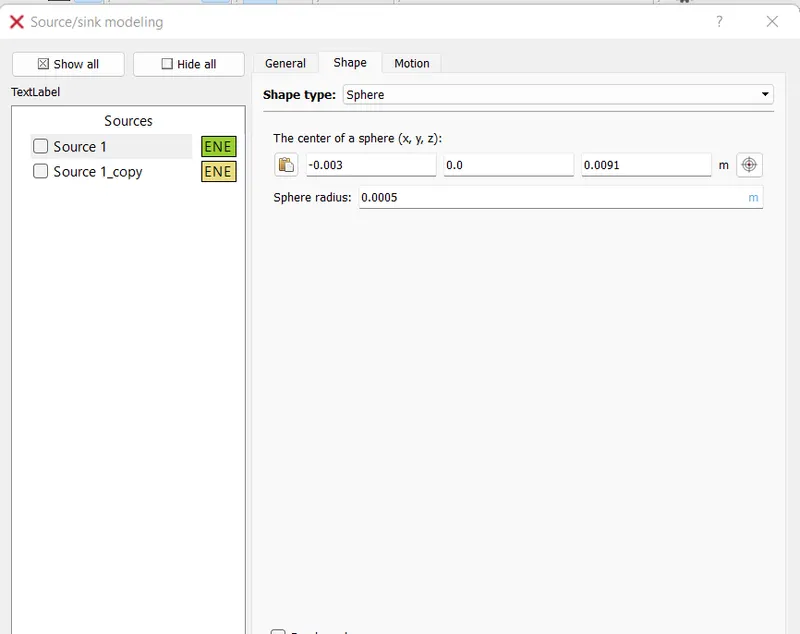
- Spark location = -0.003 0 0.0091
- Spark radius = 0.0005m
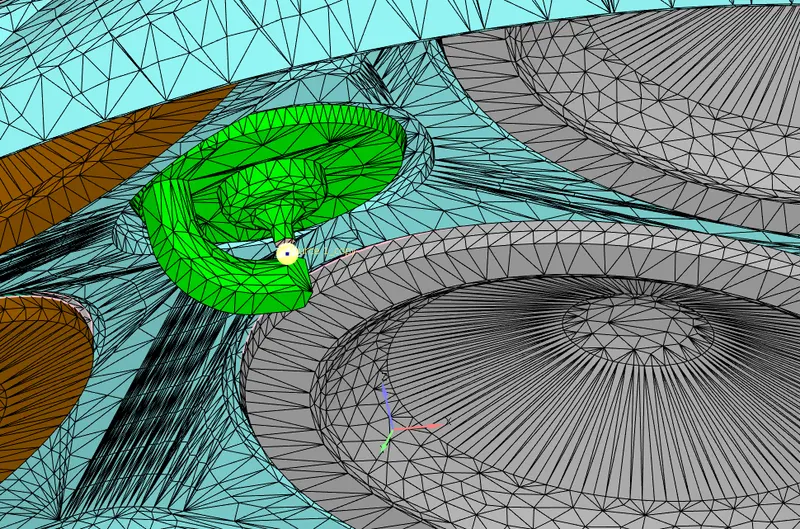
The spark location and radius specifies the spherical volume where the ignite starts.
The time interval for the spark is given in degree.
There are two sources acting for a perios of 10degrees, where for a duration of 0.5 degree both the sources act simultaneously.
This source will ignite the fuel when it is compressed inside the cylinder.
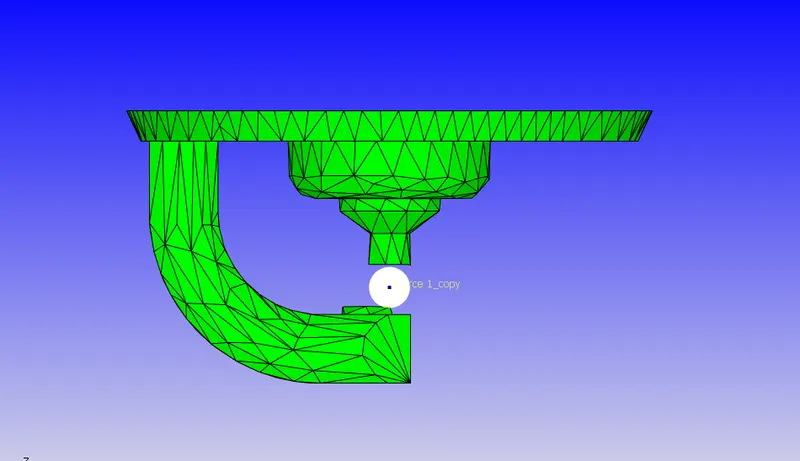
GRID SIZING:
The grid size is taken as 0.004 m or 4mm and fixed embeddings are done at critical points.
The valve angles are provided with a scaling of 3 as they are moving so close to the walls of the cylinder head.
The mesh inside the cylinder is also refined to a scale of 2 as the combustion can be computed properly.
FIXED EMBEDDING:
to refine the critical area, we can use the fixed embedding around the throttle boundary.
Fixed embedding is used to refined the grid at specific locations in the domain where a finer resolution is critical to the accuracy of the solution. Fixed embedding allows the rest of the grid to remain coarse to minimiza the simulation time.
For each fixed embedding you must specify an embedding scale that indicated how converge will refine the grid in that location. The embed scale parameter which must be a positive integer, scales the base grid sized (dx_base, dy_base and dz_base) according to dx(embed) = dx_base/2^embed_scale.
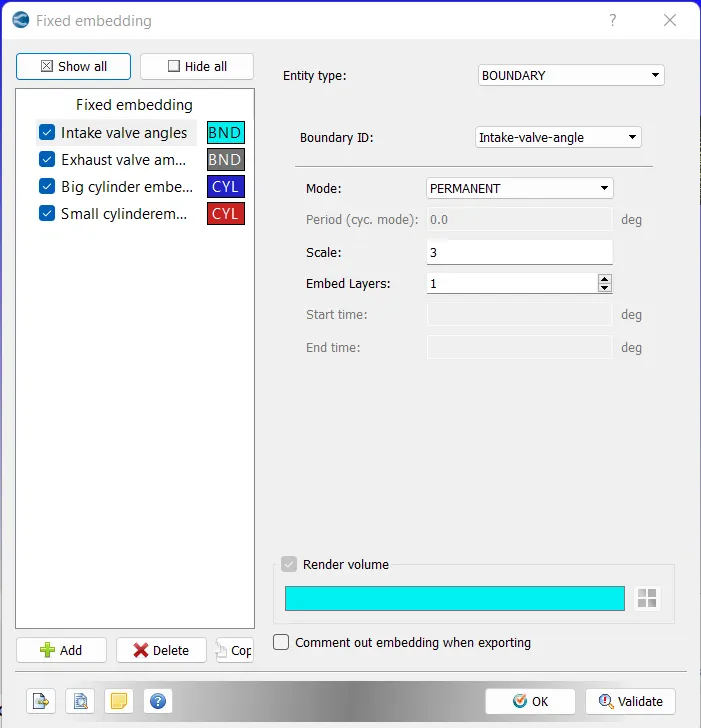
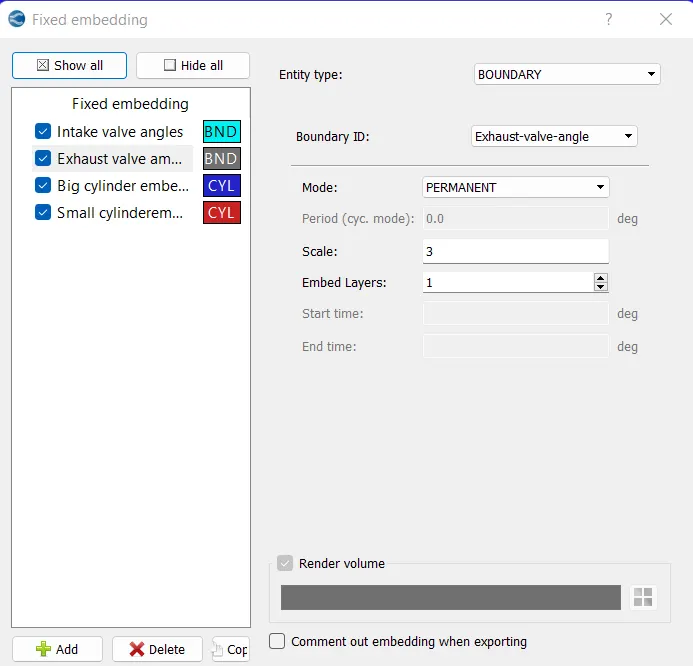
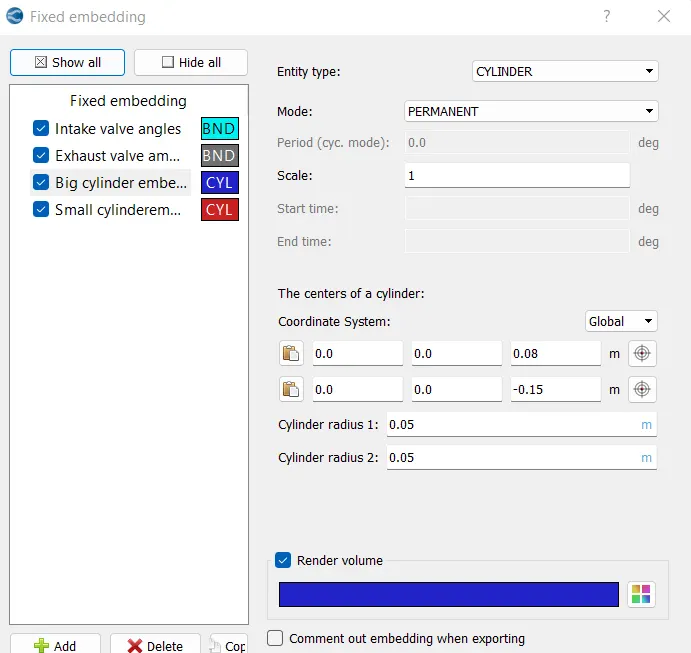
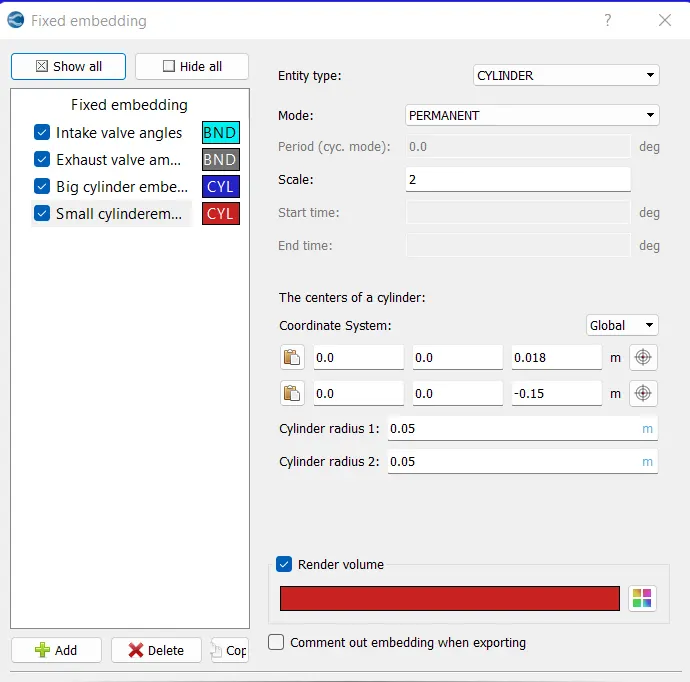
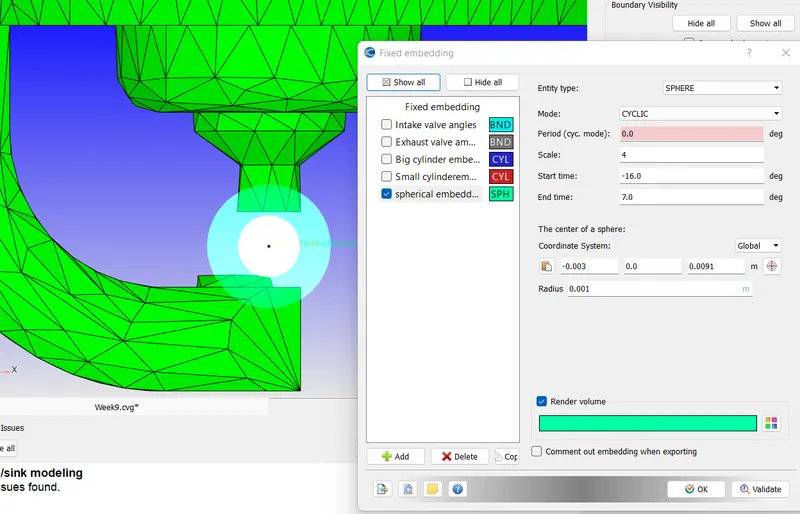
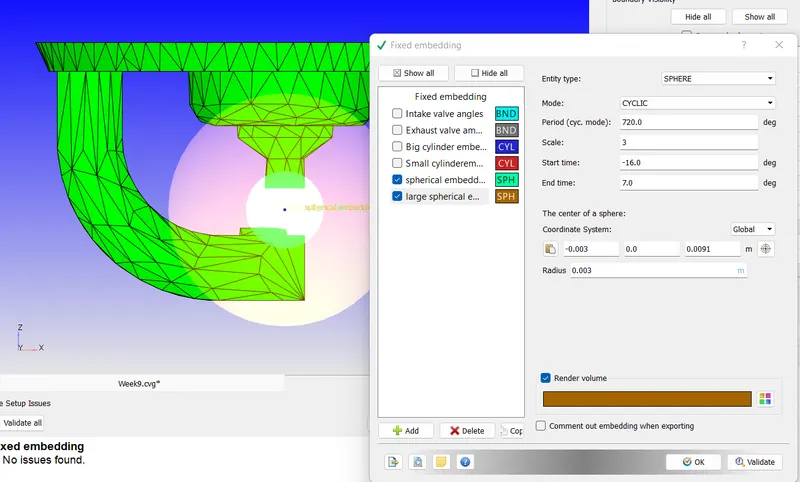
creating embedd region for spark
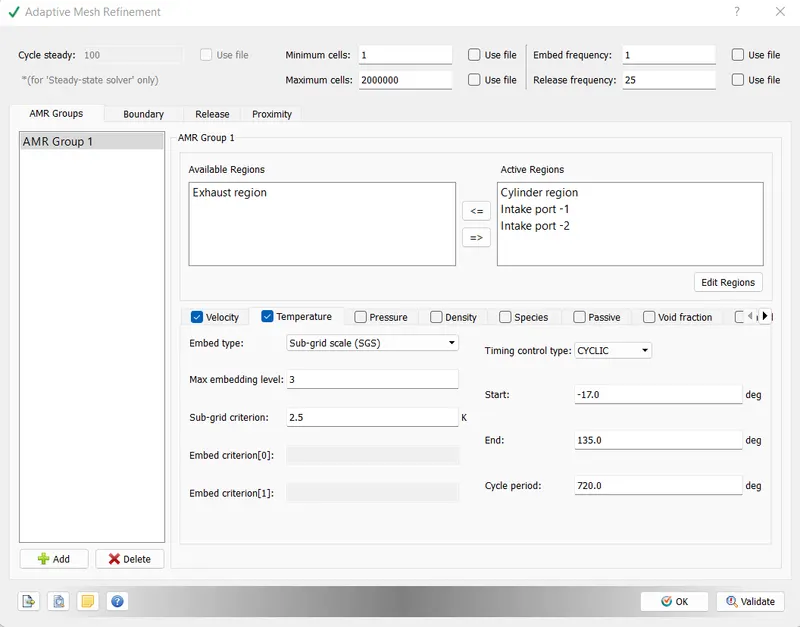
ADAPTIVE MESH REFINEMENT:
Converge's innovative Adaptive mesh refinement (AMR) technology automatically adjusts the grid at each time-step, adding cells in areas with complex phenomena and eliminating cells that are not needed to yield accurate results. This strategic refinement ensures that Converge can resolve flame fronts and high velocity flows while minimizing the overall cell count.
This AMR process adds local refinement in areas of steep field variable gradients and is now also being pursued by many of the other leading CFD software OEMs. The company calls the process "Autonomous meshing" and argues the following benefits.
1.By eliminating the process of manual mesh creation, inspection and refinement, time is saved.
2.Accuracy is improved through higher grid density where it is needed and where manual meshing strategies might not allocate it.
3.AMR provides a robust method for capturing large or rapid boundary motions.
4.AMR provides run time savings due to using an optimized number of computational cells.
5.Consistency and standardization can be achieved through the use of a consistent, algorithmic strategy for mesh production.
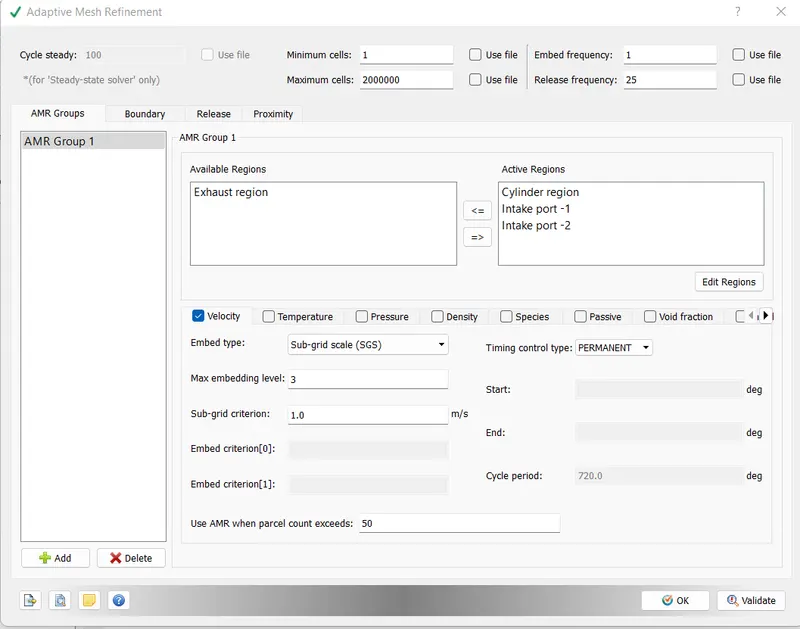
Adaptive mesh refinement is done to capture the places at which the properties of the calculation are critical.
The refinement is made to be adaptive for velocity and temperature.
The parameters for bothe the properties are specified so that the mesh adapts the values from the specification to refine the places where the values tend to be within the specified parameter.
MOTIONS OF THE ENGINE:
An internal combustion engine in which the piston completed four separate strokes while turing the crankshaft. A stroke refers to the full travel of the piston along the cylinder in either direction. The four separate strokes are termed as
1.INTAKE STROKE: Also known as induction or suction stroke. This stroke of the piston begins at TDC and ends at BDC. This this stroke the intake valve must be in the open position while the piston pulls an air-fuel mixture into the cylunder by producing the vacuum pressure into the cylinder through its downwards motion. The piston is moving down as air is being sucked in by the downward motion against the piston.
2.COMPRESSION STROKE: This stroke begins at BDC or just at end of the Intake stroke, and ends at TDC. In this stroke the piston compresses the air-fuel mixture in preparation for ignition during the power stroke. Both the intake and exhaust valves are closed during this stage.
3.COMBUSTION STROKE: Also known as power or ignition. This is the start at the second revolution of the four stroke cycle. At this point the cranksgaft has completed a full 360 degree revolution. While the piston is at TDC i.e at end of the compression stroke the compressed air-fuel micture is ignited by a spark plug (in gasoline engine) or by heat generated by high compression (in diesel engines), forcefully returning the piston to BDC. This stroke produces mechanical work from the engine to turn the crankshaft.
4.EXHAUST STROKE: Also known as outlet stroke. During the exhaust stroke, the piston once again returns from BDC to TDc while the exhaust valve is open. This action expels the spent air-fuel mixture through the exhaust valve.
COMPRESSION RATIO OF THE ENGINE:
Compression ratio, in an internal combustion engine is the degree to which the fuel mixture is compressed before ignition. It is defined as the maximum volume of the combustion chamber (with the piston farthest out, or bottom dead centre) divided by the volume with the piston in the full compression position (with the piston nearest to the head of the cylinder or top dead center).
A compression ratio of six means the mixture is compressed to one-sixth its original volume by action of the piston in the cylinder. The maximum possible ratio based on cylinder dimensions may not be achieved if the intake valve closes after the piston begins its compression stroke, as this would cause the backflow of the combustion mixture from the cylinder. A high ratio promotes efficiency but may not cause engine knock.
Using the plot for volume of the cylinder region, we can find the maximum volume and the minimum volume which can be used to calculate the compression ratio.
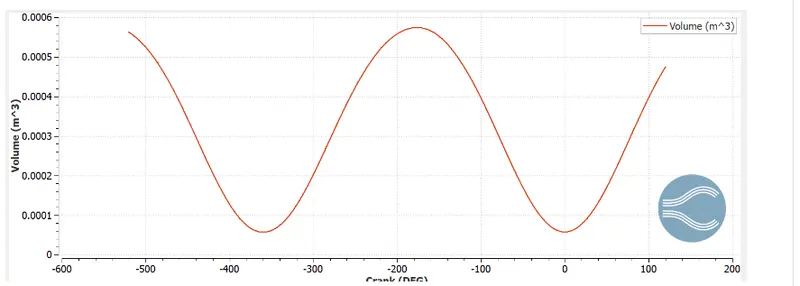
compression ratio=max volume/min volume
=0.0005742195/5.7539186e-5=9.98
NEED FOR WALL HEAT TRANSFER MODEL:
Internal combustion engines are now extremely optimized in such a ways improving their performance is a costly task. Traditional engine improvements by experimental means is added by engine thermodynamic models, reducing experimental and total project costs. For thode models, accuracy is mandatory in order to offer good prediction of engine performance.
Modelling of the heat transfer and wall temperature is an important task concerning the accuracy and the predictions of any engine thermodynamic model, although it is many times an overcome task. In order to perform good prediction of engine herat transfer and wall temperature, models are required to accomplish heat transfer from hot gases to engine parts, heat transfer inside each engine part and also heat transfer to coolant and lubricating oil.
WHY CAN'T WE PREDICT THE WALL TEMPERATURE FROM THE CFD SIMULATION:
The detailed CFD modelling methodology was developed using Fluent, Eulerian two-phase flow model is used to model the flow and heat transfer phenomena. In order to gain the peak wall temperature accurately and stably, the effect of different turbulence models and wall functions are investigated based on different grids. Results show that O type grid should be used for the simulation of CHF(critical heat flux) phenomenon. Grids with Y+ larger than 70 are recommended for the CHF simulation because of the acceptable results of all the turbulence models while grids with Y+ lower than 50 should be avoided. To predict the dry-out position accurately in a fine grid, Realizable k-epsilon model with standard wall function is recommended. These conclusions have some reference significance to better predict the CHF phenomena of vertical pipe. It can also be expanded to rod bundle of boiling water reactor by using same pressure condition.
So the wall temperature obtained using the CFD calculations are the temperature of the fluid near to the wall of the cylinder, which is not the best result. This the wall heat transfer model is used to predict the wall temperature.
CALCULATION OF COMBUSTION EFFICIENCY OF THE ENGINE:
In real engine applications, the combustion process is incomplete. This means that not all the energy content of the fuel supplied to the engine is released through the combustion process. There are several factors which can influence the combustion process, the most important being the fuel-air intake and fuel atomization (size of droplets). The fuel inside the cylinder needs air (oxygen) to burn. If there is not enough oxygen available, not all the fuel is burnt, therfore only a partial energy is released from combustion (say around 96%).
If we analyze the exhaust gas of an internal combustion engine, we see that it contains both incomplete cpmbustion products (CO, NOx, unburnt hydrocarbons, soot PM) and complete combustion products (CO2 and H2O).
The combustion efficiency `etac` is defined as the ratio of between the energy released by the burnt fuel and the theoritical energy content of the fuel mass during one complete engine cycle.
`etac = (B.P)/(mf*Cv)`
where B.P = brake power
mf = Mass of fuel supplied kg/sec
Cv = calorific value of fuel J/Kg
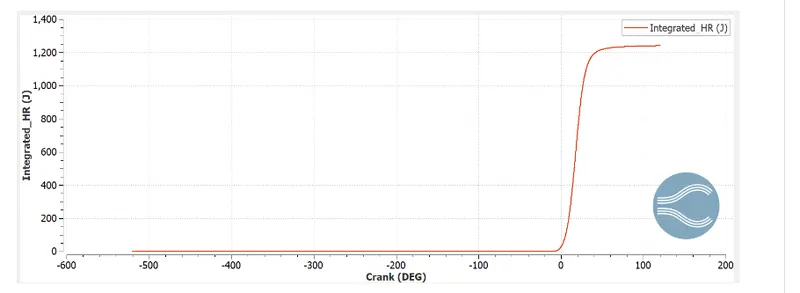
Cv=44000 KJ/Kg
mf = 3e-5 Kg
`etac = (1.241)/(44000*3e-5)`
`etac=0.94` i.e 94%
USING ENGINE PERFORMANCE CALCULATOR TO DETERMINE THE POWER AND TORQUE OF ENGINE:
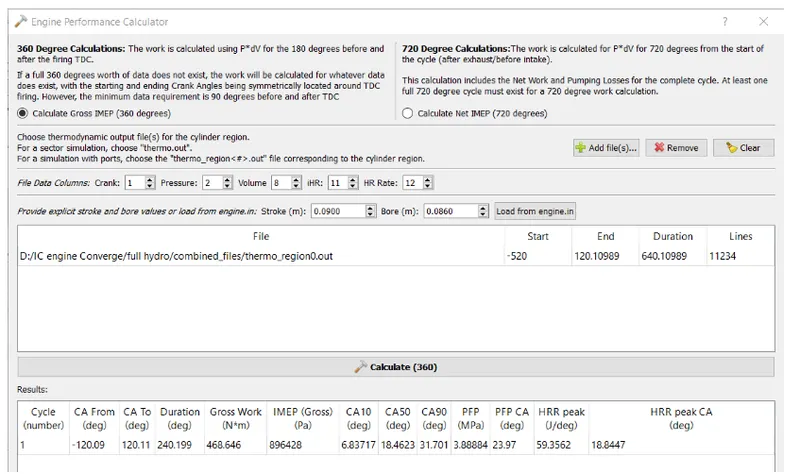
To open the performance calculator go to line plotting in converge CFD.
Go to tools>Engine calculators>Engine performance
Give the thermo.out file for the cylinder region as the input file for calculating the engine's performance.
Power calculation:
To calculate power we can use the formula `Power =`work / sec.
From performance calculator we can take:
Work = 486.6 Nm
Start time = -120.09 deg
End time = 120.11 deg
Total duration = 240.199 deg
Total rotation per minute (RPM) = 3000
Rotation per second = 3000/60 = 59
Total degree per second = 50*360 = 18000
Time in sec = 240.199/18000 = 0.01334 sec
Power = 486.646/0.01334 = 35120 KJ or 35.13 KW
Torque Calculation:
Power = `(2pi*N*T)/(60)`
`T = (P*60)/(2*pi*N)`
N = 3000 RPM
T = 35.13x1000x60/2x3.14x3000 = 2107.8/18840 = 111.8 N-m
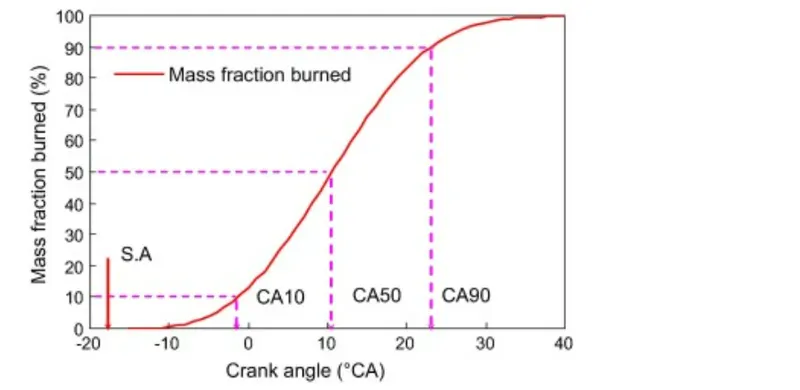
SIGNIFICANCE OF CA10, CA50 AND CA90:
Combustion phasing angles of 10%, 50% and 90% of heat release (Ca10, Ca50 and Ca90) are determined by integrating the AHRR (apparent heat release rate). Crank angles between Ca10 and Ca90 (Ca 10-90) are calculated to analyze combustion duration.
In simple words CA10 means that 10% of the combustion takes place in initial stages of simulation/combustion process.
CA50 means that 50% of the combustion took place in half of simulation/combustion cycle.
CA90 means that 90% of the combustion takes place in end stages of simulation/combustion process.
PLOTS OF FLOW PROPERTIES AT COMBUSTION CHAMBER:
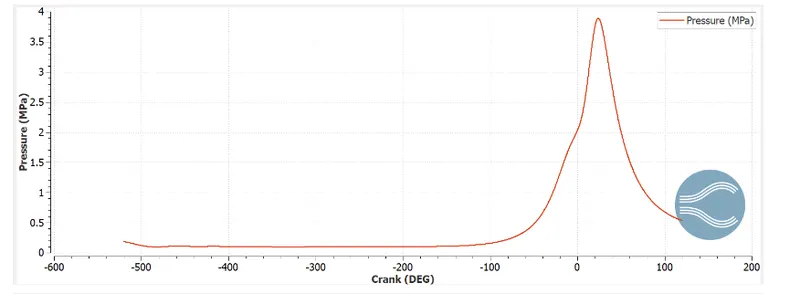
From the pressure plot, we can see that the prssure only varies a little until the ignition occurs. Once the ignition starts, the pressure inside the combustion chamber increases at a faster rate and reaches a maximum value when the chamber volume is minimum. Then after the power stroke, the piston moves apart increasing the volume which inturn decreases the pressure to the initial value.
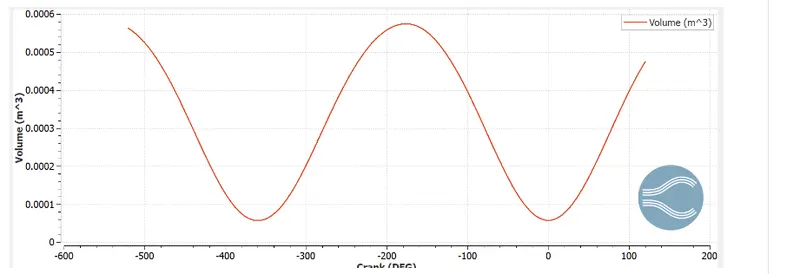
The volume of the combustion chamber follows a uniform wave from where the volume increases and decreases at the same rate. The piston follows a linear to and fro motion which controls the volume of the combustion chamber.
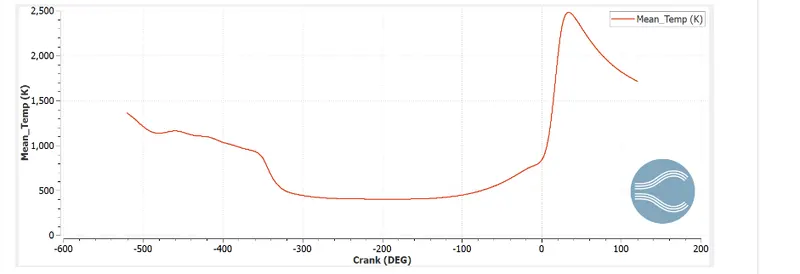
The temperature graph at the beginning have a low temperature which gets decreasing further as after an exhaust stroke the high temperature emissions take place by decreasing the temperature inside the chamber.
Once the chamber gets all the exhaist gas out, the temperature inside the chamber remains unchanged for a certain period of time until the ignition starts. Once the source of heat is released to the fuel particles from the spark plug, the temperature spreads to all the fuel particles there by increasing the temperature inside the chamber.
EMISSION OF DIFFERENT GASES:
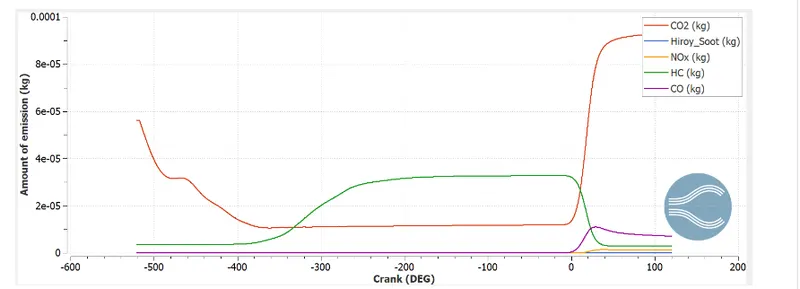
This plot shows us the amount of emission occuring in an IC engine. We can see various materials of gas getting released at the exhaust port. The main gas particles are plotted in the graph above.
We can see a high amount of CO2 emission at the end of the power stroke. The NOx emissions can also be read through this graph and proper actions can be taken if there are any emissions higher than the limited amount.
POST PROCESSING RESULTS:
The Mesh looks as follows
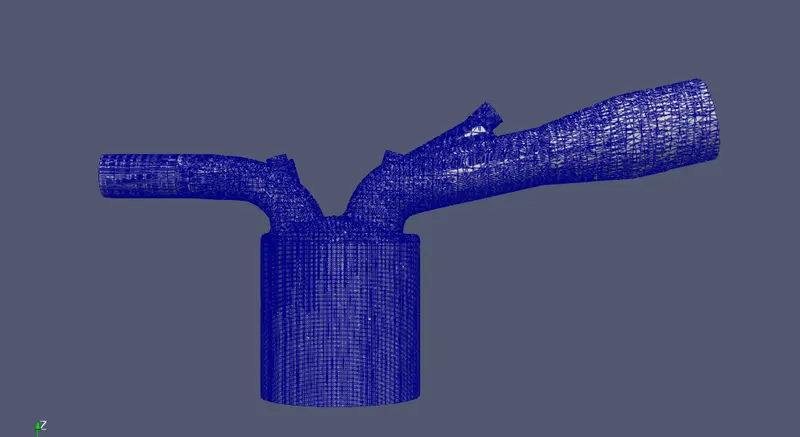
The embedding given to the base grid gives us a finer and neat finish along some critical areas where the calculated values may be more important.
The embedding at the nozzles is clearly showing the refined mesh in the images. Similarly, embedding around the spark plug is also refined which can be clearly seen in the other image.
Other embeddings and adpative mesh refinement can be clearly seen through animation where we can see the refined mesh changing according to the SGD paramter which is specified for both velocity and temperature values during the calculation.
From the animation we can see that after ignition the mesh near the the walls gets refined as the SGS paramters specified matches the requirement whicn the temperature suddenly raises near the wall.
The valve movements and the piston movements is clearly following the data given during the case set-up. The sparay of the fuel particles are timed so that the particles get into the chamber when the compression takes place.
As the inlet valves moves to open up the space between the inlet port and the combustion chamber, the fuel particles moves through the opening into the chamber.
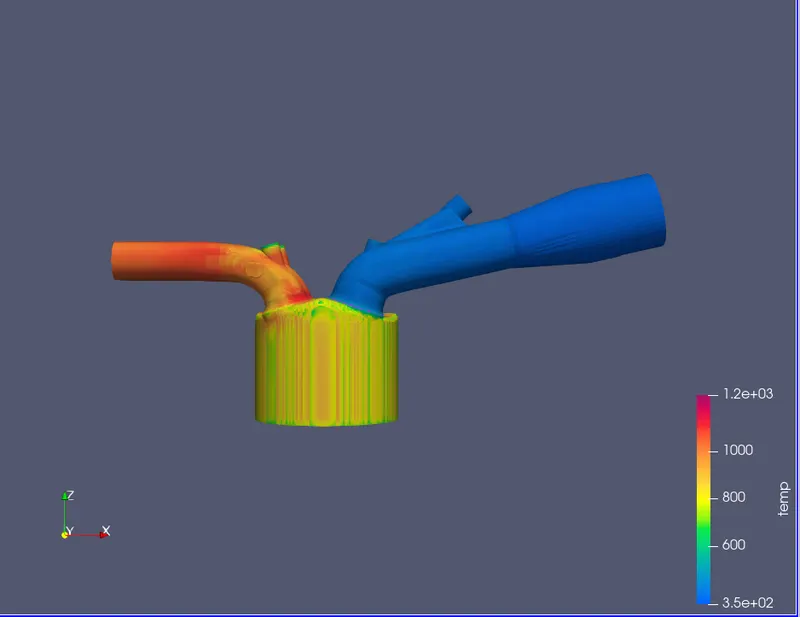
The combustion chamber initially has a medium temperature as the exhaust stroke ends. The temperature in the exhaust port can be found to be maximum at the beginning. This is because of the high temperature emission of the exhaust gases through the exhaust port.
The intake port has a minimum value as it sprays the fuel particles into the chamber. During expansion the temperature inside the chamber gradually decreases and attains a minimum value.
Once all the particles enters the chamber the inlet valve closes and the piston moves up to compress the fuel. At this time the temperature is gradually increasing.
At the time of ignition there is a sudden increase in the temperature which spreads through out the chamber and the heat is transferred to the walls of the combustion chamber.
CONCLUSION:
Thus, the compression ratio, combustion efficiency, Torque and power are calculated and the contours and spray from inlet along with combustion model & source model has been studied successfully for full hydrodynamic model.