Week 10: Project 1 - FULL HYDRO case set up (PFI)
Aim:-FULL HYDRO case set up (PFI)
objecive :- run full hydro simulation for previoulsy done set up before that ned to ad spay modeling and combution modeling
With the inputs provided in the challenge description, find out the following
1. What is the compression ratio of this engine?
2. Why do we need a wall heat transfer model? Why can't we predict the wall temperature from the CFD simulation?
3. Calculate the combustion efficiency of this engine
4. use the engine performance calculator, to determine the power and torque for this engine.
theory :-most of the theory behind ic engine were discuused in previous challenge
here covering spay modeling and combution modeling used in converge simulation\
combustion modeling:-
CONVERGE’s SAGE detailed chemistry solver uses local conditions to calculate reaction rates based on the principles of chemical kinetics. This solver is fully coupled to the flow solver, but the chemistry and flow solvers parallelize independently of one another, which speeds up the simulation. With the appropriate mechanism, the SAGE solver can predict a wide range of cases (e.g., a variety of fuels [premixed, non-premixed, partially premixed, multiple fuels], emissions modelling, and unique phenomena such as end-gas auto-ignition).
spray modeling:-
CONVERGE has two types of liquid injection parameters: nozzles and injectors. An injector is a group of nozzles. In CONVERGE you can set up local coordinate systems, which help you intuitively configure and manipulate the geometry of the nozzles within an injector. In applications such as internal combustion engines, the fuel spray initiates, propagates, and dissipates very quickly and on a very small spatial scale. To dynamically capture the important physics of the injection process, you need a high-density grid around the spray. However, you do not need high resolution far from the spray or before fuel is injected. Our automated Adaptive Mesh Refinement (AMR) technology provides the resolution you need exactly when and where you need it: in spray cases, near the injector and along the path of the spray. The combination of AMR and powerful spray models makes CONVERGE uniquely suited to helping you achieve grid convergent results in a timely manner.
case set up
the surface preparation and boundary flagging were done in previous challenge and ran for no hydro simulation if the simulation ran without any error then move to full hydro simulation. in this full hydro simulation need to add spray modelling and cumbustion modelling that set will be discused here
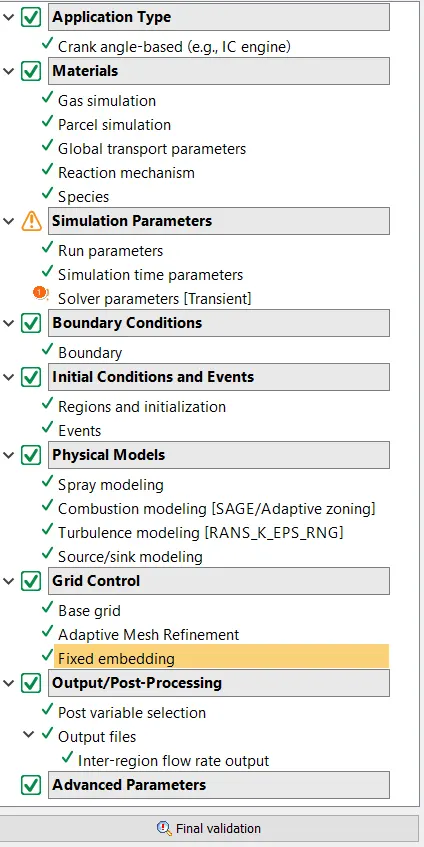
case set up tree
in above set up we can see new addtion from the previous set up lijke spraye modeling combution modeling adaptive mesh refinement and source/sink modeling
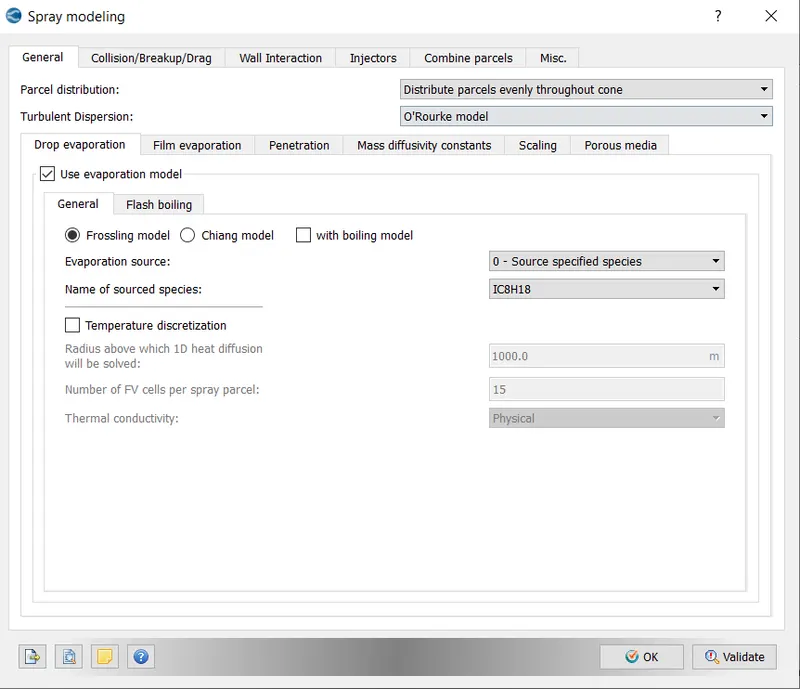
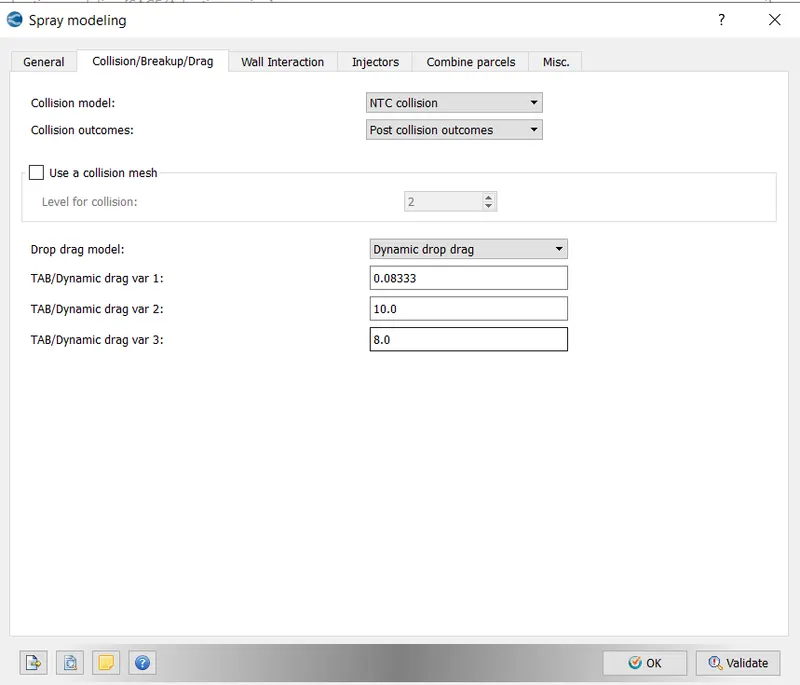
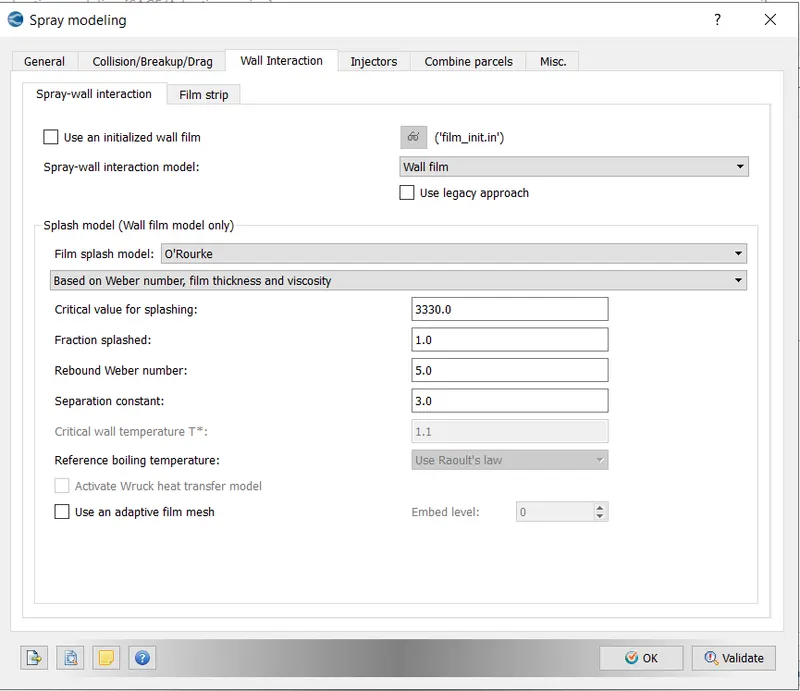
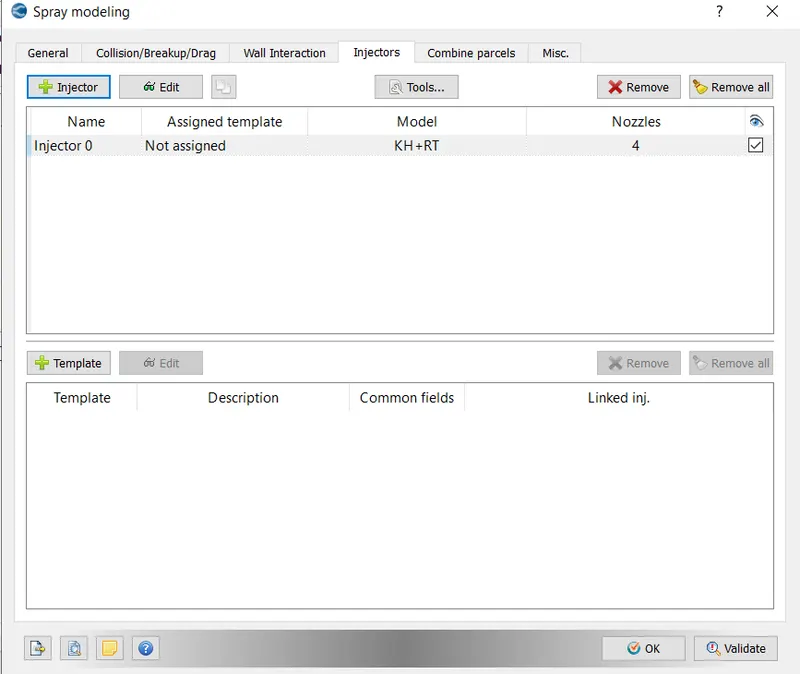
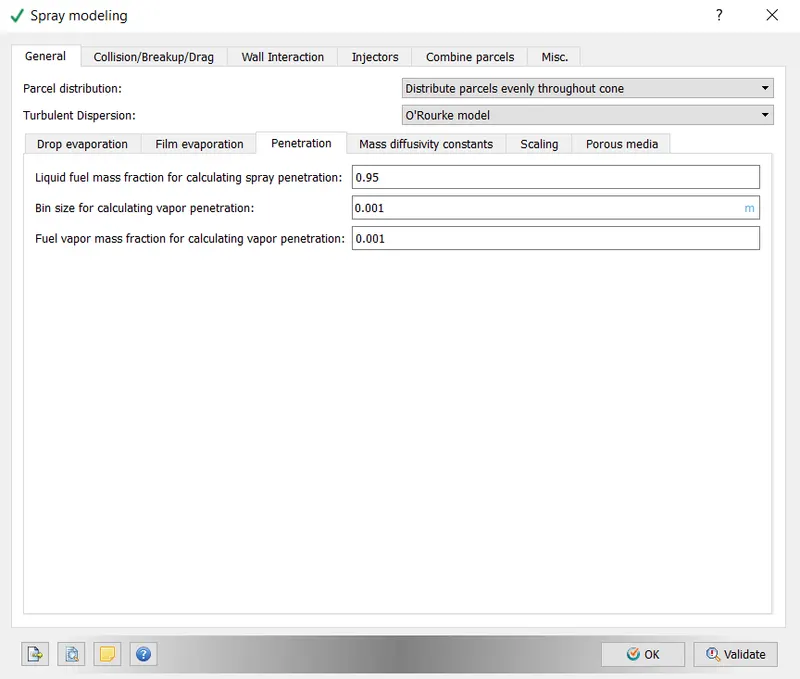
spray modeling
in this set up we can see type of parcel, reaction of parcel afte being hit to a wall and spraye length were defined in this set up
combustion modeling
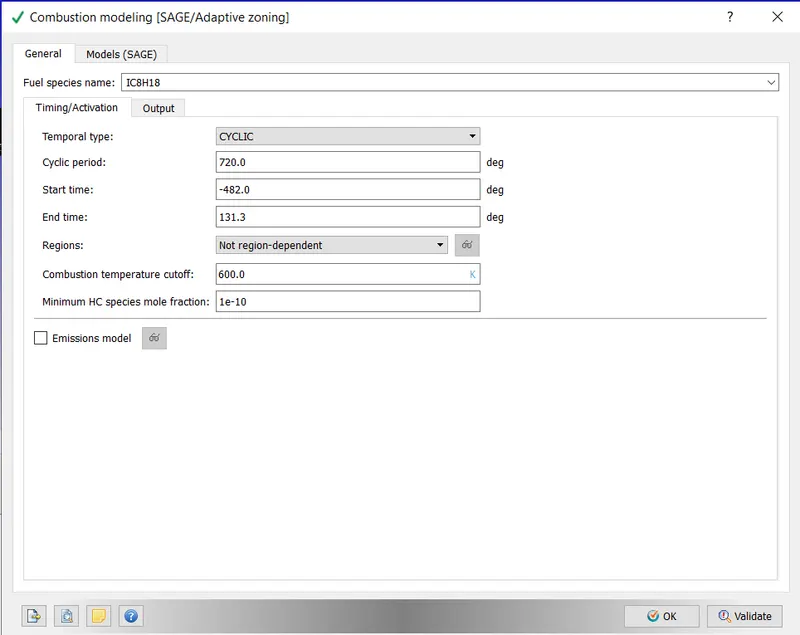
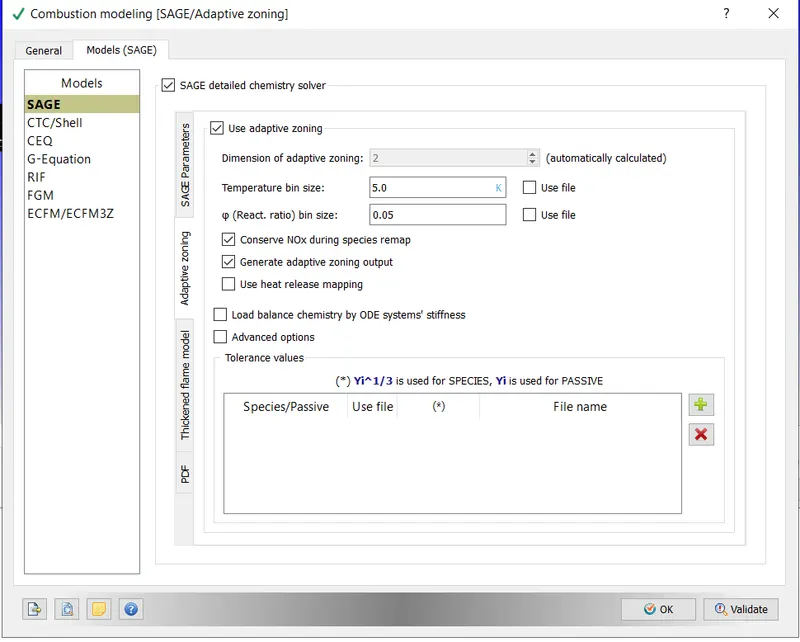
cumbustion modelling
here we use SAGE cumbustion modeling
adaptive mesh refinement
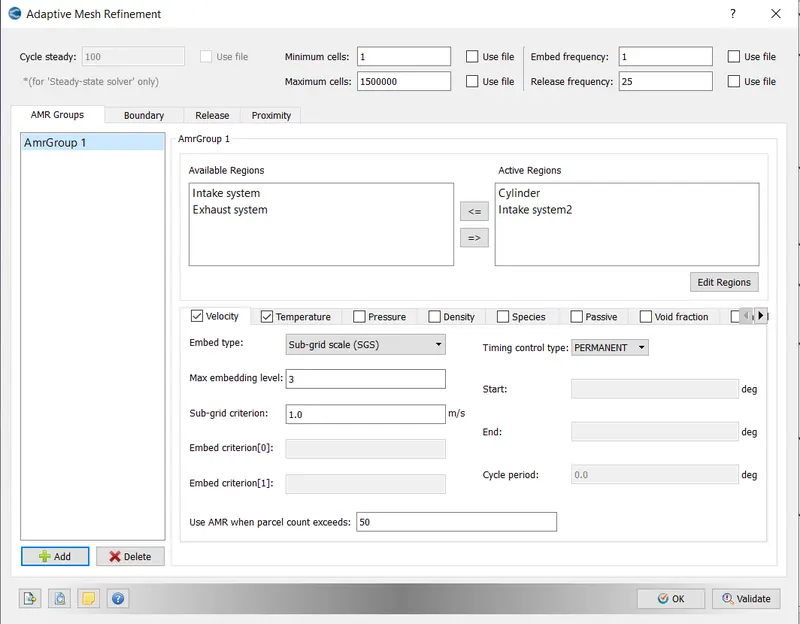
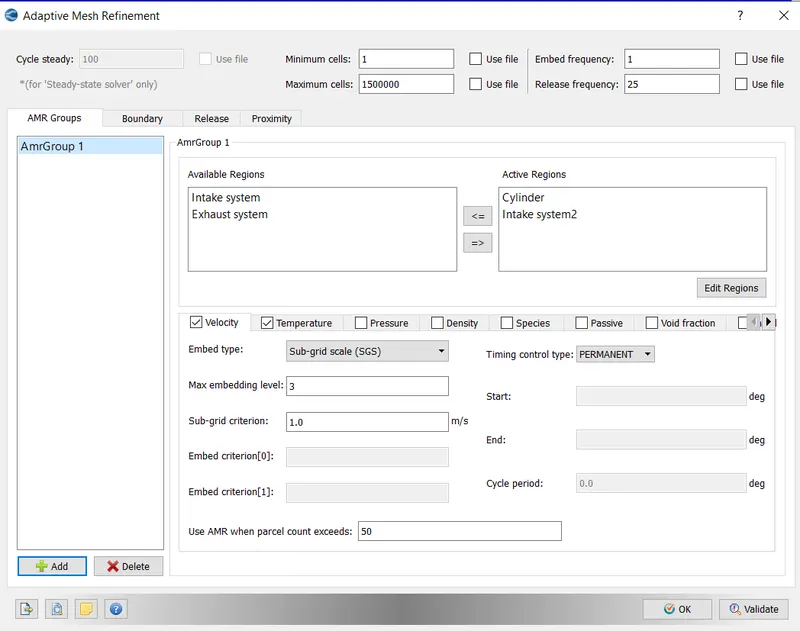
adaptive mesh refinment
mesh refinement using SGS (temprature and velocity)
validate the set up if any error present the resolve them and export the input file to a folder
open cygwin navigate to perticular folder and run solver
result:
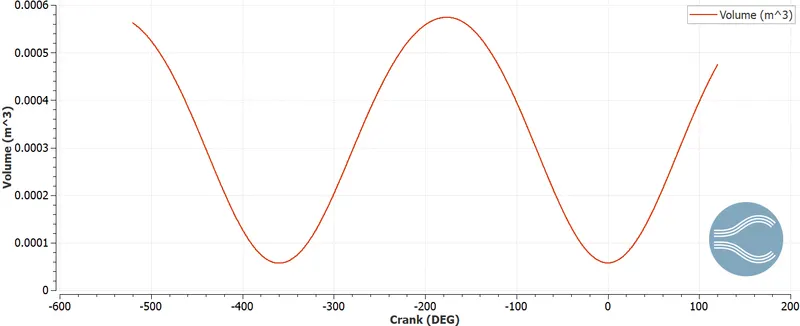
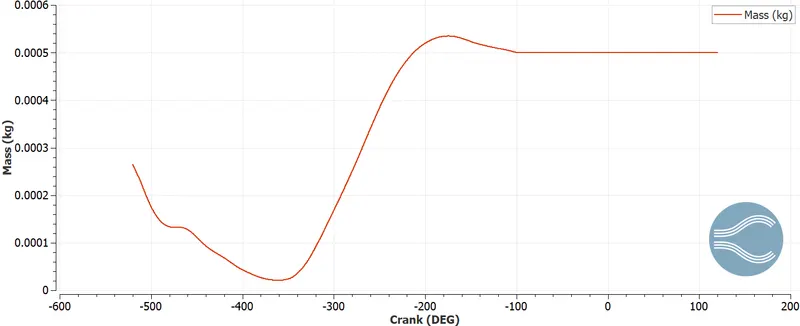
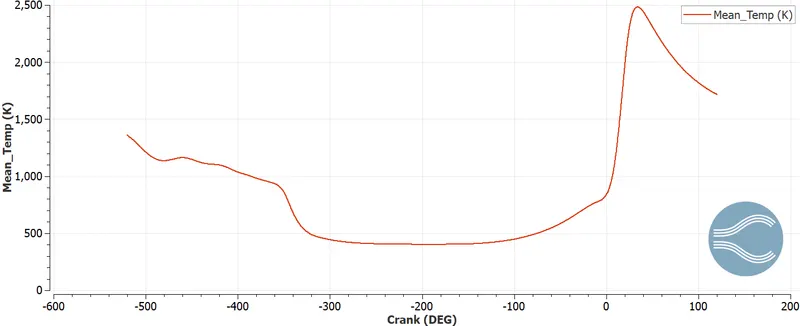
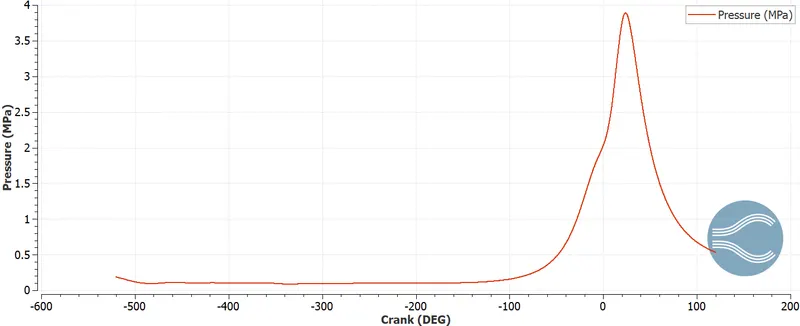
volume,temprature, mass flow rate and pressure in region 0 i,e cylinder
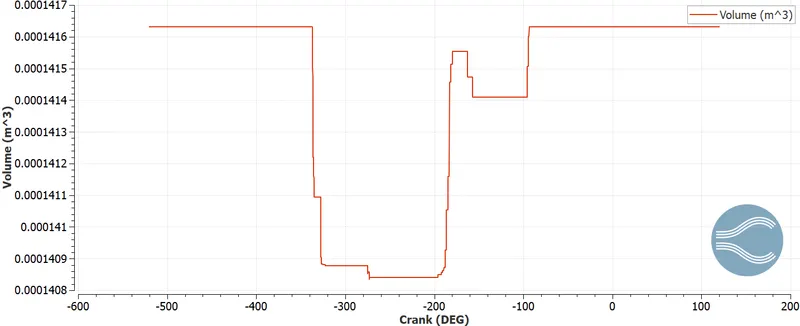
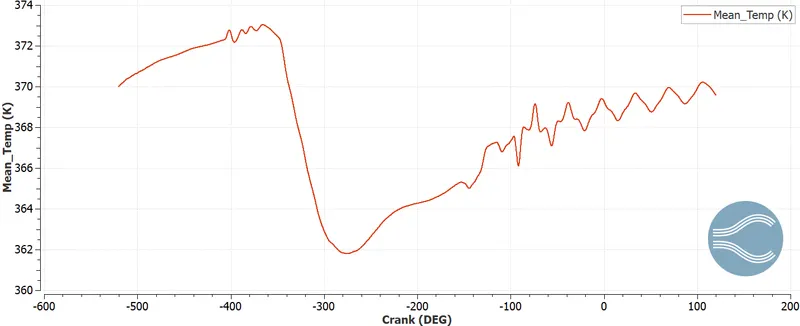
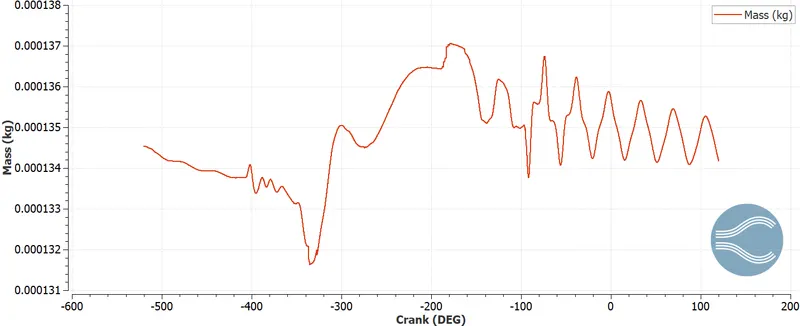
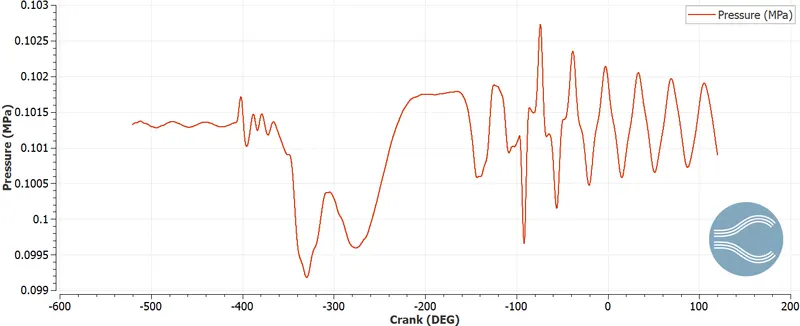
volume,temprature, mass flow rate and pressure in region 1 ie intake port 1
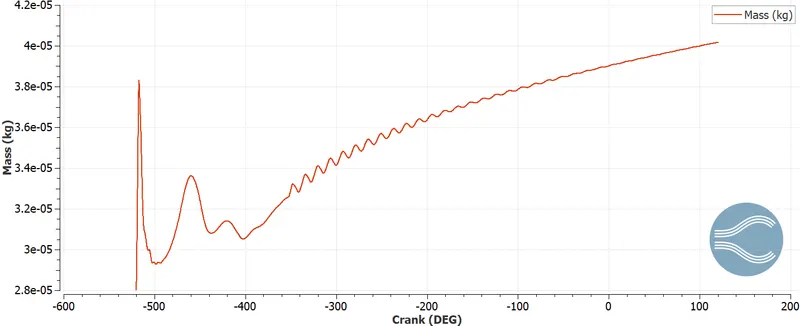
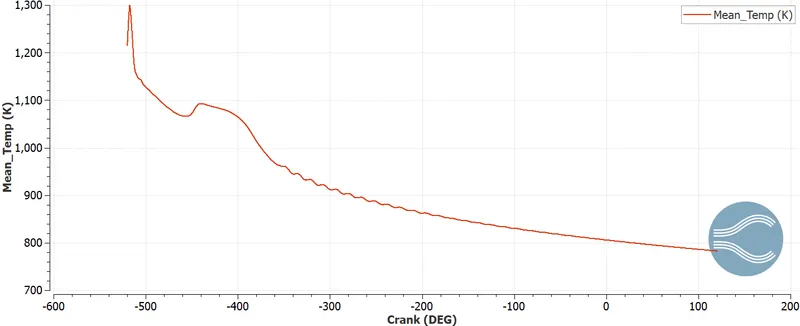
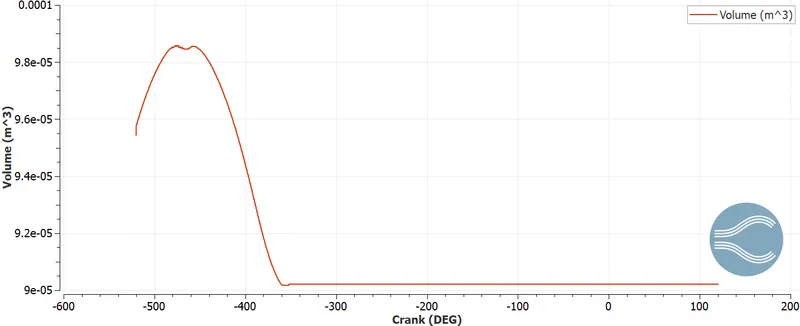
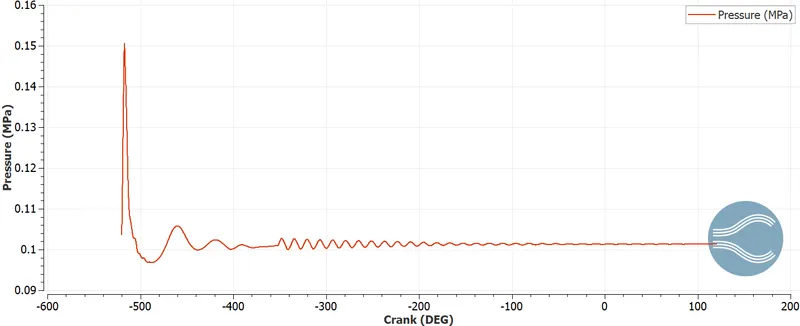
volume,temprature, mass flow rate and pressure in region 2exhaust port
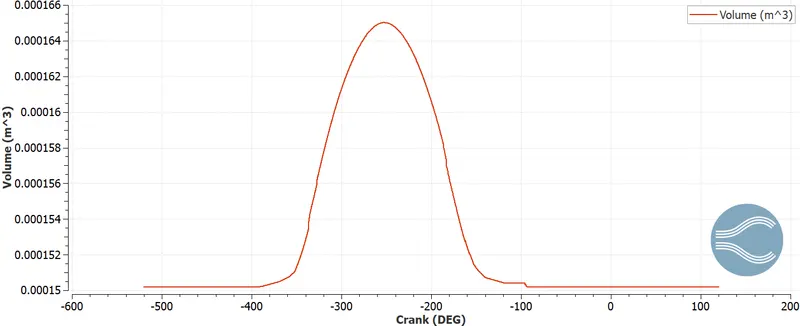
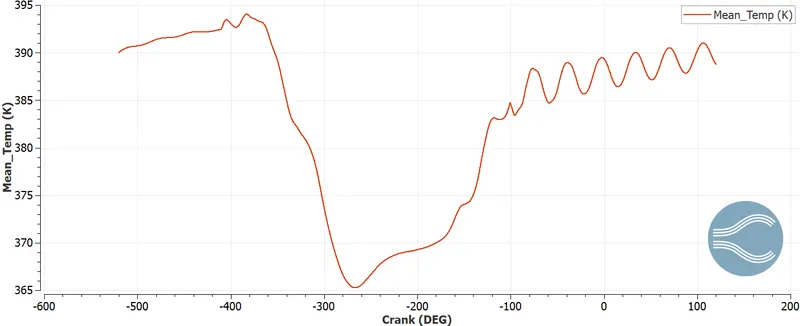
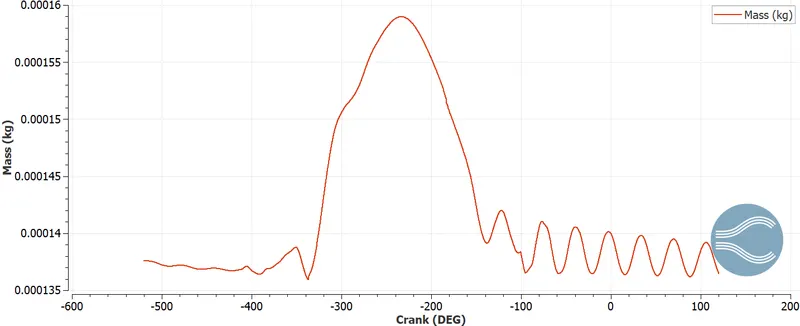
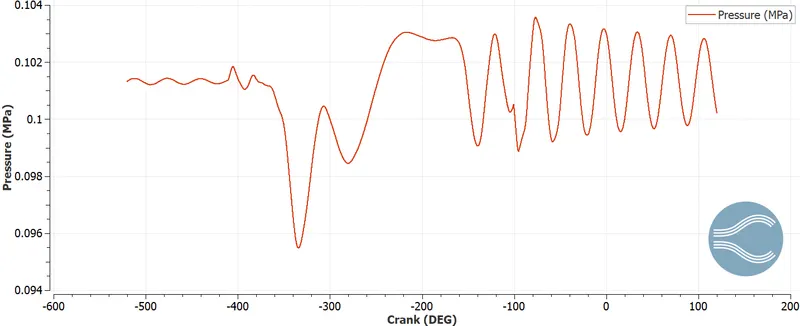
volume,temprature, mass flow rate and pressure in region 3 i e intake port 2
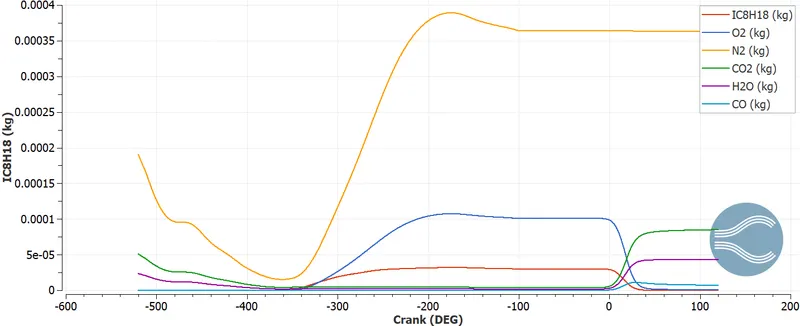
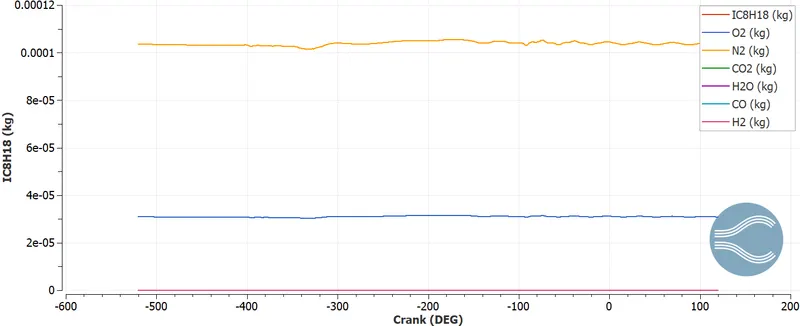
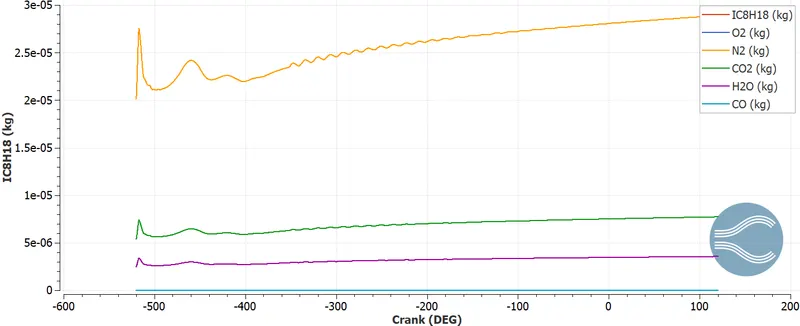
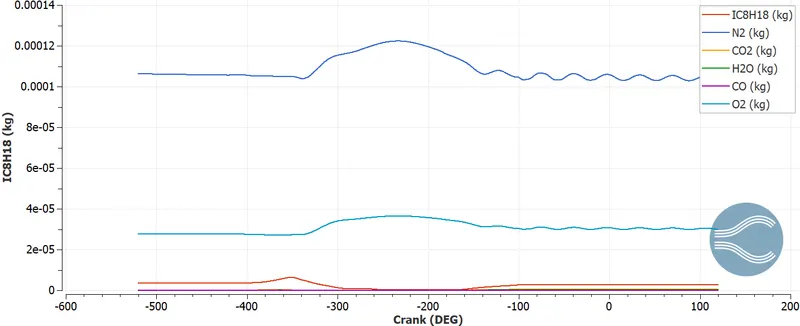
species in region 0,1 ,2 and 3 respectively
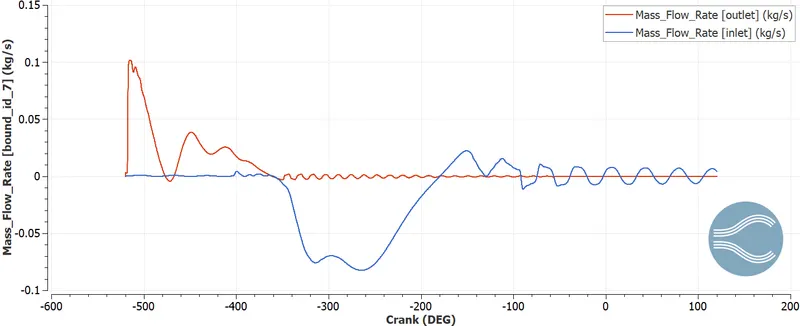
mass flow rate at inlet and outlet
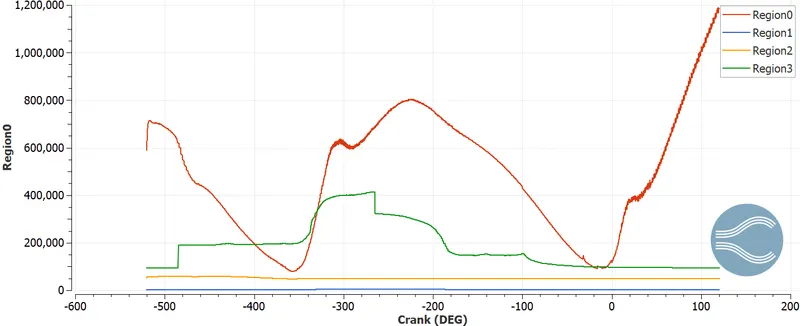
cell count by region
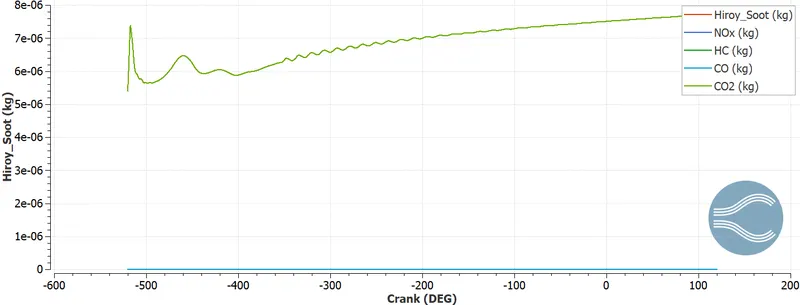
species out from exhaust at region 2
post processing
the output file are converted to readble file in cygeing application
the post process results were seen in paraview application
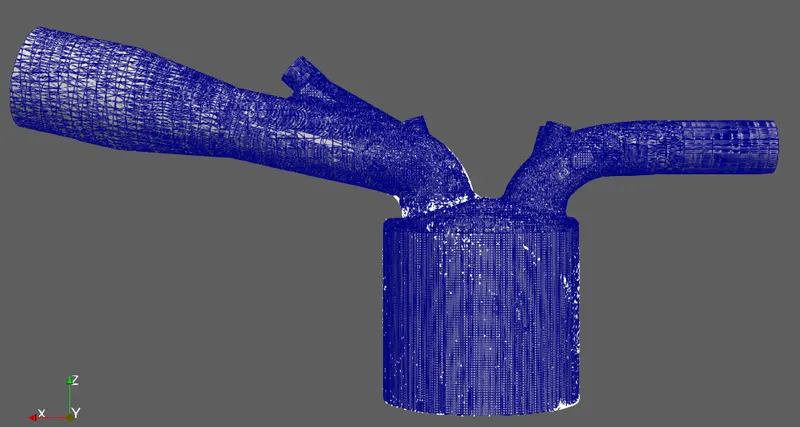
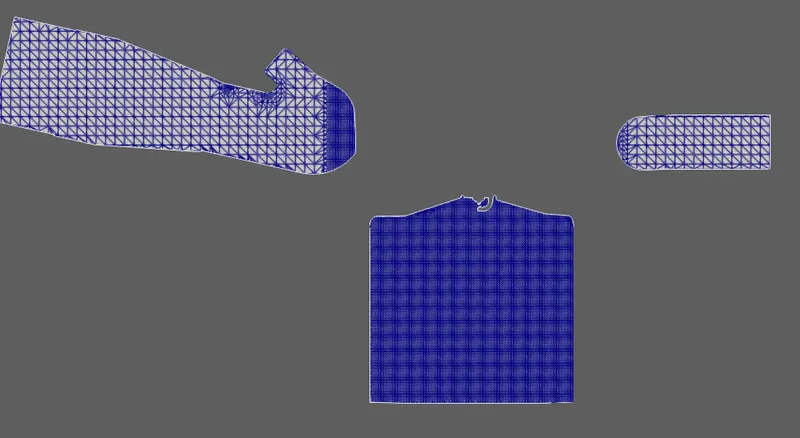
meshing
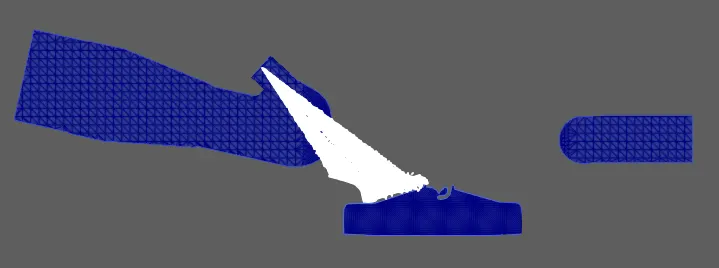
sparying
the post processing results animation were uplaode in zip file
conclusion
compression ratio of this engine
The compression ratio is the ratio between the volume of the cylinder and combustion chamber in an internal combustion engine at their maximum and minimum values.
A fundamental specification for such engines, it is measured two ways: the static compression ratio, calculated based on the relative volumes of the combustion chamber and the cylinder when the piston is at the bottom of its stroke, and the volume of the combustion chamber when the piston is at the top of its stroke.
from volume plot we can not down the maximum and minimu value of valume in cylinder region
ie maximum volume =0.000574217 'm^3'
minimum volme=`5.703*10^5`
compression ration =10.068
internal cumbustion engine heat transfer and wall temprature model:
Internal combustion engines are now extremely optimized, in such ways improving their performance is a costly task.
Traditional engine improvement by experimental means is aided by engine thermodynamic models, reducing experimental
and total project costs. For those models, accuracy is mandatory in order to ofer good prediction of engine performance.
Modelling of the heat transfer and wall temperature is an important task concerning the accuracy and the predictions of any
engine thermodynamic model, although it is many times an overcome task. In order to perform good prediction of engine
heat transfer and wall temperature, models are required for accomplish heat transfer from hot gases to engine parts, heat
transfer inside each engine part, and also heat transfer to coolant and lubricating oil.
The reasons are the accurate calculation of performance parameters, fuel consumption and emissions. Still nowadays heat transfer and wall temperature measurements are not always an option for internal combustion engine design and optimization, this way the models for this kind of application are the only alternative in many situations for estimation/ calculation of heat transfer and wall temperature.
the model present in heat transfer and wall temprature are
1. Gas to wall heat transfer;
2. Wall to wall heat transfer;
3. Wall to liquid heat transfer.
combustion efficiency of this engine
Combustion efficiency is the calculation / measurement, in percentage, of how well your equipment is burning a specific fuel. Complete combustion efficiency (100%) would extract all the energy available in the fuel. However, 100% combustion efficiency is not realistically achievable. Various combustion processes produce combustion efficiencies from 0% to 95+%. Combustion efficiency calculations assume complete fuel combustion and are based on three factors:
- The chemistry of the fuel.
- The net temperature of the stack gases
- The percentage of oxygen or CO2 by volume after combustion.
If your calculation shows that your equipment is losing 25% of the heating value of the fuel through stack losses, your equipment is running at 75% efficiency.
combustion efficiency / themal efficiency =`eta_(th)=(BP)/(Cv*m_f)`
where BP isbreak power in Kj
Cv is calrifi value in KJ/Kg
mf is fuel mass Kg/s
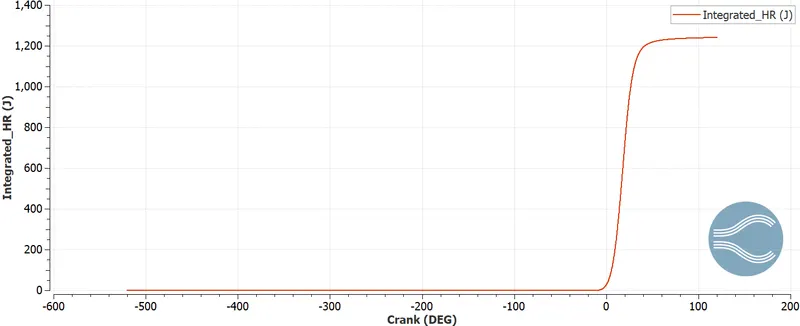
braking power
BP =1237.92 J
Cv 45000 J/Kg
mf= 3.19803e-05 Kg/s
`eta_(th)=1.237/(45000*3.19803*10^-5)`
`eta_(th)=85.95%`
use the engine performance calculator, to determine the power and torque for this engine.
to calculate engine performence
go to converge plotting--> tools--> engine performnce calculater
upload thermo.out file for cylinder region , and bore and stroke length and calculate
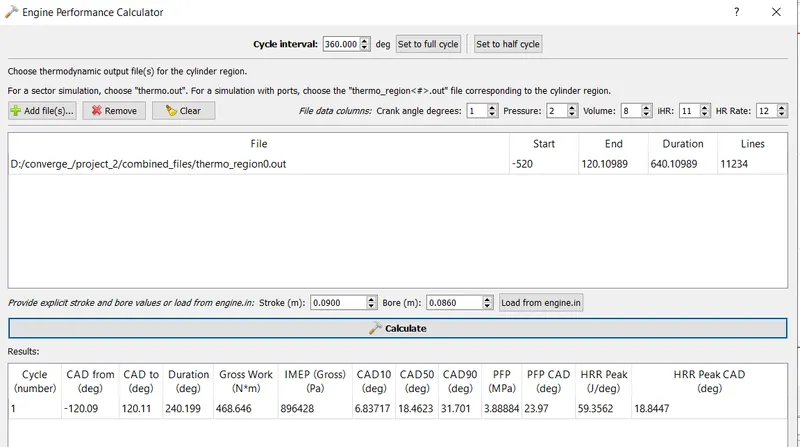
work done = 468.646 Nm
start time =-120.09
end time =120.11
total duration =240.20 deg
engine speed =3000 rmp (given)
N=3000/60=50 rps
total degree per sec=50*360=18000
time in sec =240.22/18000=0.0133
power= work done /time=468.646/0.0133=34831 J/s=34.83Kw
power=34.83Kw
torque =power *60/(2*pi*N)=34.83*1000*60/(2*3.142*3000)
torque= 110.83Nm
significance of ca10, ca50 and ca90
According to the value of in-cylinder pressure that is averaged from 60 consecutive cycles, the heat release rate (HRR) and cumulative heat release rate (CHRR) are calculated by zero-dimensional model.
The TDC of compression stroke is defined as 0°CA, and the phase of 10% and 90% of CHRR, named as CA10 and CA90, respectively, are regarded as the start of combustion (SOC) and the terminal point, and the time difference of them is defined as the combustion duration. Furthermore, the phase of 50% of CHRR, named as CA50, is an important parameter too. The cycle-to-cycle variation is represented by COVPmax, the coefficient of variation for the peak combustion pressure.
conclusion
from the results plot and post processing i can seen that the results are close to experimetntal data
the post processing results and animation were uploaded in zip file