Week - 10 Hyperelastic Material Models
Objective:
Given the material data below, calculate the Mooney Rivlin and Ogden material constants and compare them both using stress-strain data from a Dogbone specimen tensile test with 100 percent strain. The given data is the engineering stress-strain in MPa/(mm/mm). The comparison should be shown from the d3hsp file and using simulation.
Procedure:
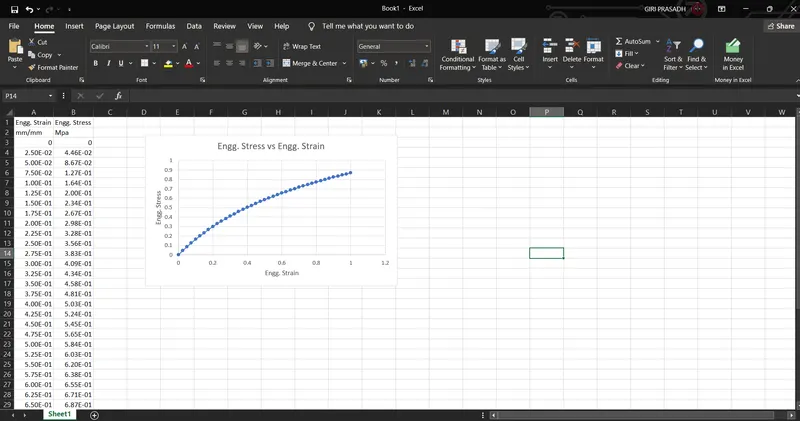
- Take the given material data in excel and plot the stress-strain graph
- Import the given Dogbone_specimen.k in LS DYNA Pre-Post
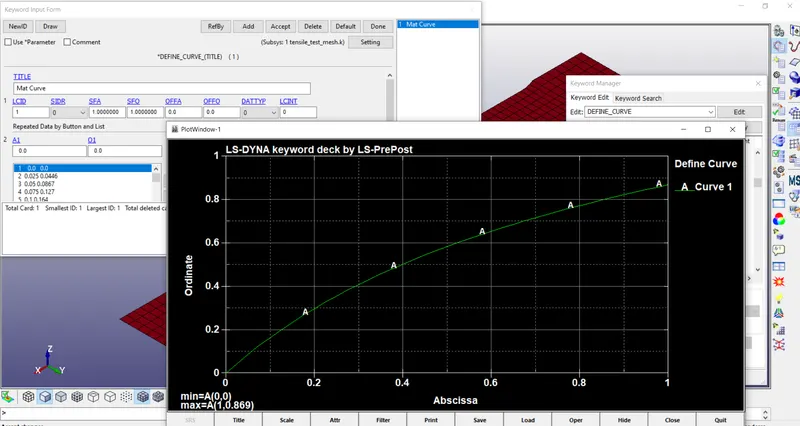
- Define Curve in keyword manager using the Effective Stress and strain.
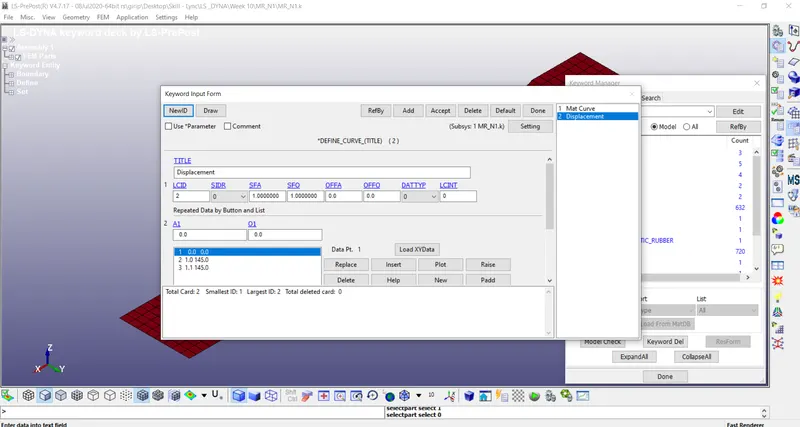
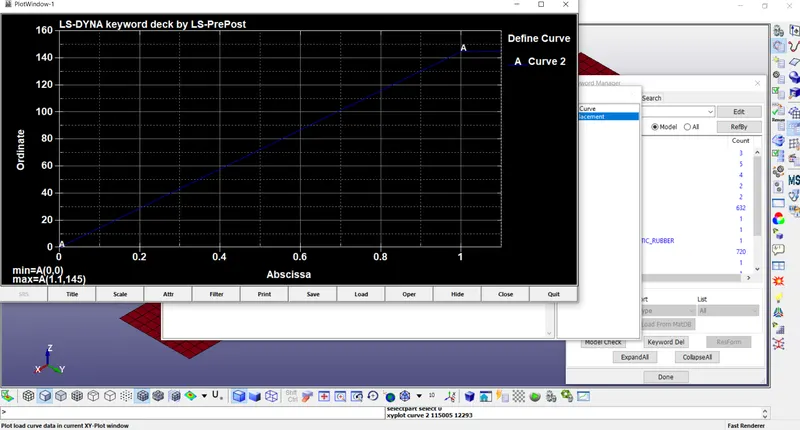
- Define curve for displacement in keyword manager
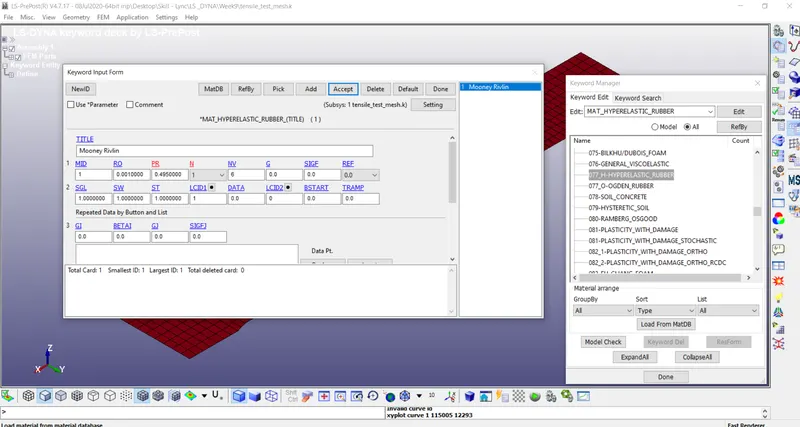
- Create a Material card assigning the values of casting iron and assign the curve defined.
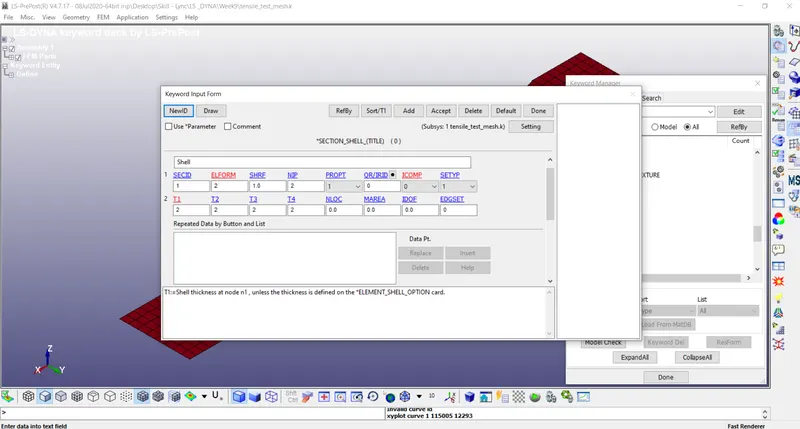
- Create Section Shell for the specimen assigning thickness of 2mm and ELFORM=2.
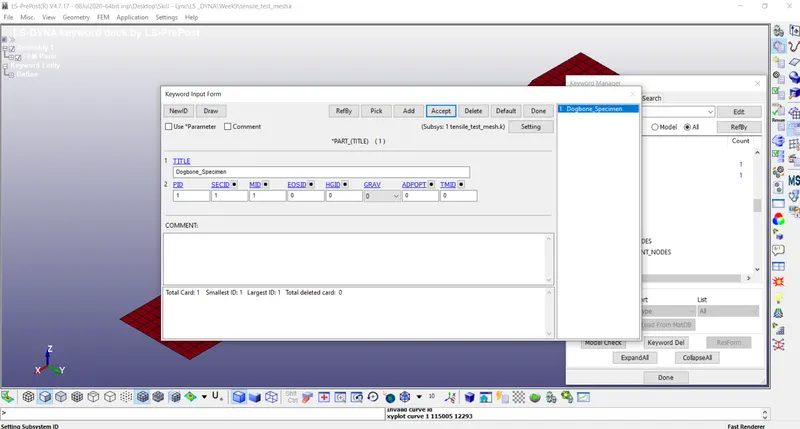
- Edit the Part, assigning the material and section shell created.
- Assign Boundary Conditions:
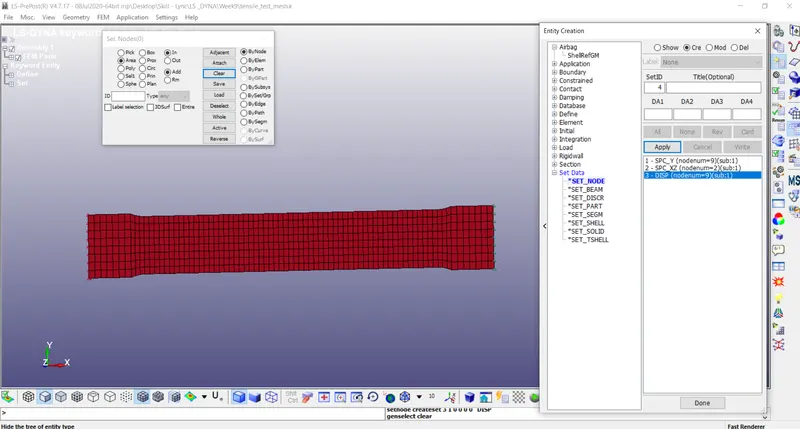
a) Constrain all the nodes of one end of the dog bone specimen in all directions except translational Y direction.
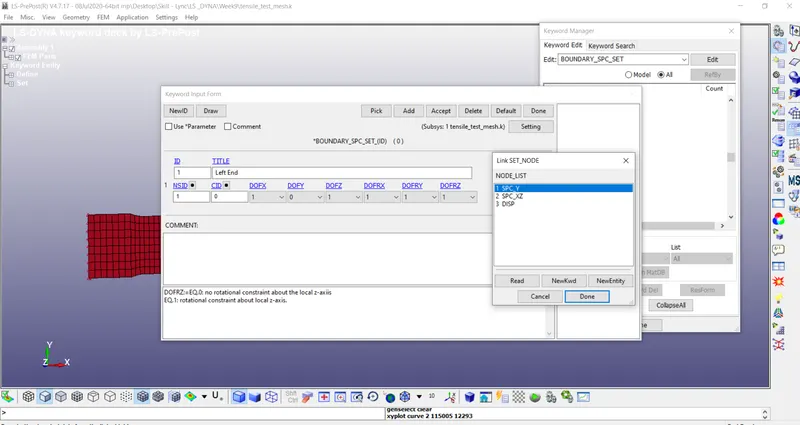
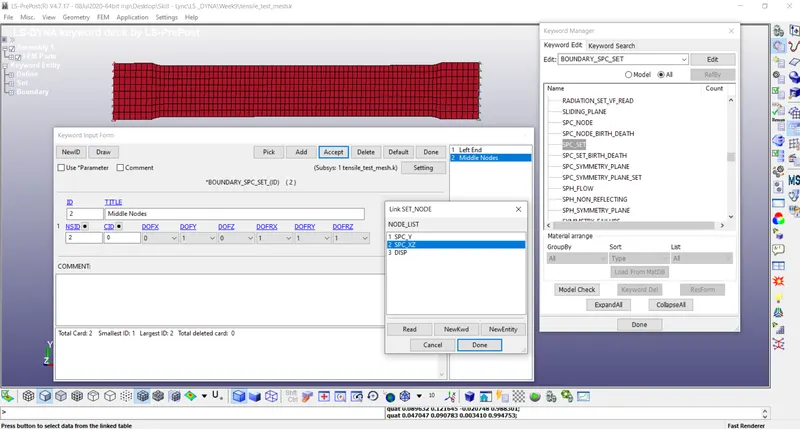
b) Constrain the mid nodes of both ends of the dog bone specimen in Y translation to restrict the slip during simulation.
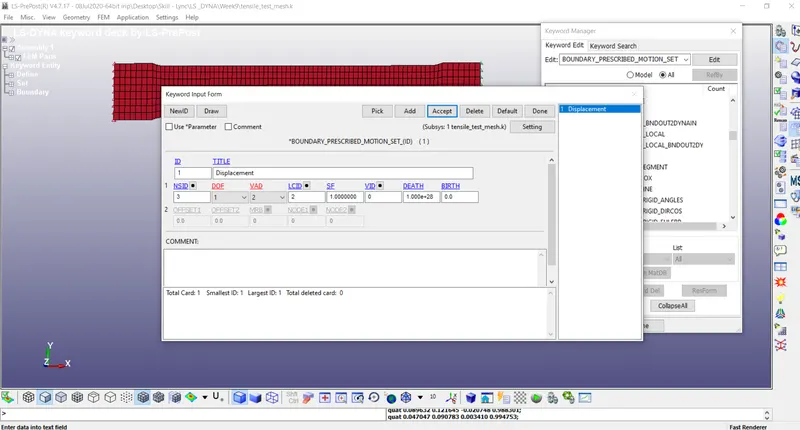
- Assign Displacement for the specimen onset of nodes on another side with the curve defined.
- Add the following control cards
- a) Control Implicit General – IMFLAG =1, DT0 = 0.01, IMFORM = 2.
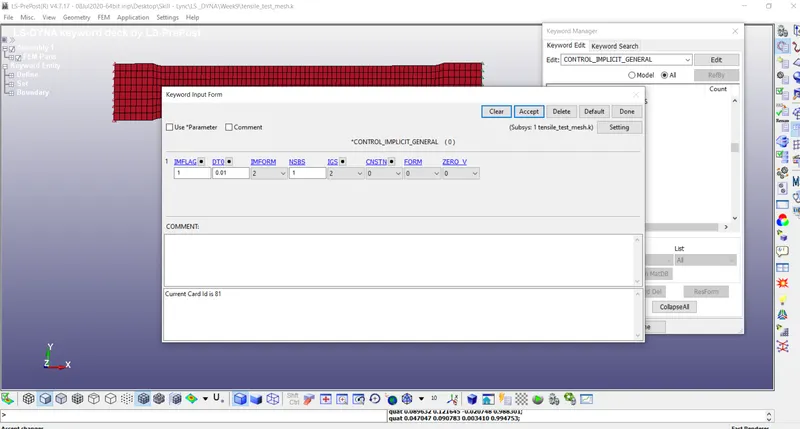
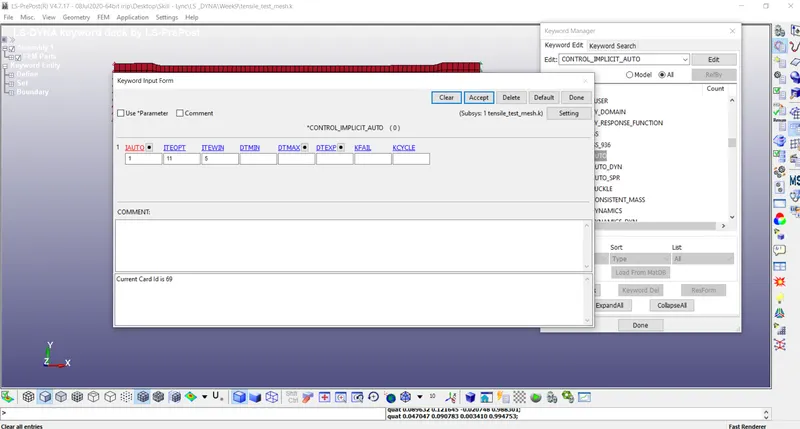
b) Control Implicit Auto – IAUTO=1, ITEOPT =11, ITEWIN=5, DTMIN=0, DTMAX=0.
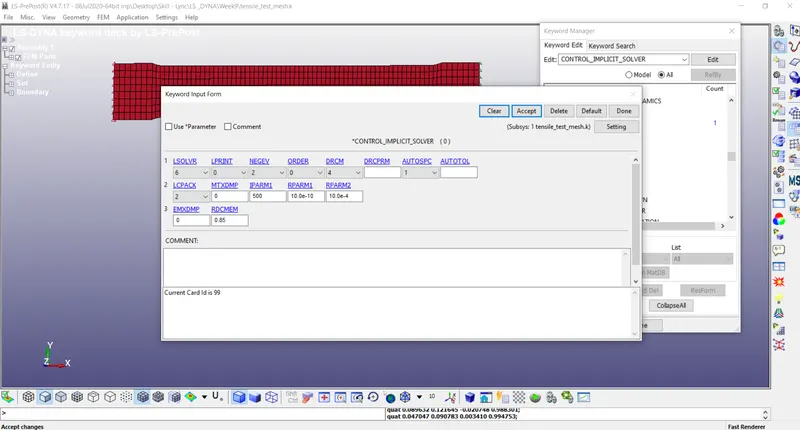
c) Control Implicit Solver – LSOLVR=6.
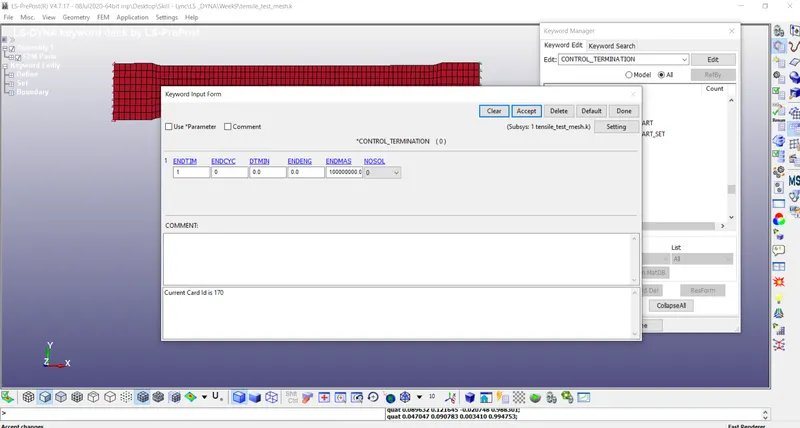
d)Control Termination – ENDTIM=1.
11. Add the following Database Cards
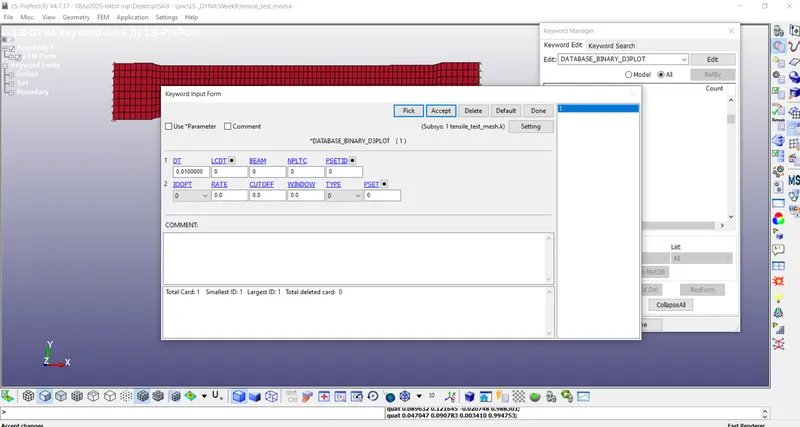
a) BINARY_D3PLOT with DT=0.01
b) DATABASE_EXTINCT_BINARY with STRFLG=1
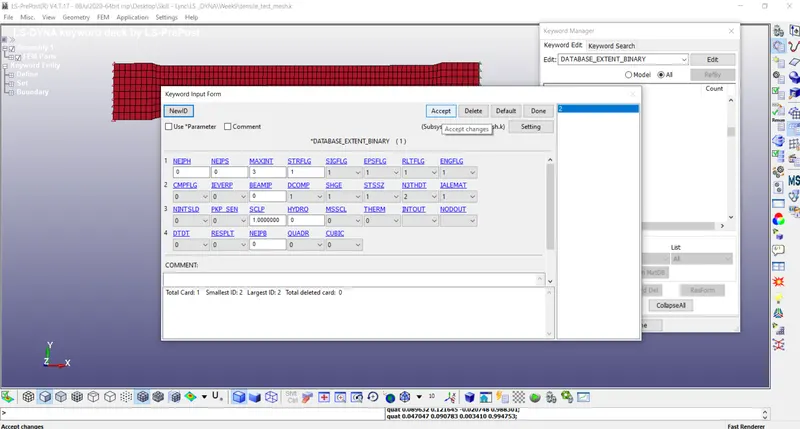
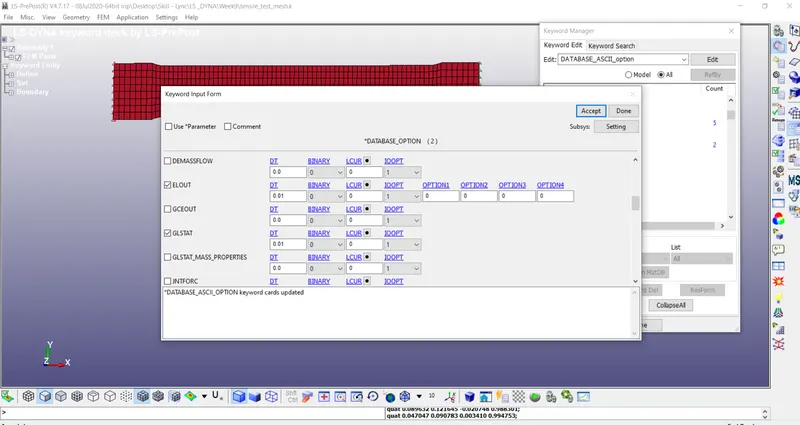
c)DATABASE_ASCII with ELOUT, GLSTAT, MATSUM
- Set ENDTIM as 1 ms in CONTROL – TERMINATION keyword card.
- Check the keyword manager for any errors.
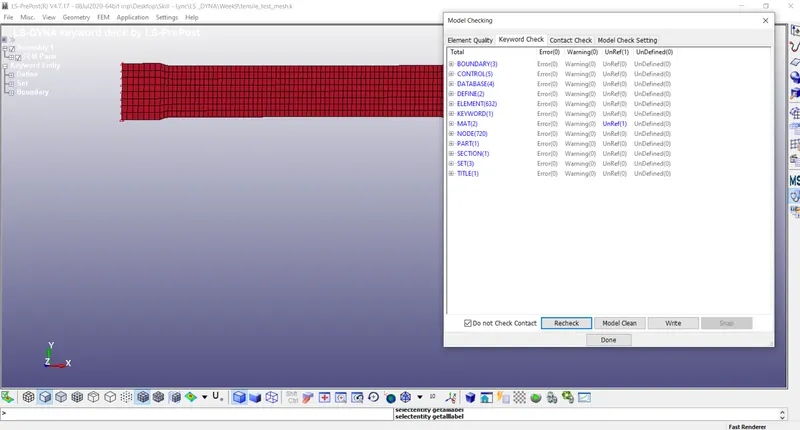
- Save the Keyword file as in the new folder and run the keyword files in LS – Run.
- Repeat the same with N=2,3 to get the constants from the d3hsp file.
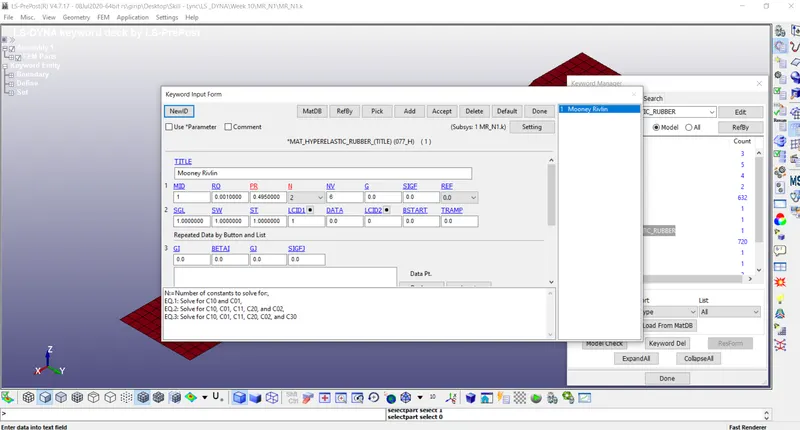
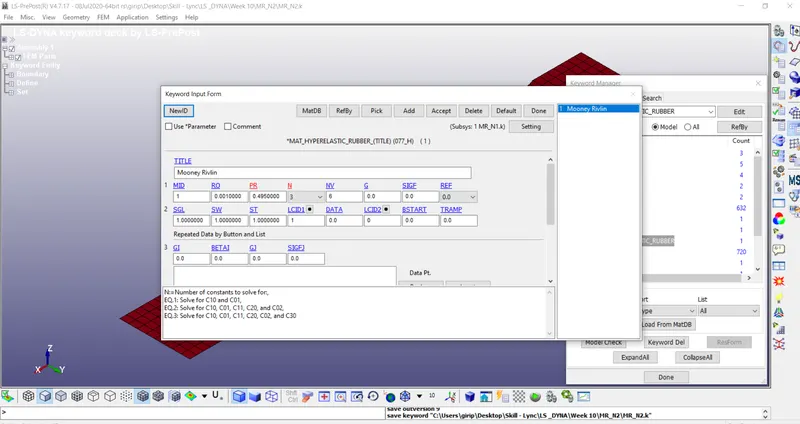
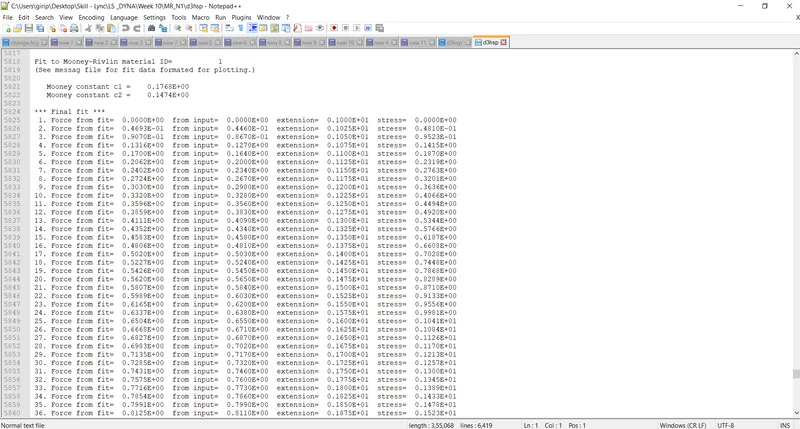
Plot the graph from the values.
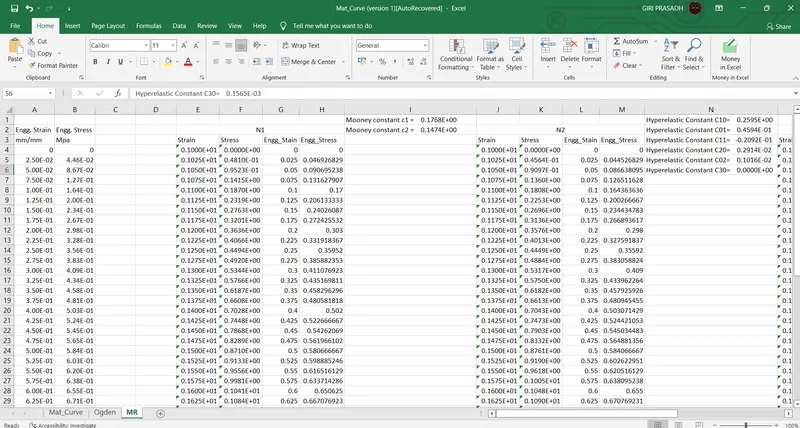
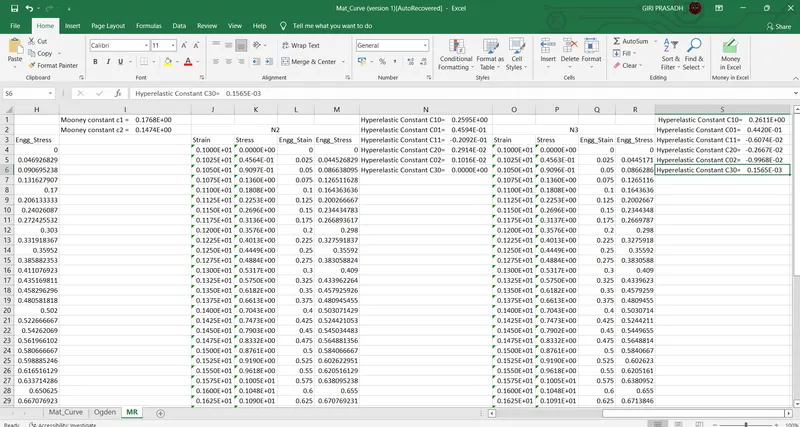
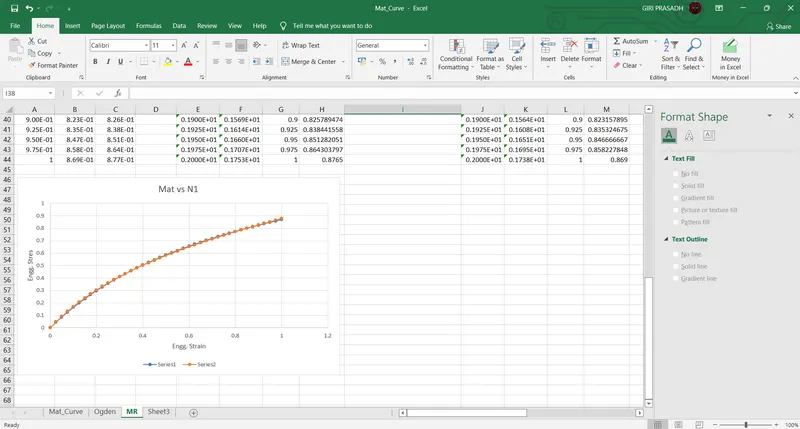
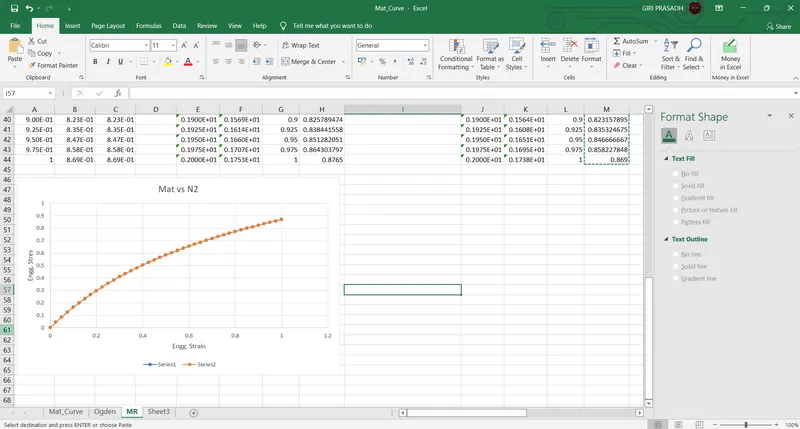
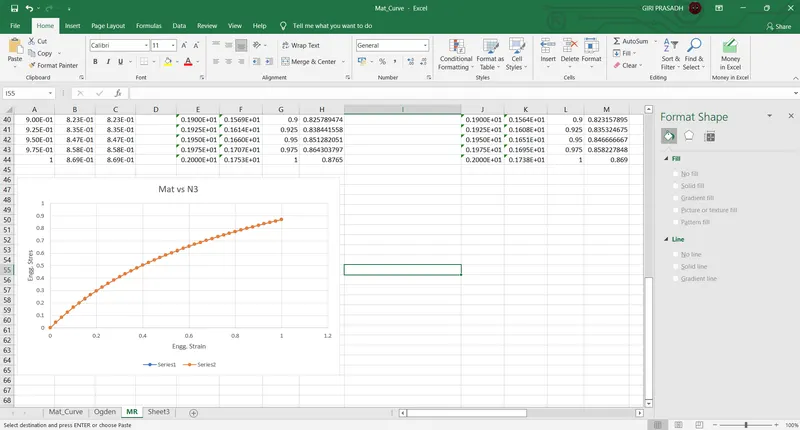
- Now using the constants, perform the same simulation keeping N = 0 (Material Verification)
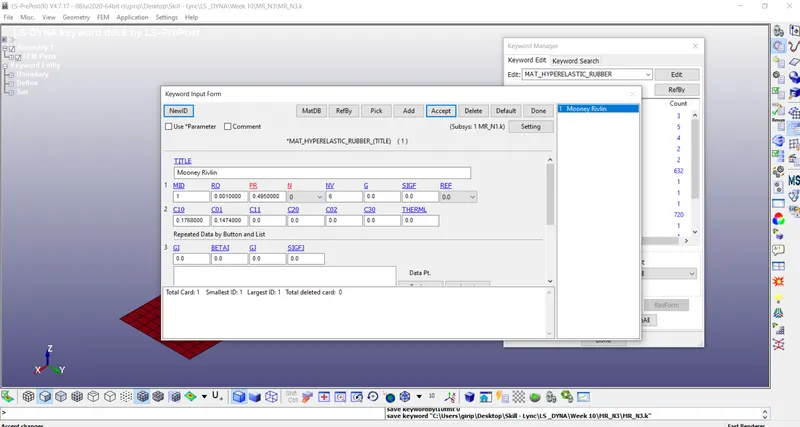
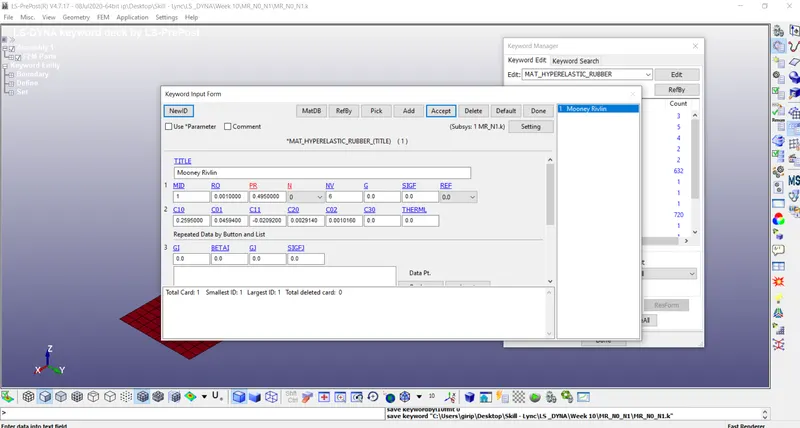
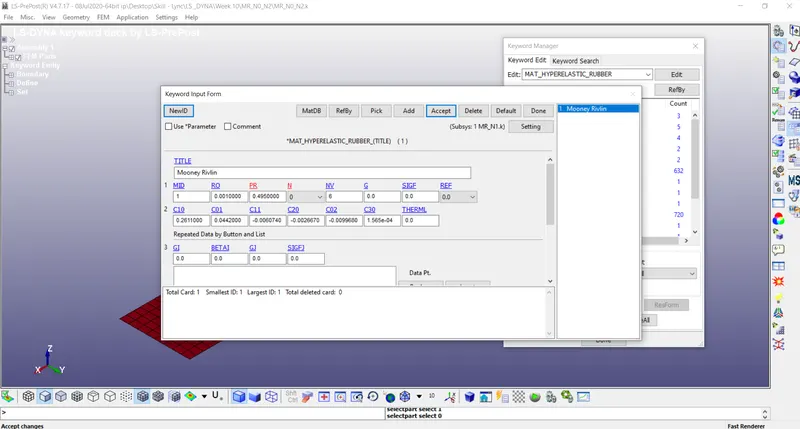
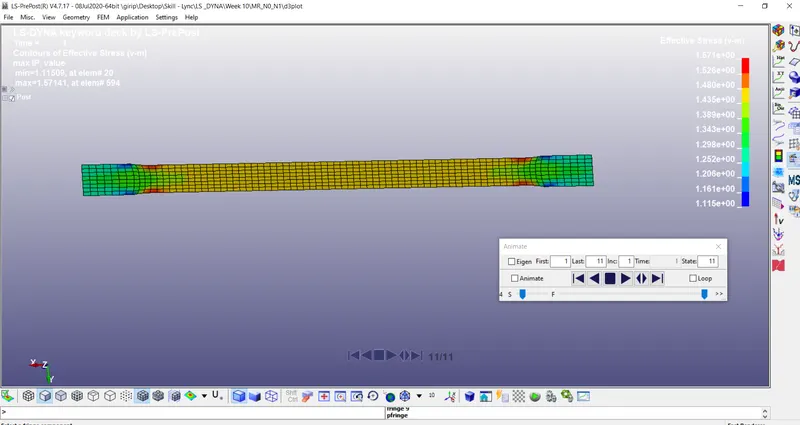
17. In the Fringe Component option, Select Von-mises stress for the contour plot and save the von-mises animation videos.
Effective Stress Plot
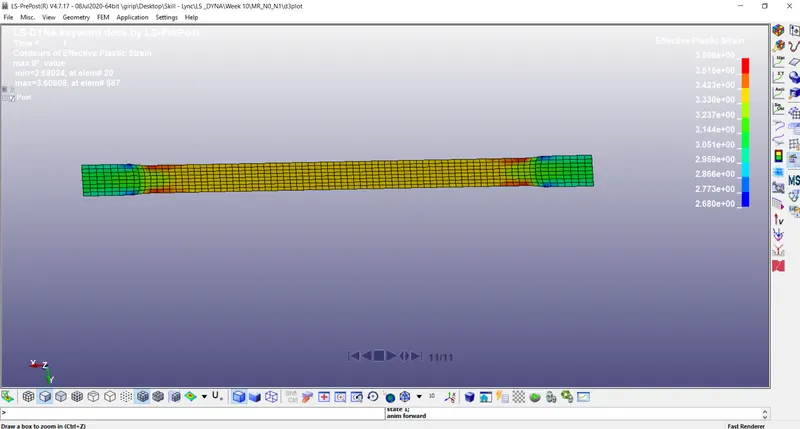
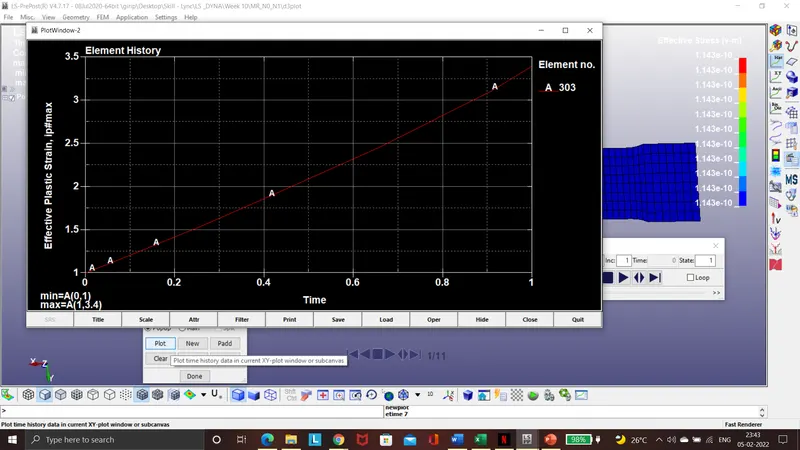
Effective Strain plot
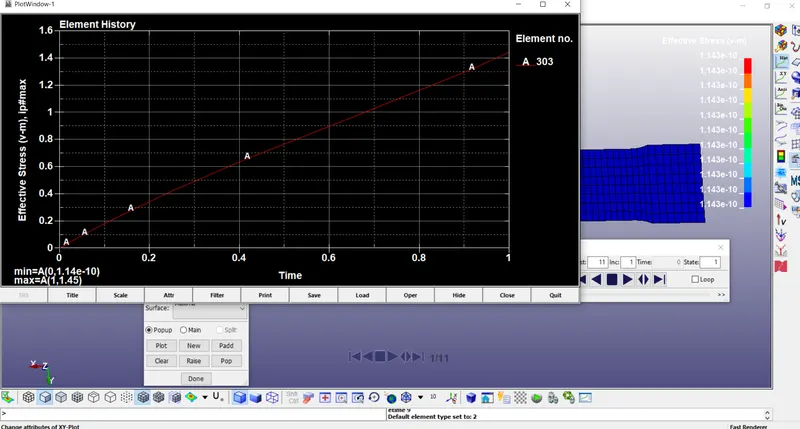
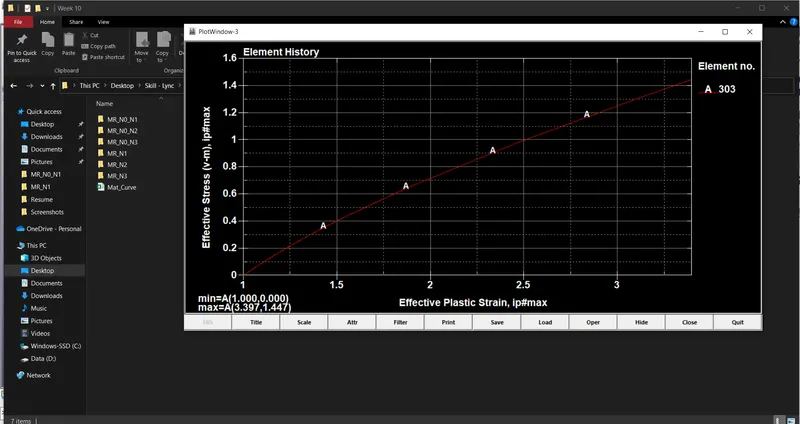
Stress vs Strain Plot
Conclusion:
The graph we obtained from the simulation is almost identical to the graph given.
Learning Outcome:
Performing Tensile test based on the material curve given.