Week 1 Stress Concentration on a Plate with hole
REPORT
STRESS CONCENTRATION ON A PLATE WITH A HOLE
CASE 1
To design a plate with a hole in the given dimensions and to determine the maximum stress and deformation developed in the model. The material used in this analysis is structural steel.
The properties of the material are stated below.
Density 7850 kg m^-3
Coefficient of thermal expansion 1.2E-05
Young's modulus 2E+11
The plate is modelled in space claim software as shown below.
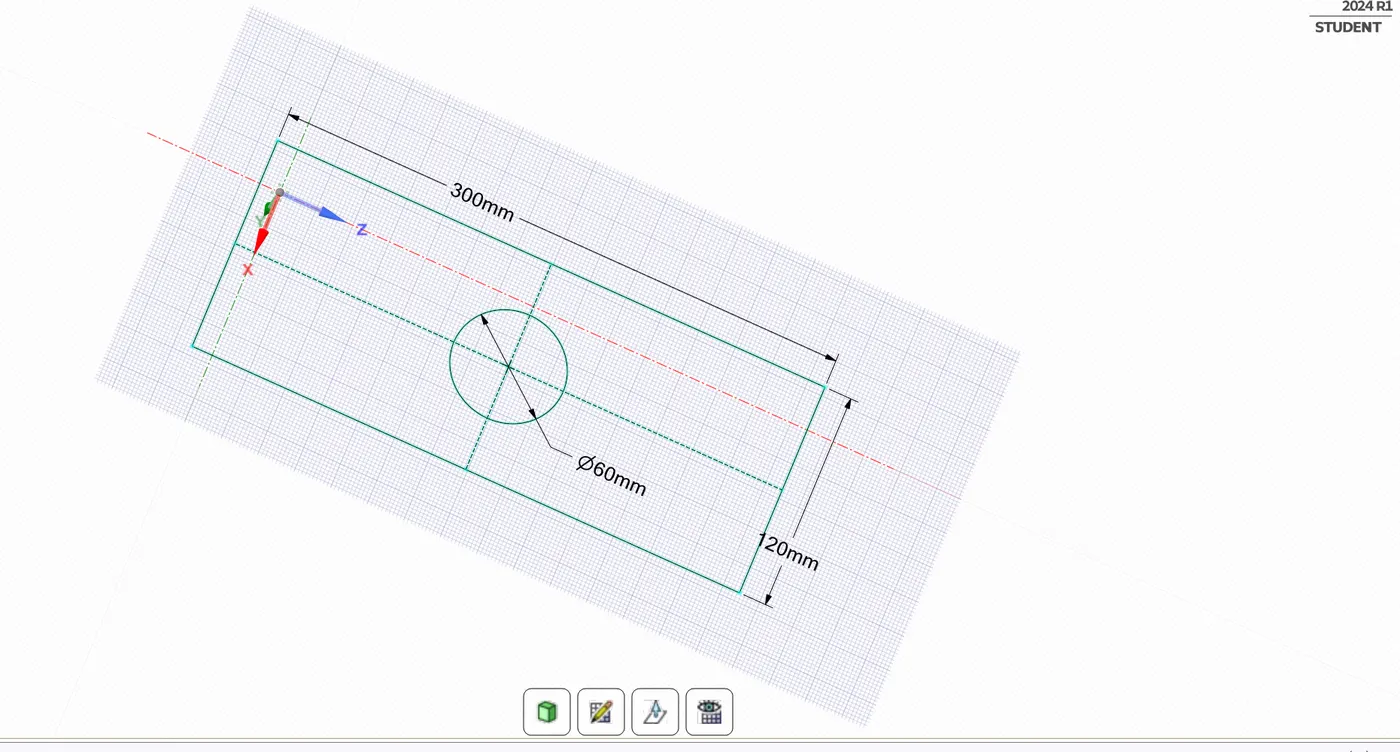
The dimensions of the plate are as follows,
Length 300mm
Breadth 120mm
Thickness 30mm
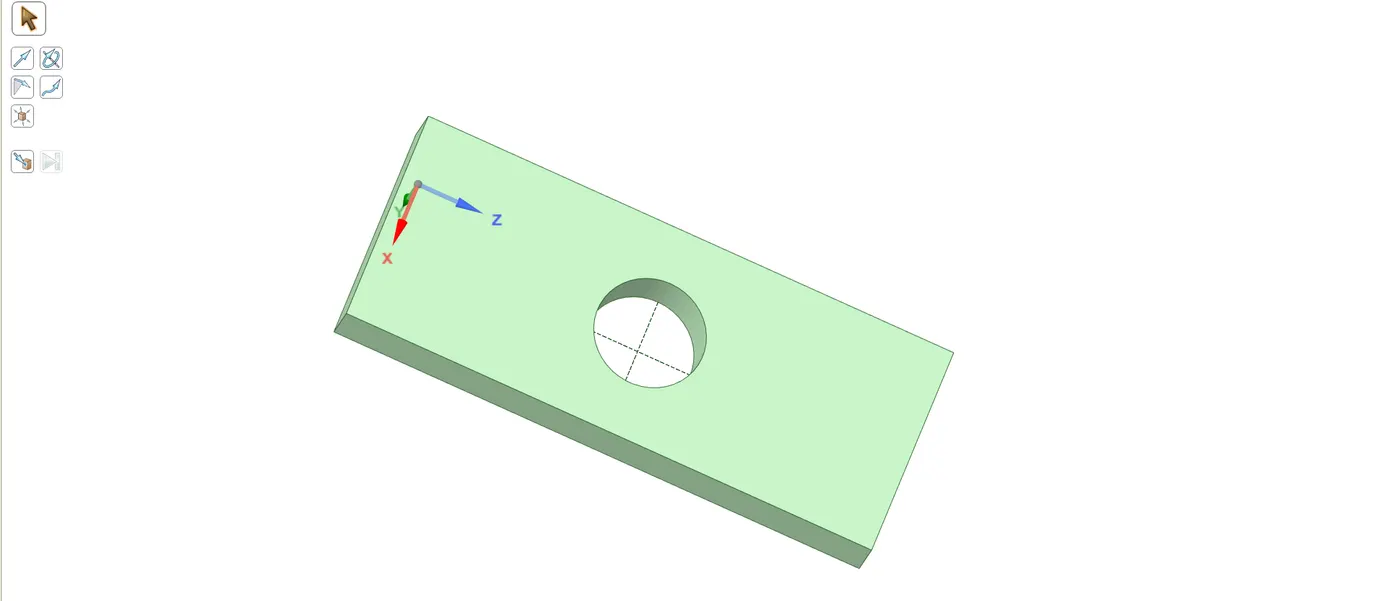
This 2D geometry is then extruded to a thickness of 30mm within space claim software in order to imported into the mechanical software. The extruded model is shown below.
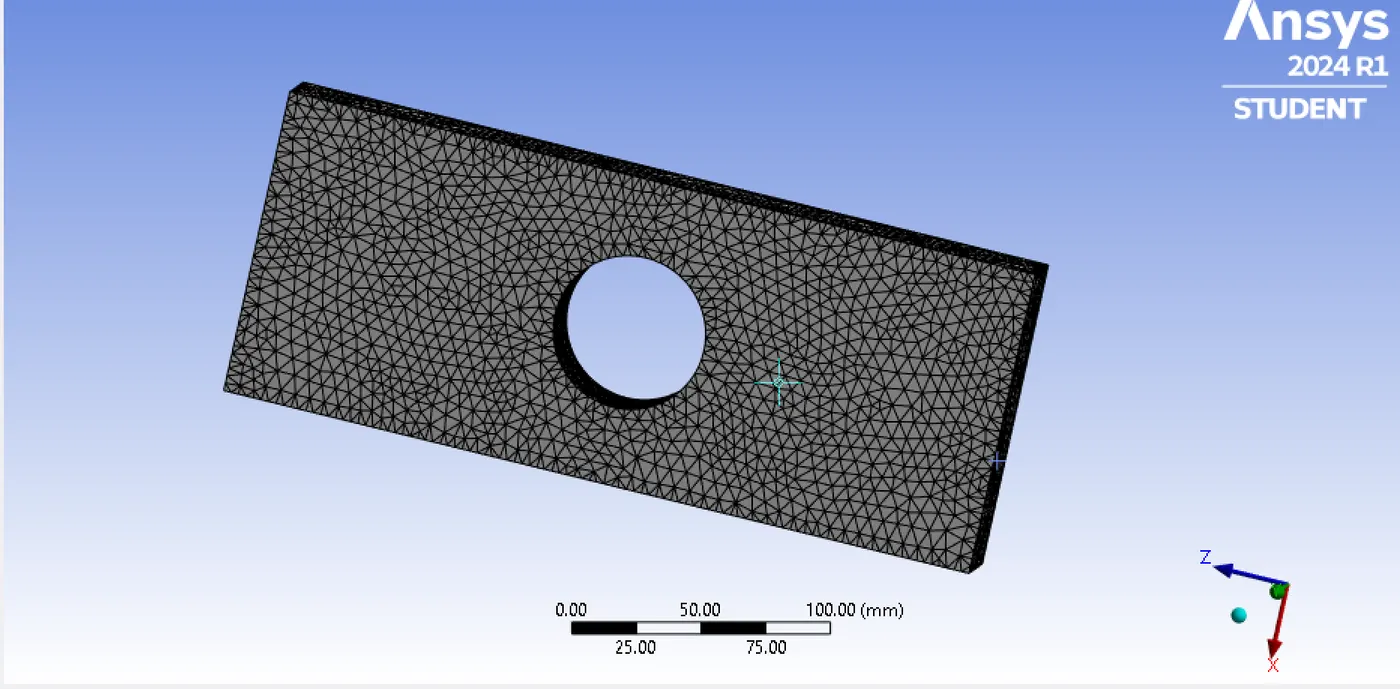
The model is imported in mechanical software and meshed with an element size of 3mm and tetrahedron method was employed.
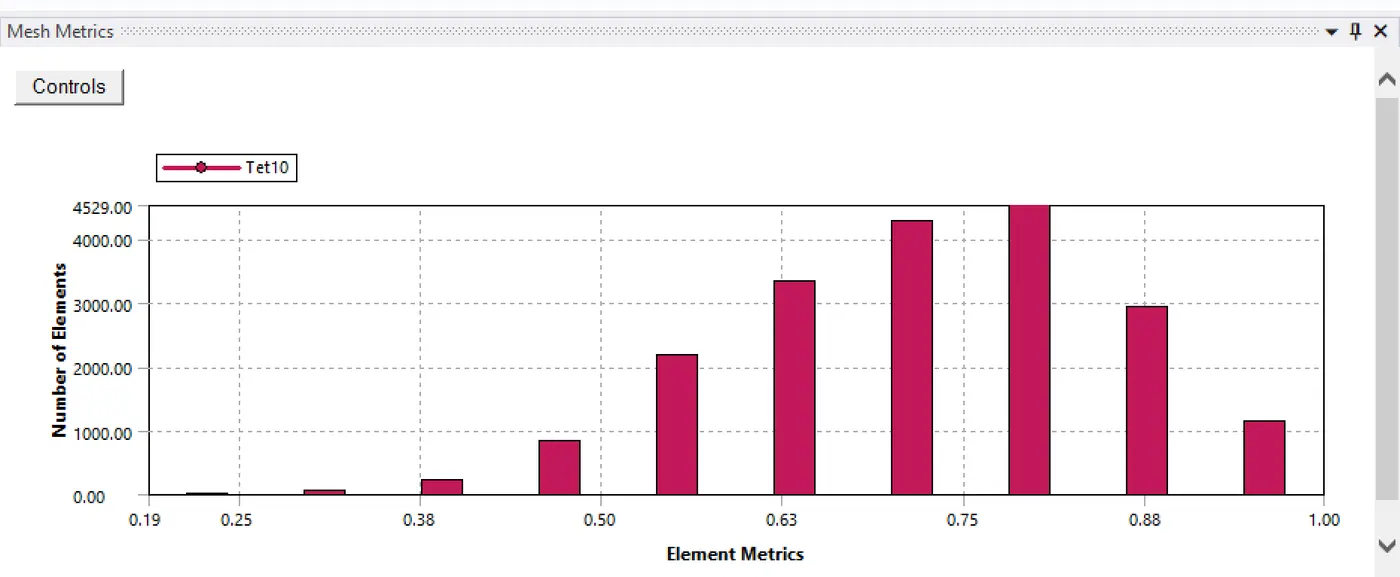
The mesh metric graph is given below, it shows the number of elements having lowest quality are minimal. Most of the elements having quality between 0.63 and 1. So the mesh is acceptable.
The meshed model is shown below,
A Fixed support is applied on the left side and a tensile force of 500N is applied on the other side. Requested for maximum deformation and stress developed in the model.
CASE 2
For case 2, Static structural analysis is carried out using plate with 3 holes. It is the same model used in case 1 with extra 2 holes of 30mm diameter placed 90mm away from the centre. The 3D model is shown below,
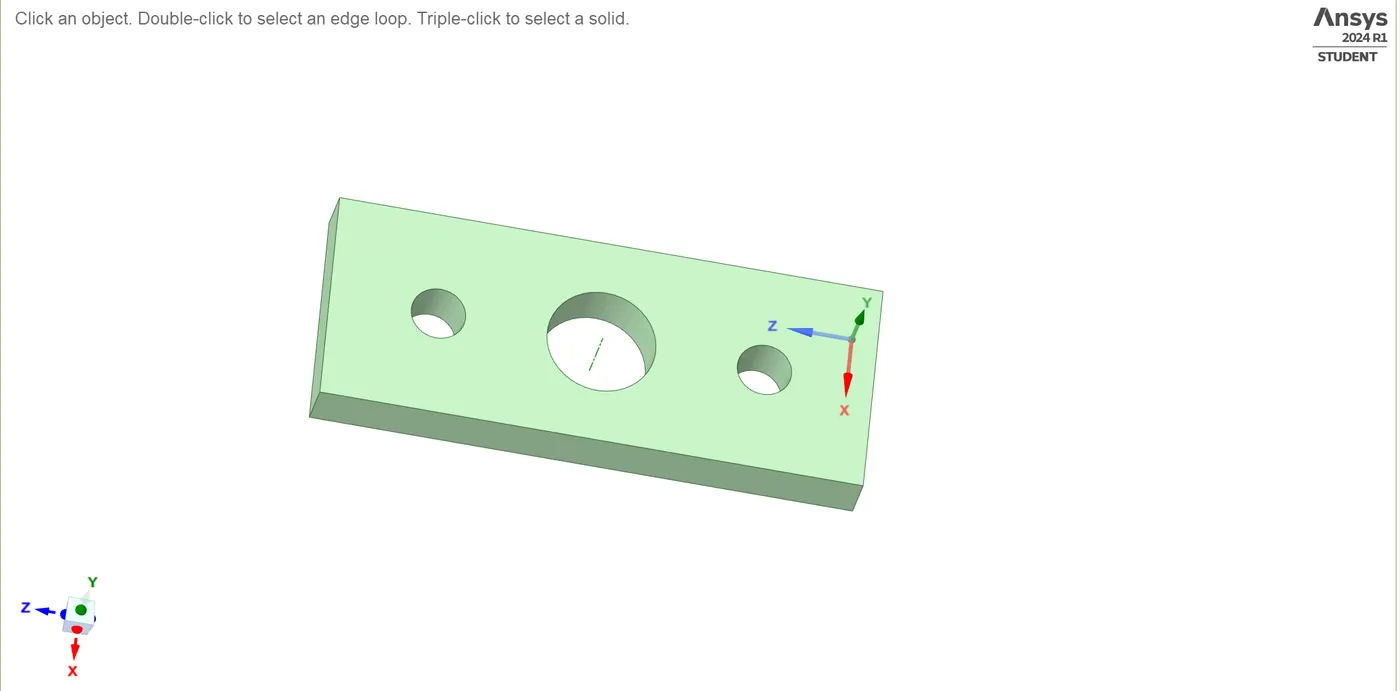
The model is then meshed in mechanical software with an element size of 3mm using tetrahedron method.
The mesh metric graph is shown below, it shows the number of elements having lowest quality are minimal. Most of the elements have a quality between 0.65 and 1. So the mesh is acceptable.
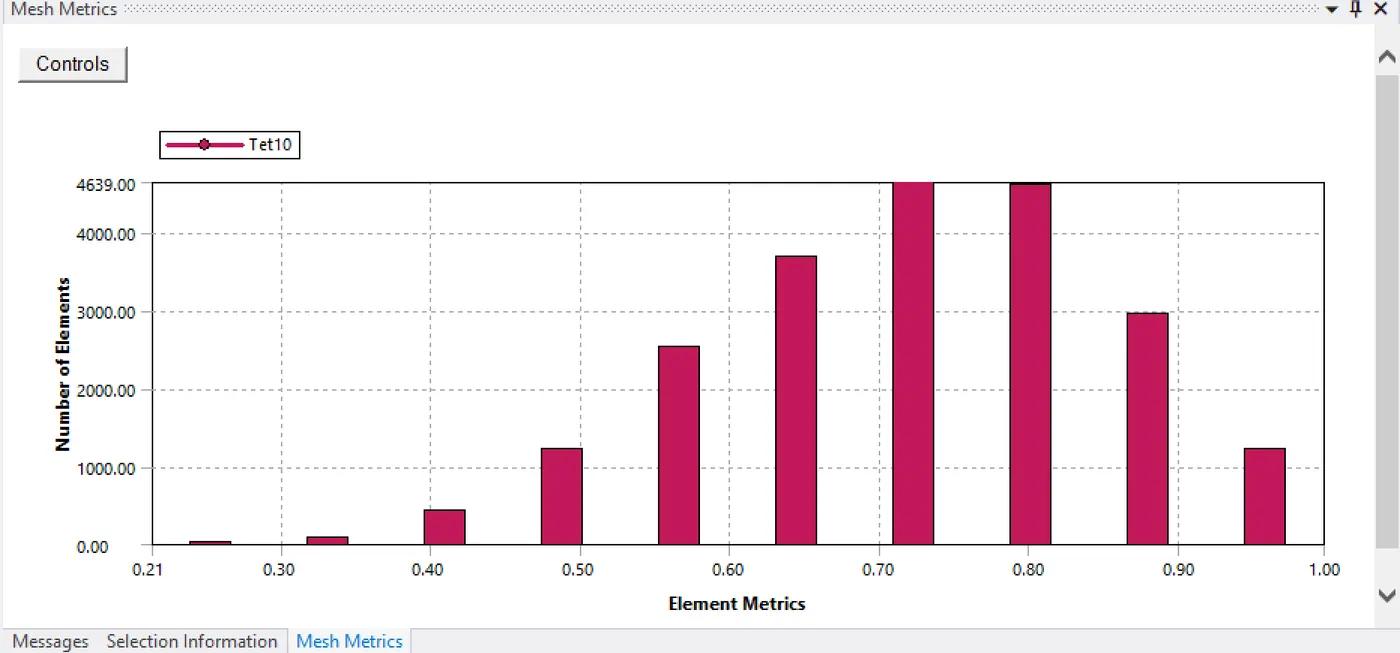
The meshed model is shown below,
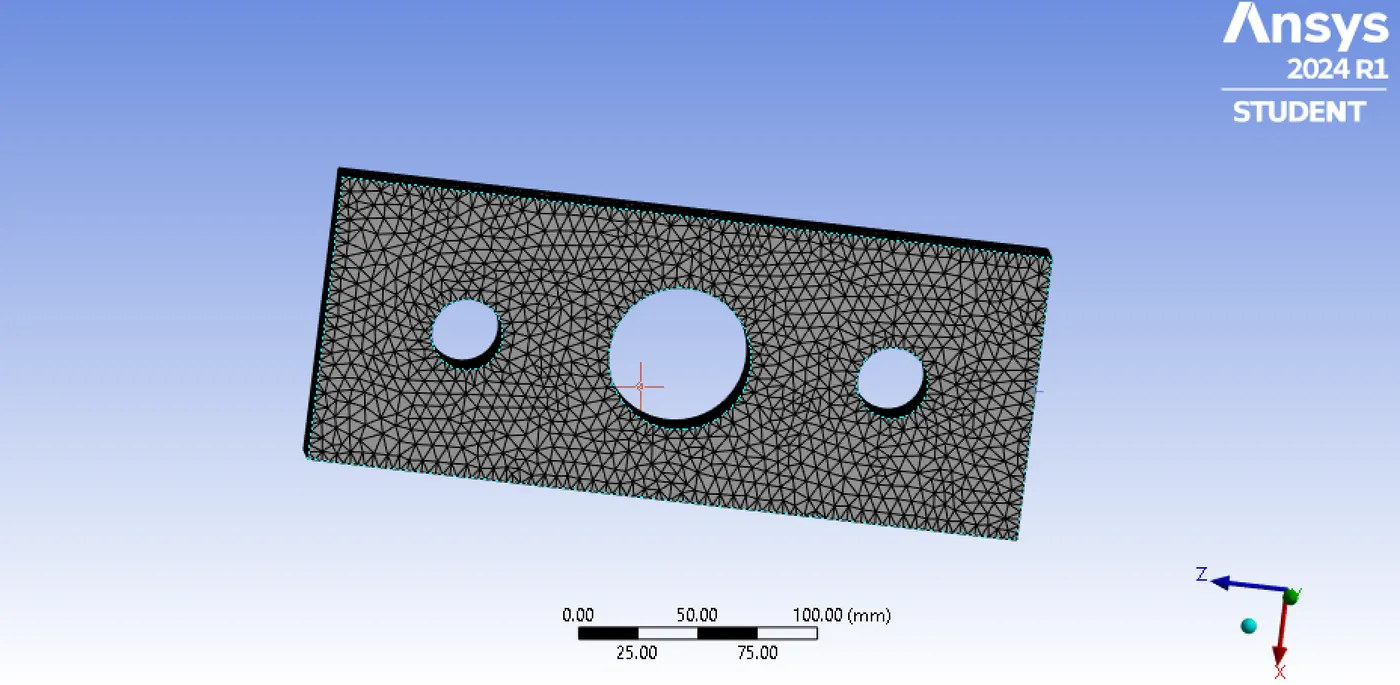
A Fixed support is applied on the left side and a tensile force of 500N is applied on the other side. Requested for maximum deformation and stress developed in the model.
The simulation is complete and results are obtained.
RESULTS
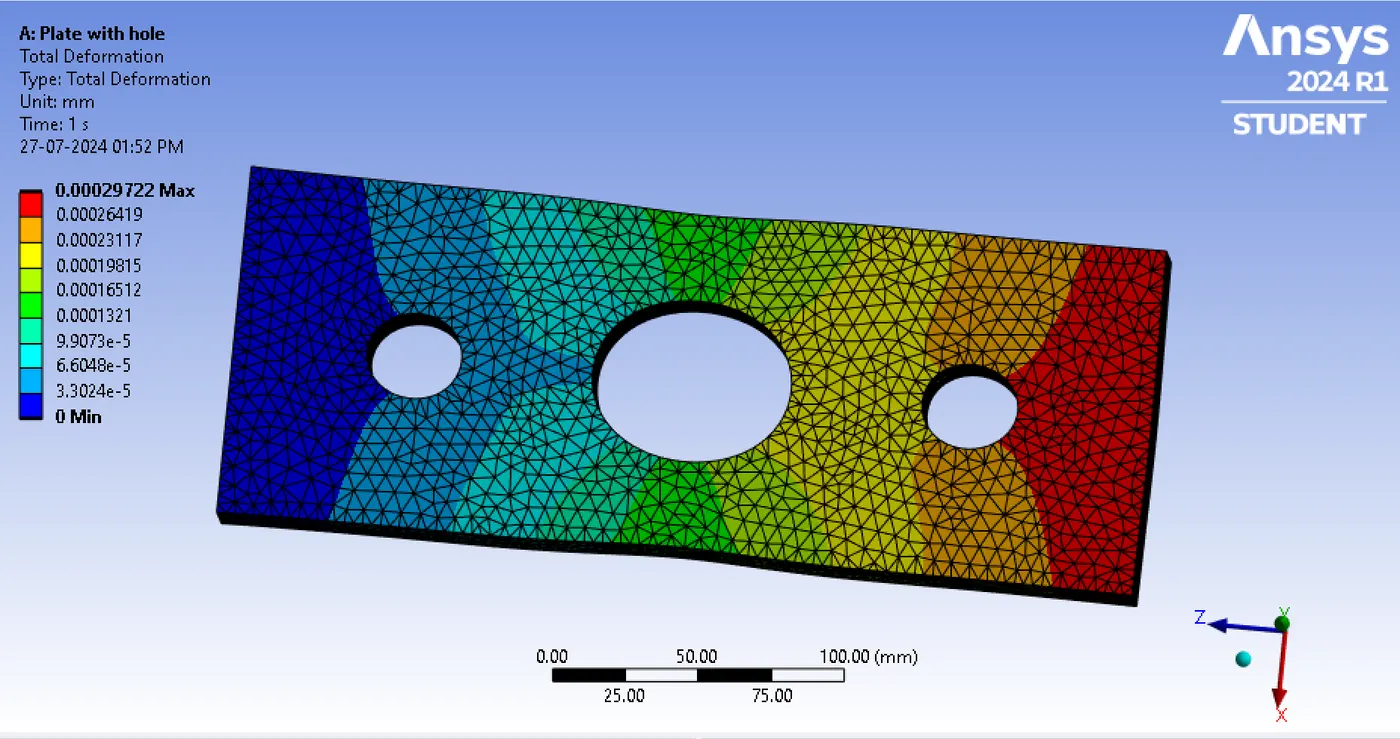
The total deformations of the 2 cases are compared first,
Case Minimum[mm] Maximum[mm] Average[mm]
1 0 2.749e-004 1.3711e-004
2 0 2.9722e-004 1.4711e-004
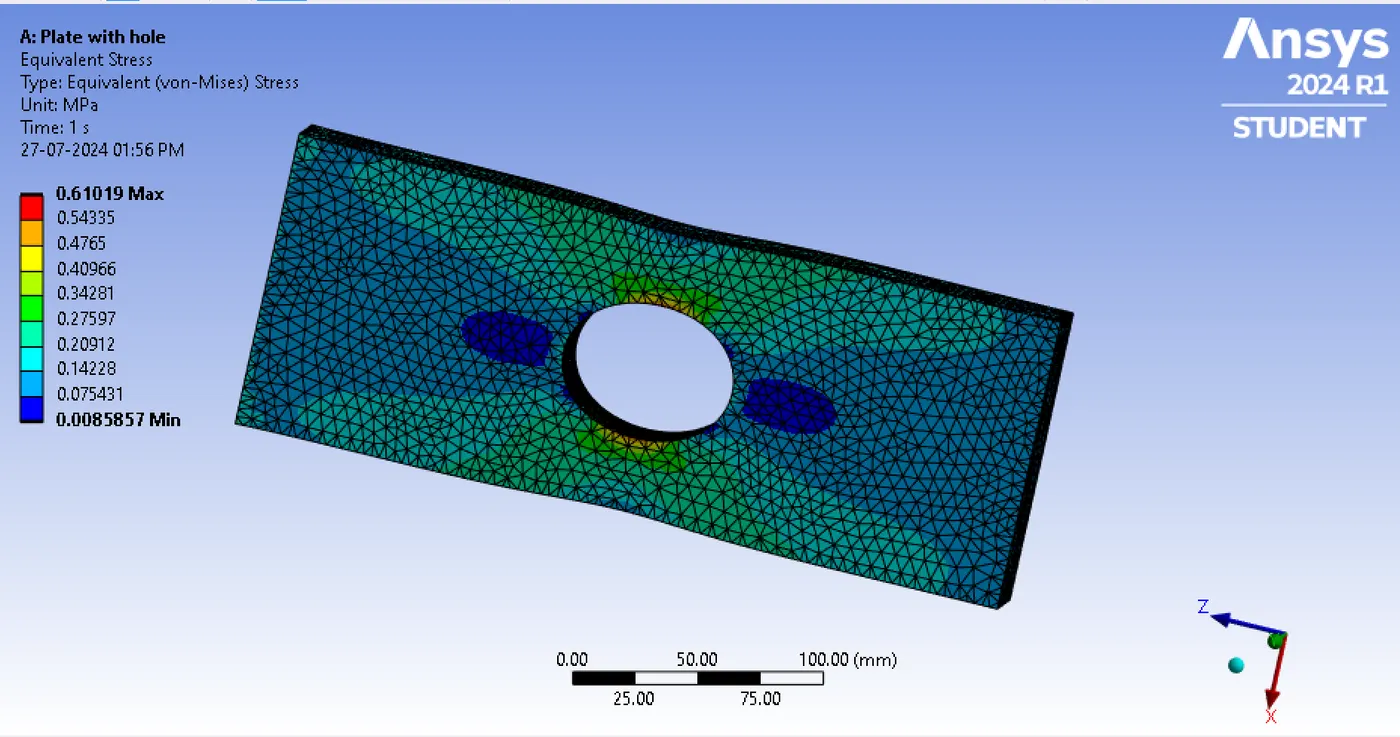
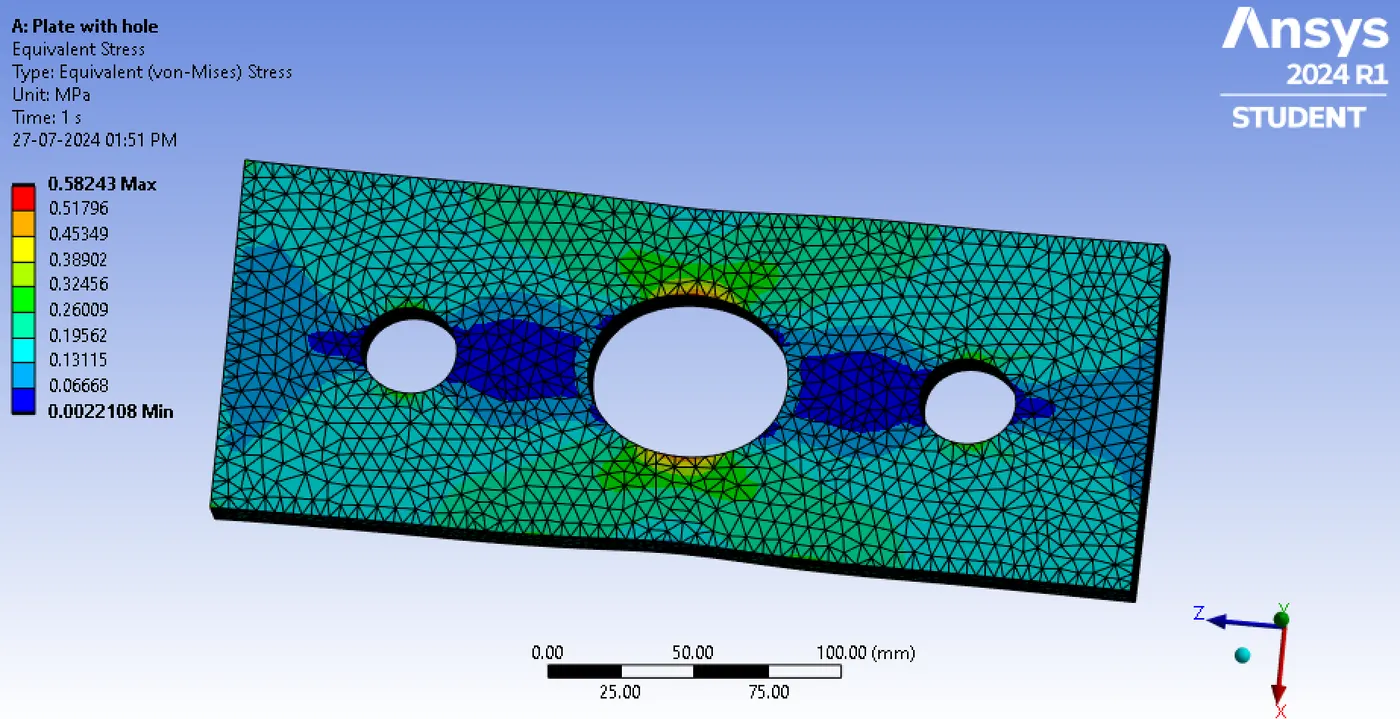
The equivalent stress of the 2 cases are compared,
Case Minimum[MPa] Maximum[MPa] Average[MPa]
1 8.5857e-003 0.61019 0.1725
2 2.2108e-003 0.58243 0.16967
The total deformation of the 2 cases are shown below,
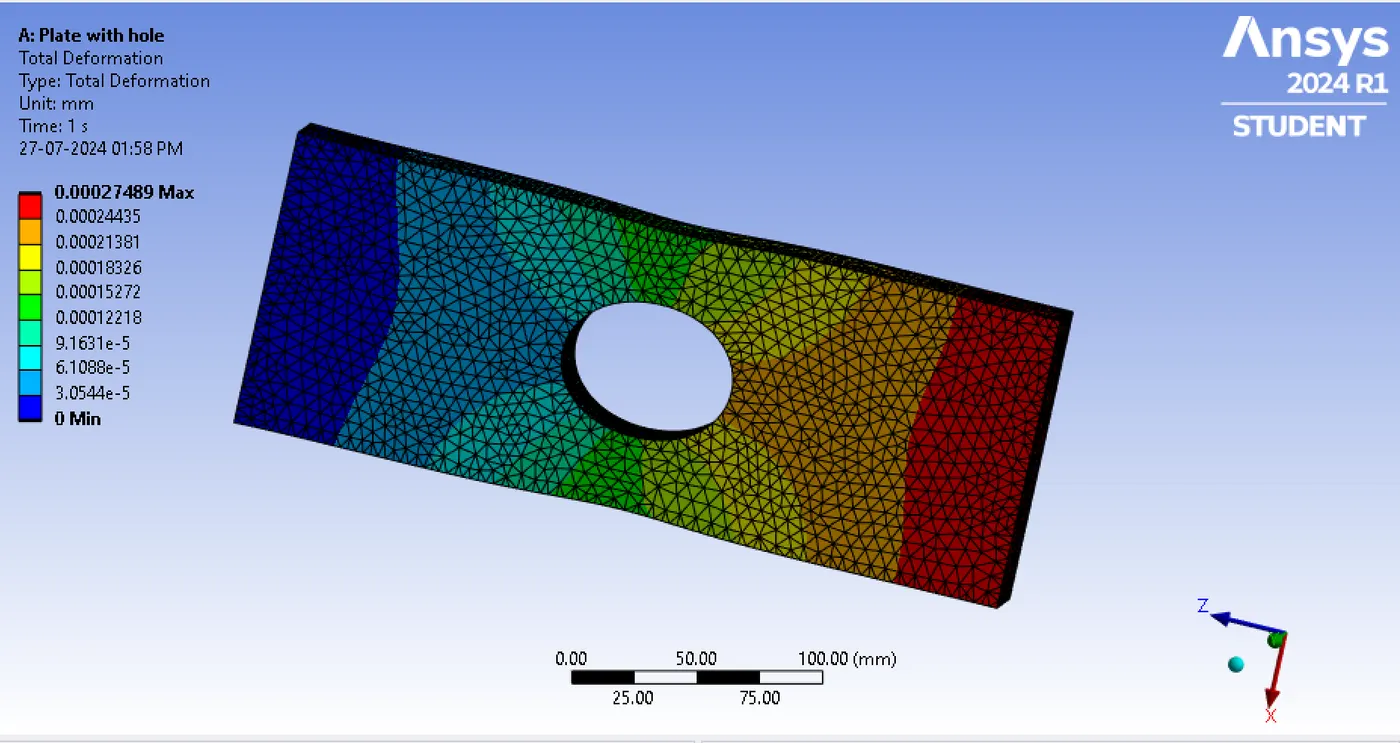
Case 1
Case 2
The Equivalent stress of the 2 cases are shown below,
Case 1
Case 2
CONCLUSION
The simulation is completed successfully. Mesh size of 3mm is used in both cases. Reducing mesh size will give us more accurate values but the 3mm will be good for these models.
When comparing total deformation experienced by the models, there is only a slight difference in the average values and case 2 is having slightly more deformation of 0.00001mm than case 1.
When comparing equivalent stress case 1 is having slightly more maximum and minimum stress value than case 2. The average value of equivalent stress is 0.00283MPa more in case 1 than case 2. The maximum stress developed in case 1 is 0.61019MPa and the maximum stress developed in case 2 is 0.58243MPa. The maximum stress developed in case 1 is 0.02776MPa more than the maximum stress developed in case 2. Making 2 extra holes in case2 results in slight reduction of stress developed.
On the basis of these results, from an analyst point of view, case 2 can be chosen because stress developed in it on application of same load is lesser than it's counterpart and also because the difference in deformation is also very small.
From manufacturer point of view, case 1 is chosen because the work that has to be done on the model is less than it's counterpart and there is no much improvement in performance, that is there is only a slight difference in values considering the work that has to be done to make the model.
The animation file of 2 cases showing equivalent stress is also uploaded along with zipped work bench file. Please check that out.