Week 1 Spur Gear Challenge
SPUR GEAR SIMULATION
OBJECTIVE
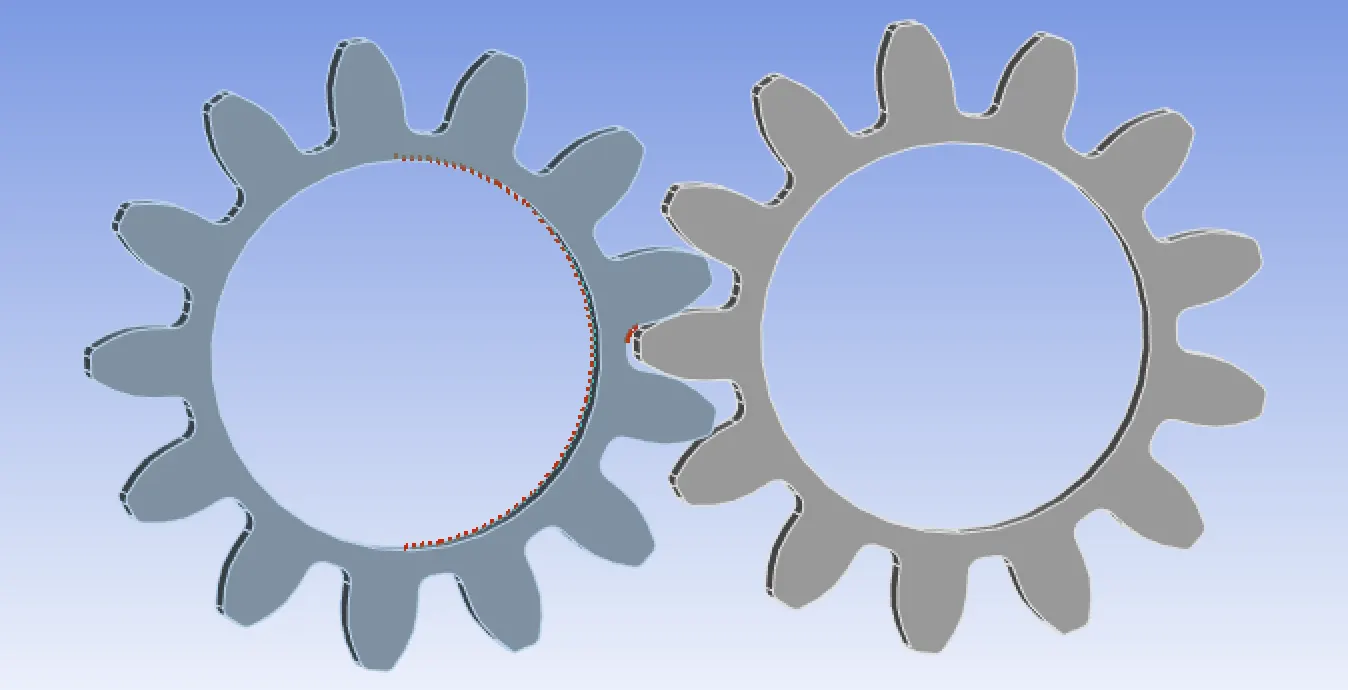
The objective of this challenge is to carry out static structural analysis on a spur gear to find out equivalent stress, total deformation and stress intensity using 3 different materials such as cast iron(ductile), cast steel, cast bronze and to find the location for possible fracture. Finally compare these 3 cases to find out which material is suitable. The image of spur gear is shown below,
CASE 1
To perform static structural analysis on spur gear on cast iron. Opened engineering data source in ANSYS. I was able to find cast iron EN GJL 100 from ANSYS GRANTA materials sample of academic version. This was the only version of cast iron available.
The properties of material are given below,
Density 6999 kg m^-3
Young's modulus 8.944E+10 Pa
Poisson's ratio 0.26
Tensile yield strength 7.981E+07 Pa
Tensile ultimate strength 1.414E+08 Pa
After adding material, opened mechanical software. Renamed the both parts as right and left and assigned cast iron to both parts.
Added contact and target faces, it is a frictional contact, set behaviour to symmetric, formulation to Augmented Lagrange because to reduce penetration and unnecessary chattering of model, Interface treatment to adjust to touch.
In contact, inserted 2 revolute joints one for RIGHT gear and other is for LEFT gear. Given frame of reference as body to ground to both LEFT and RIGHT. Revolute joint is because both needs to rotate.
Then entered analysis setting, simulation is running through 6 steps. Set the Auto tine stepping ON, Defined by Time and Large deflection ON. And time step values are follows,
Initial time step 0.2s
Minimum time step 5e-2s
Maximum time step 0.5s
Inserted 2 joint loads,
1. Revolute-Ground to RIGHT
Given 180 degree anti clockwise rotation to this part by setting 30 degree to first step and incremented 30 degree with each step finally 180 degree to sixth step.
2. Revolute-Ground to LEFT
Load is applied on this part. A moment of -10Nm is given to all 6 steps. Negative sigh is given to moment to make the rotation is in clockwise direction. So that both LEFT and RIGHT part will rotate in opposite direction.
Created a mesh of 0.5mm by setting adaptive size to NO and smoothing to low.
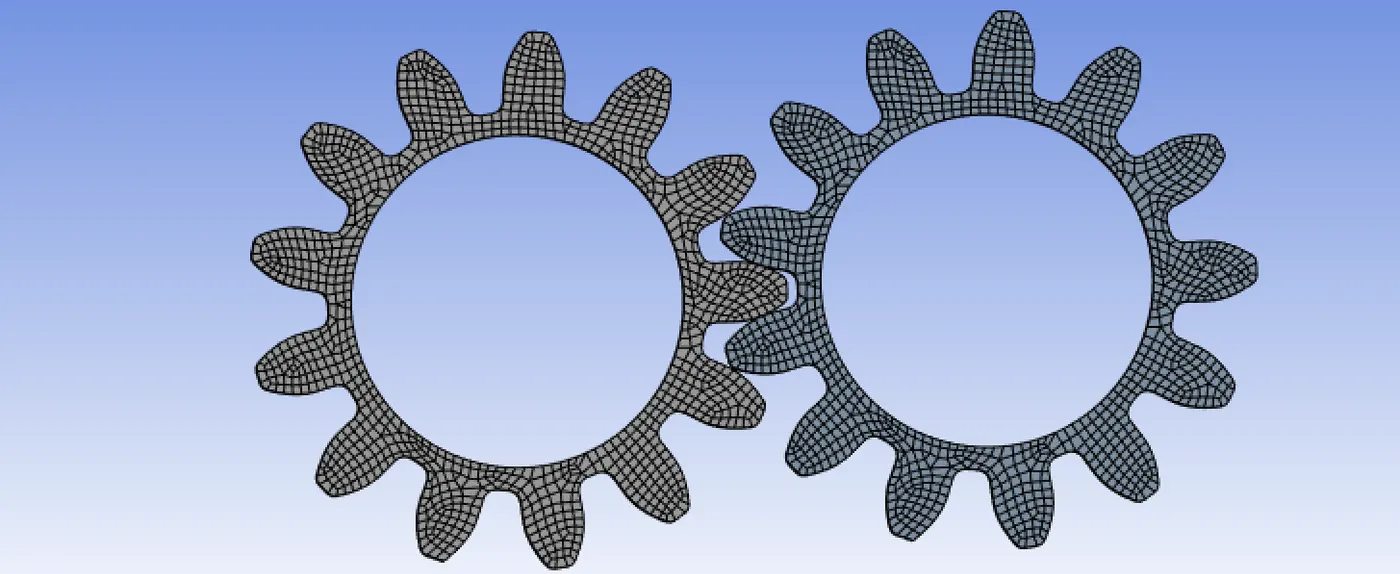
The mesh metric graph is shown below,
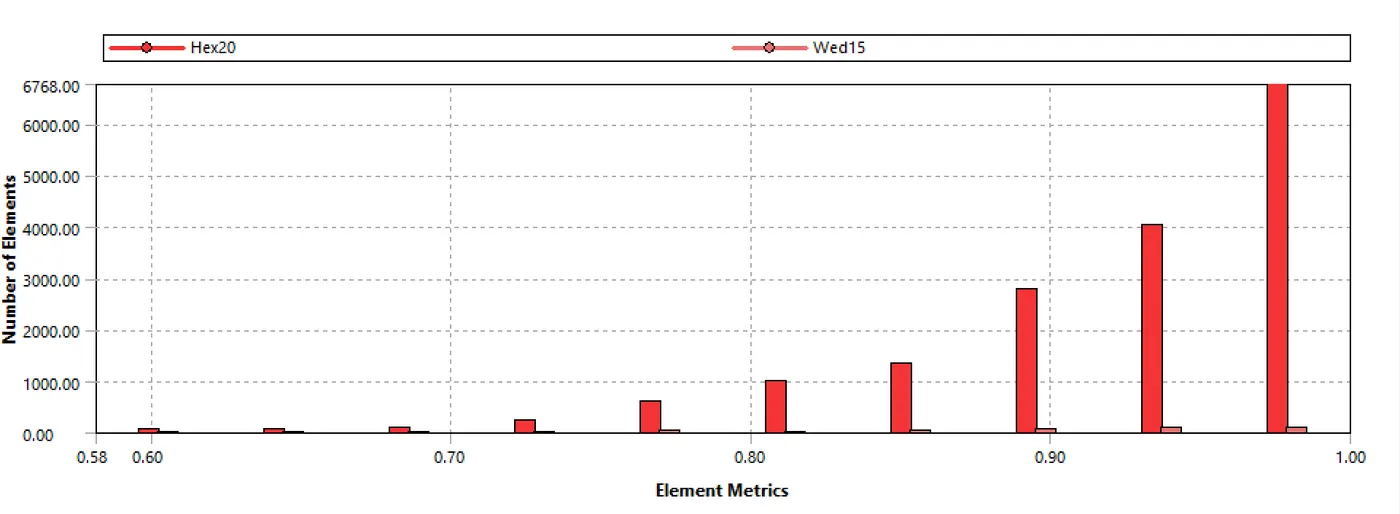
According to mesh metric, elements with lowest quality are minimal. Most of the elements have high quality in the range of 0.8 to 1. so the mesh is acceptable.
Requested for equivalent stress, total deformation and stress intensity.
Stress intensity refers to the measure of stress concentration at the tip of a crack in a material.
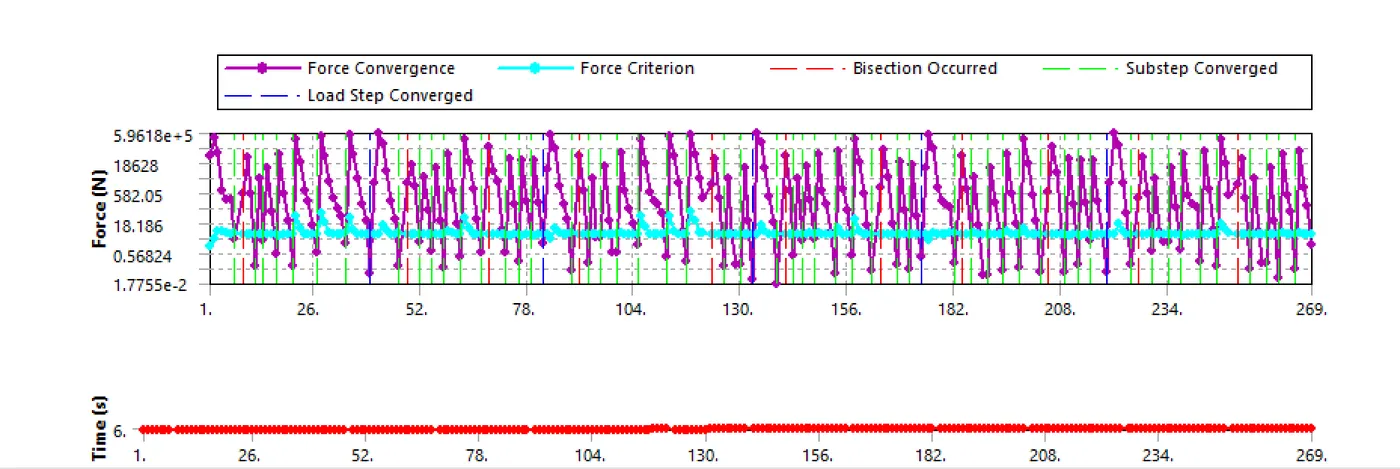
The image below is the force convergence graph, from the graph it is visible that force convergence is intersected with the force criterion so the simulation will run through.
CASE 2
Here the material using is cast steel. Other than that the procedure is same as case 1. Cast steel is missing in this academic version of ANSYS. So created the material using the given properties.
The properties of the material are,
Density 7820 kg m^-3
Young's modulus 2.03E+11 Pa
Poisson's ratio 0.3
Tensile yield strength 3.49E+08 Pa
Tensile ultimate strength 5.05E+08 Pa
Performed the exact same procedure as case 1.
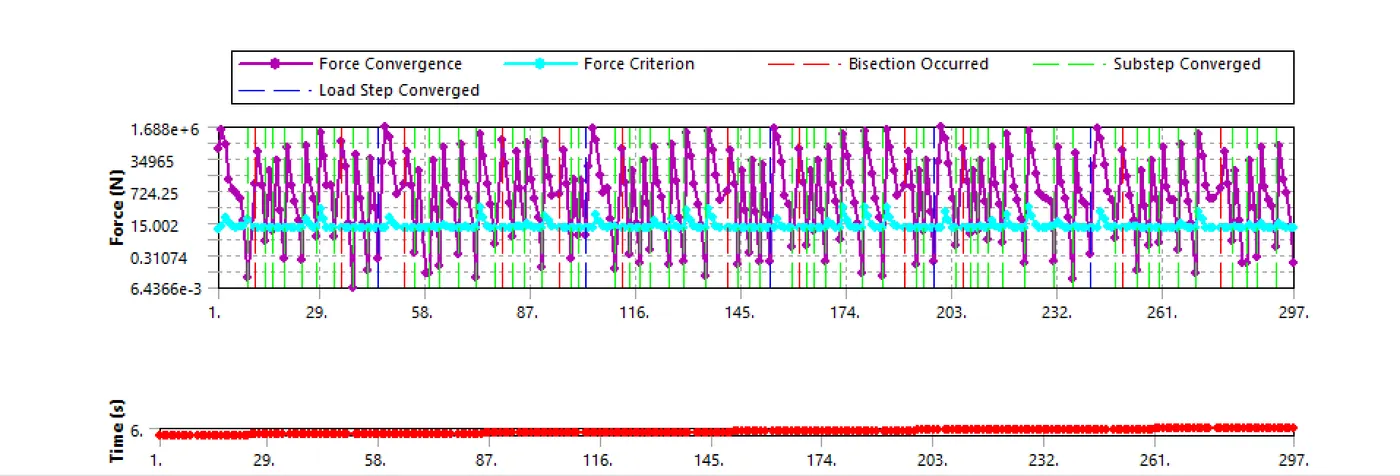
The force convergence graph is shown below, the force convergence is intersected with force criterion. So the simulation will succeed.
CASE 3
Here the material using is cast bronze. Other than that the procedure is same as case 1. Created the material using the properties. The properties of the material is shown below,
Density 8810 kg m^-3
Young's modulus 8E+10 Pa
Poisson's ratio 0.345
Tensile yield strength 1.44E+08 Pa
Tensile ultimate strength 2.67E+08 Pa
Performed the exact same step as case 1.
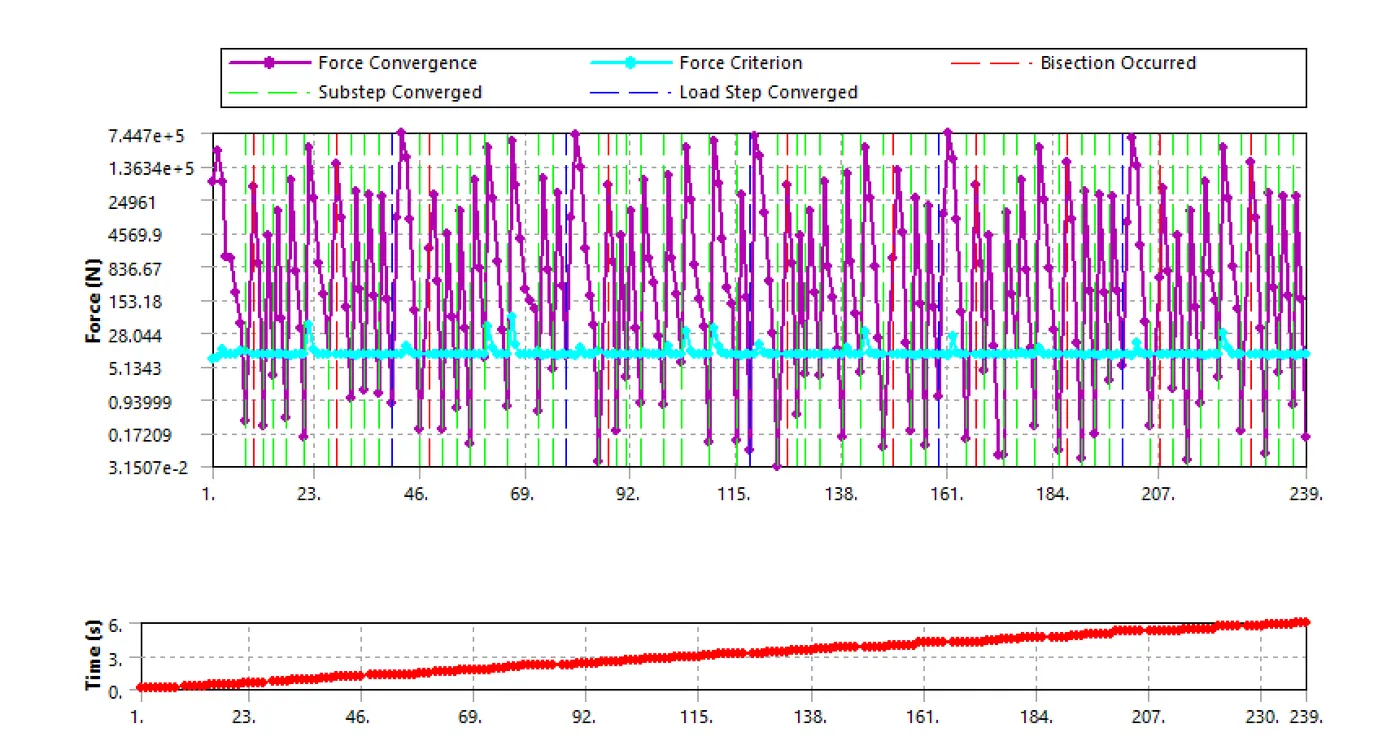
The force convergence graph is shown below. It shows the force convergence intersects with the force criterion. So the simulation will run through.
RESULTS
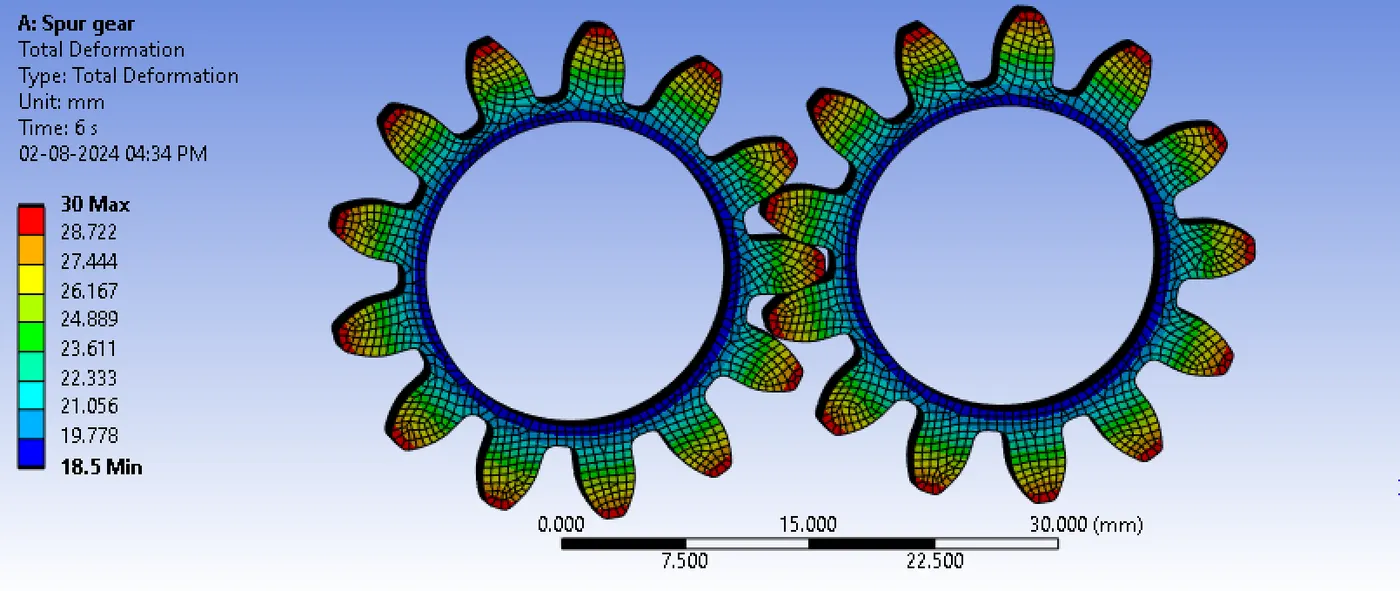
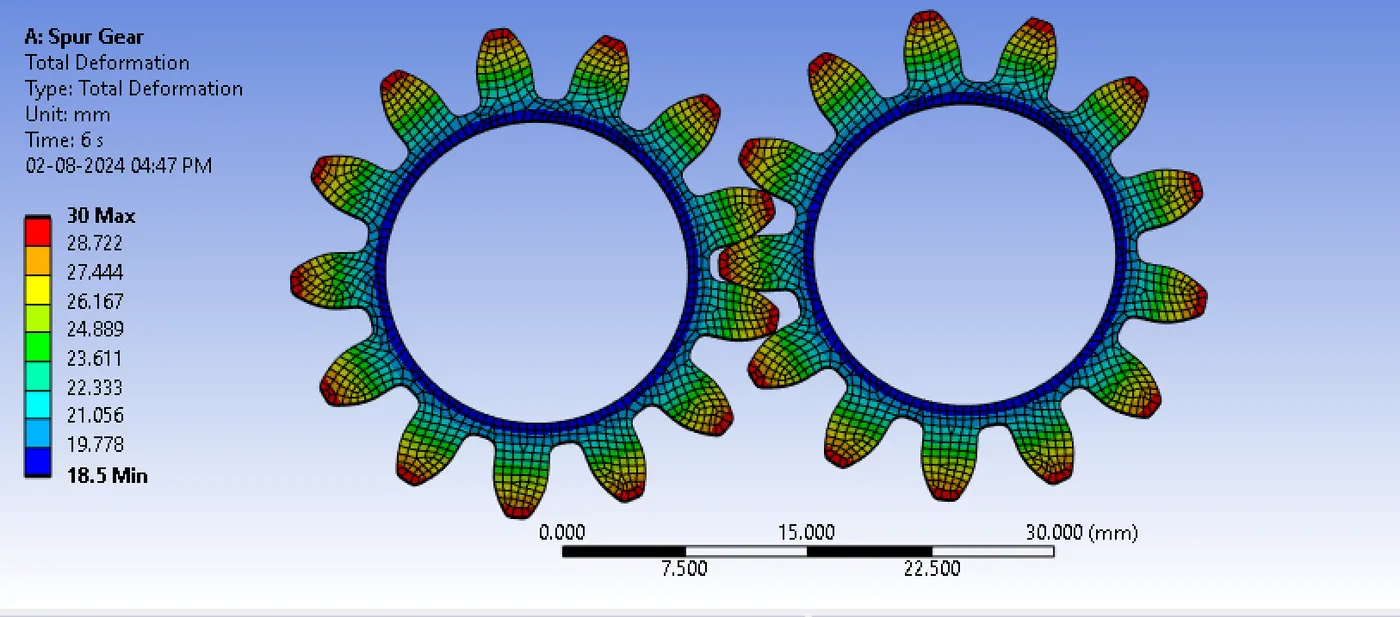
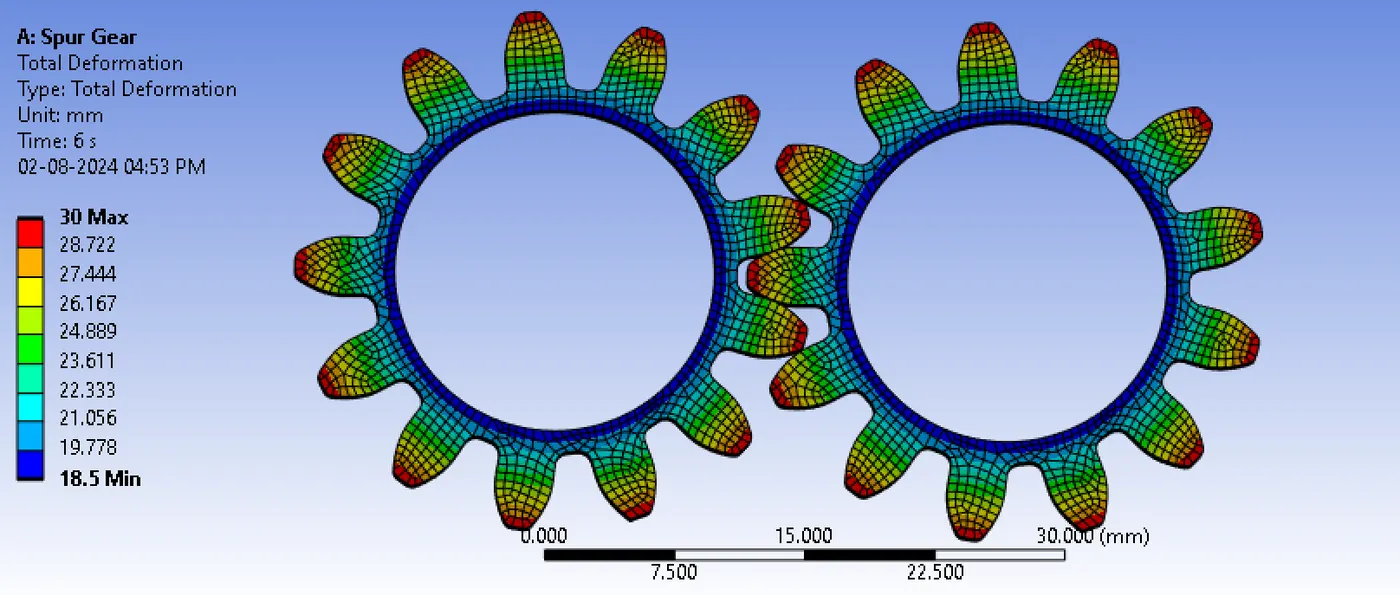
Total deformation of the 3 cases are compared below,
Case Minimum(mm) Maximum(mm) Average(mm)
1 18.5 30 23.599
2 18.5 30 23.599
3 18.5 30 23.599
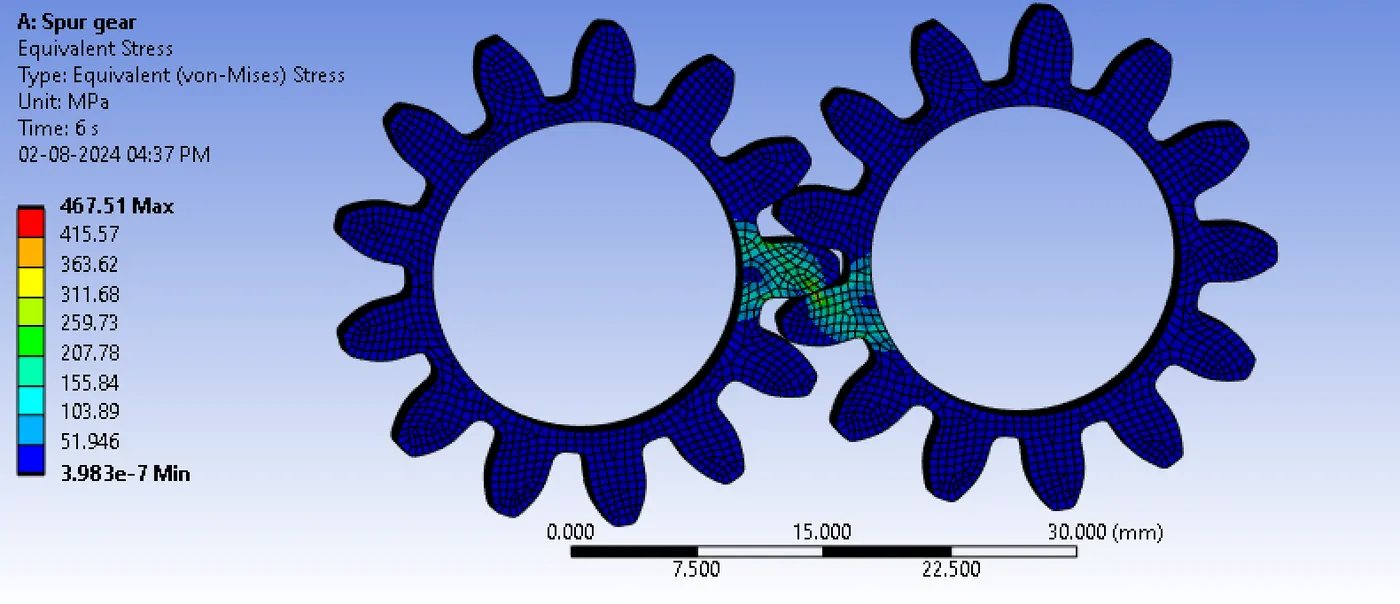
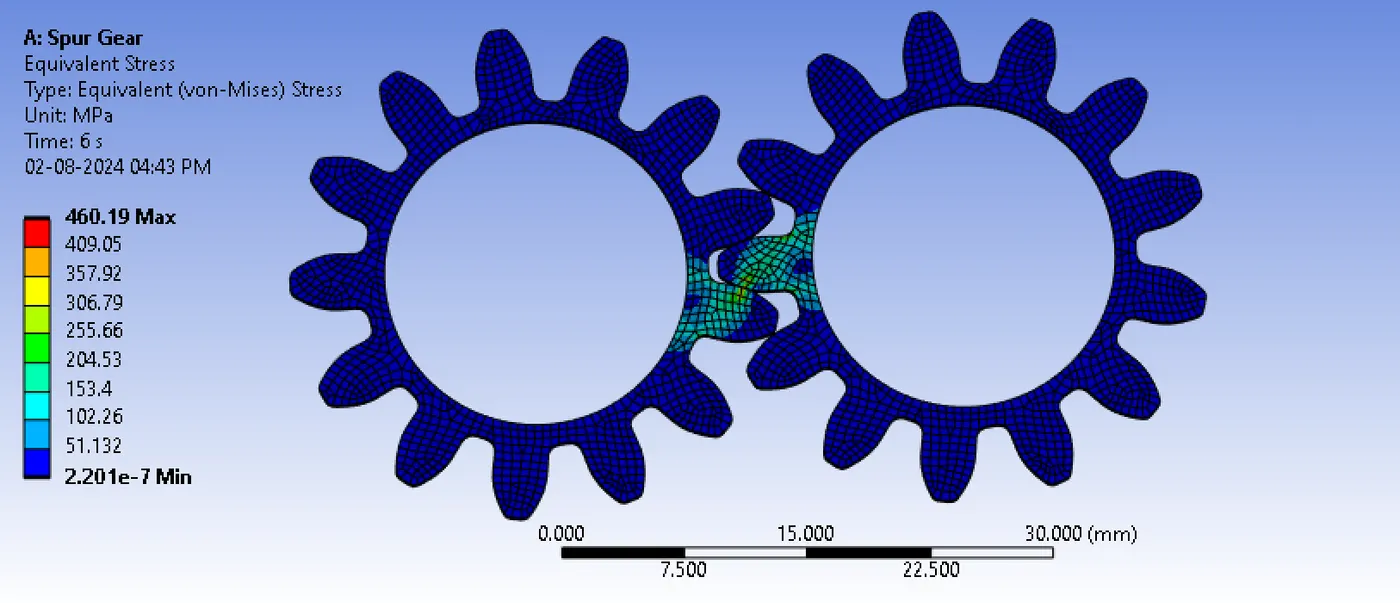
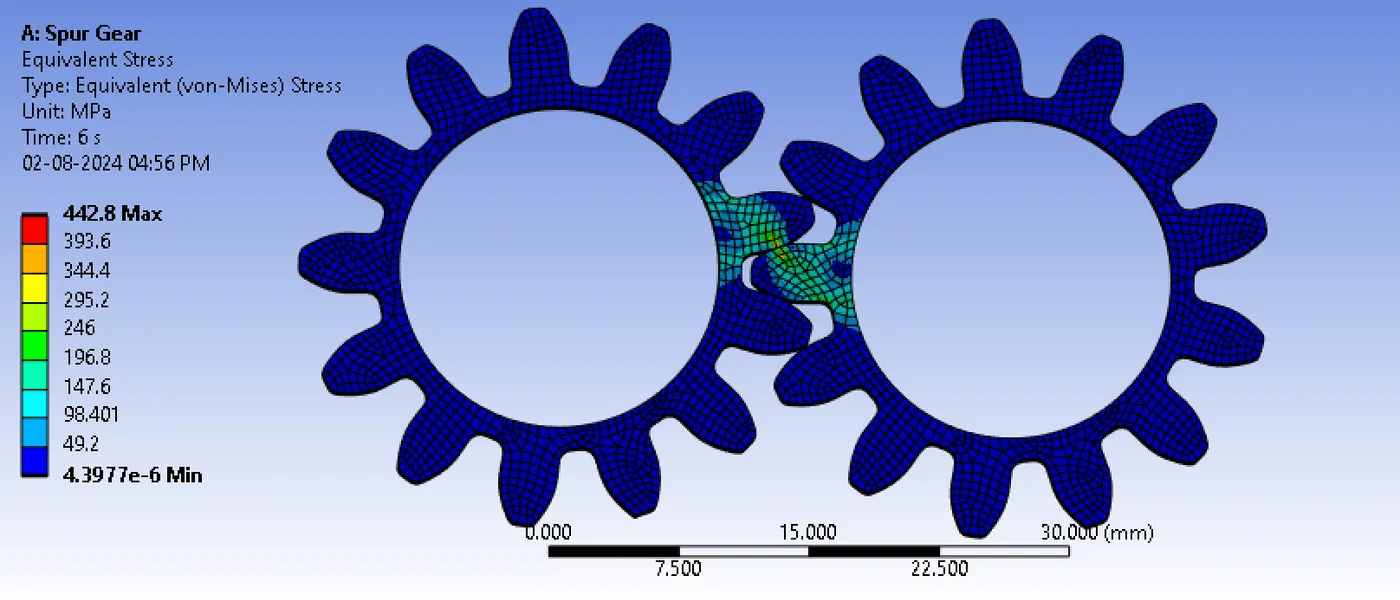
Equivalent stress of the 3 cases are compared below,
Case Minimum(MPa) Maximum(MPa) Average(MPa)
1 3.983e-007 467.51 8.7715
2 2.201e-007 460.19 8.7773
3 4.3977e-006 442.8 8.8133
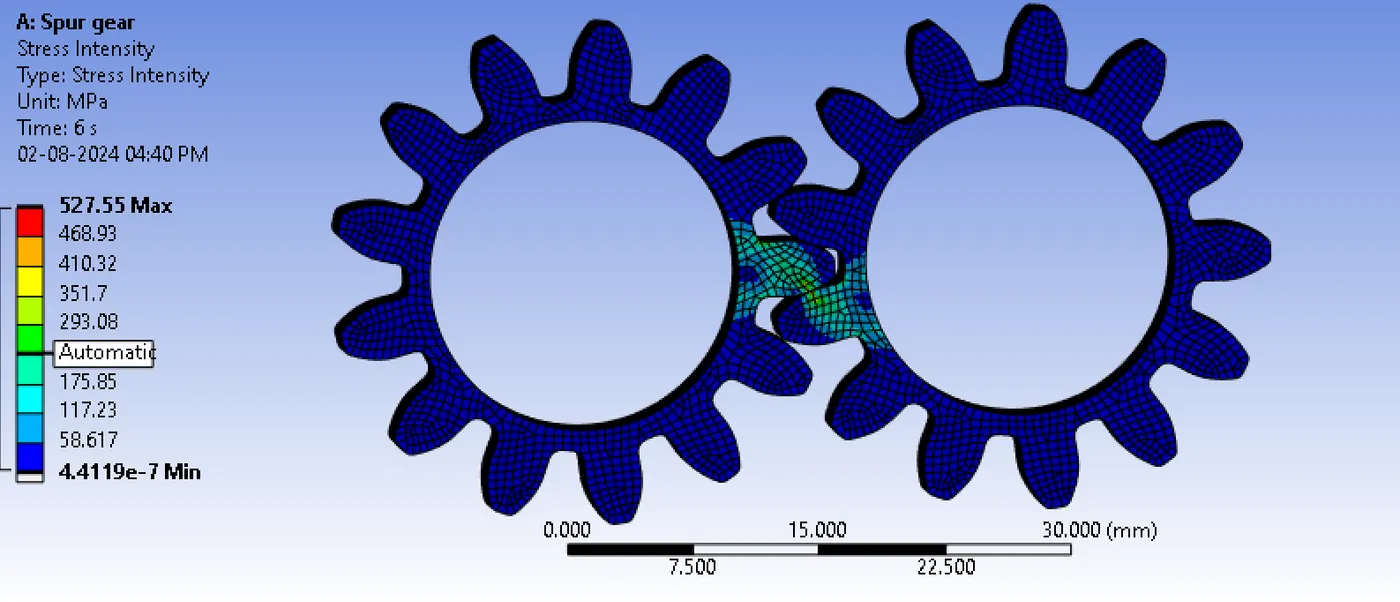
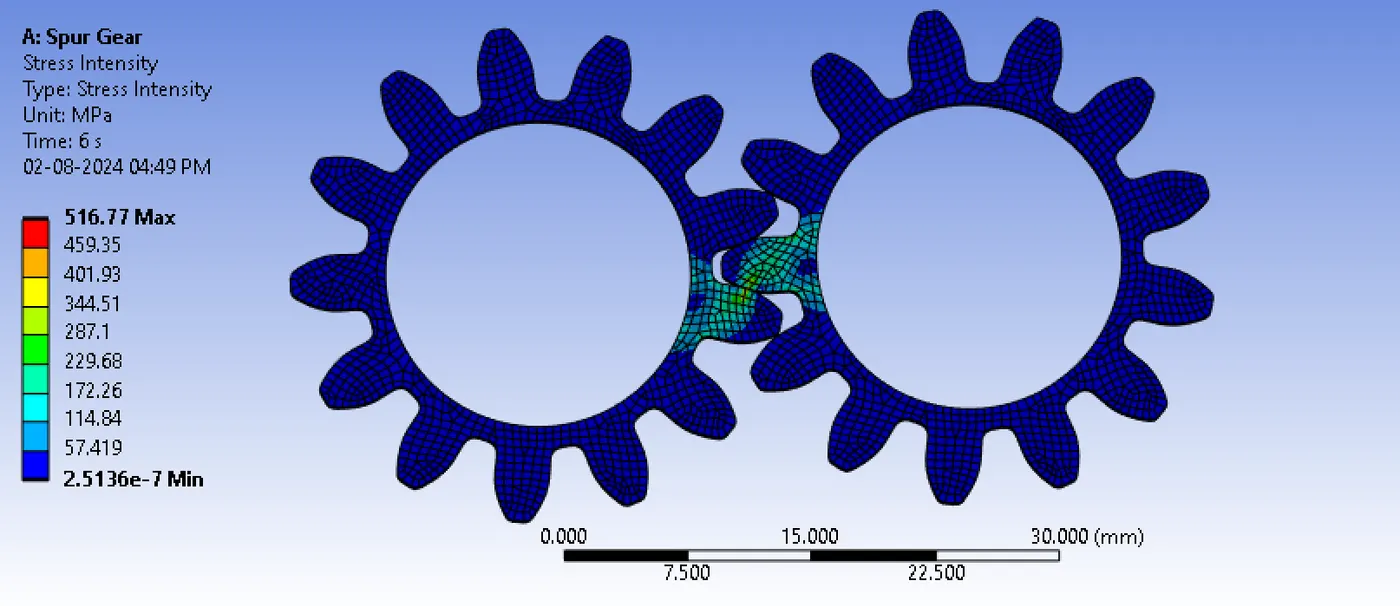
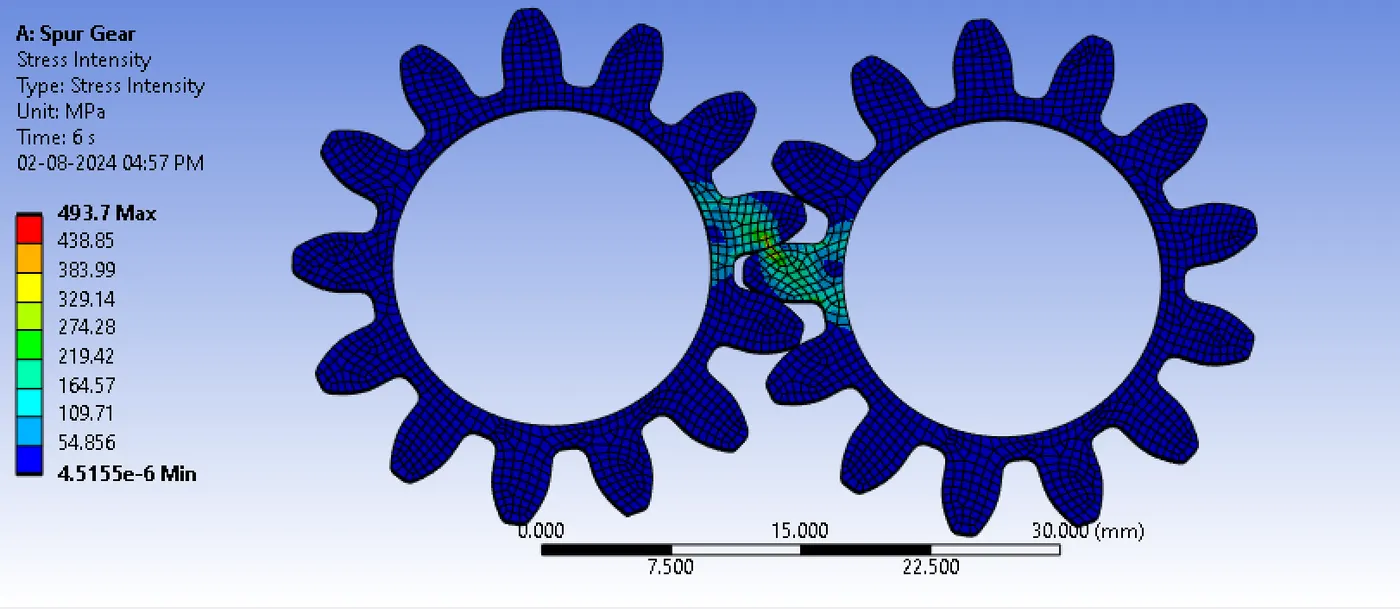
Stress intensity of the 3 cases are compared below,
Case Minimum(MPa) Maximum(MPa) Average(MPa)
1 4.4119e-007 527.55 9.5597
2 2.5136e-007 516.77 9.5849
3 4.5155e-006 493.7 9.6467
The images of the Total deformation of 3 cases are below,
The images of equivalent stress of 3 cases are give below,
The image of stress intensity of 3 cases are given below,
CONCLUSION
The analysis was run successfully. The mesh size and all steps performed are same for the three cases. There was difference in equivalent stress and stress intensity in all 3 cases but total deformation remains same.
On comparing equivalent stress, the maximum stress developed in case 1 is greater than case 2 and case 3 have the least maximum stress developed.
On comparing stress intensity, highest value maximum stress intensity is shown by case 1 and lowest value is shown by case 3.
On relying on the results, I recommend Cast Bronze that is case 3. Because it has lowest value of maximum equivalent stress and maximum stress intensity developed. This model is less likely to get crack due to stress developed and it will also have less stress concentration at the tip of a crack comparing other 2 cases. Between case 1 and case 2, I will recommend case 2 as it has desirable values.
The zip file of simulated models of 3 cases are uploaded. The animations of equivalent stress of 3 cases are uploaded, kindly check all those.