Week 1- Mixing Tee
MIXING TEE
For this challenge, we have two type of mixing tee.
1. Short mixing tee
2. Long mixing tee
1.SHORT MIXING TEE :-
>> This T-joint is use to split the flow of air and we have two type of air which is hot air and chilled air after mixing both air we will get the desired air . First of all ,we have to go inside Ansys workbench then we have to drag the fluid flow and drop over the screen.After that we have to go inside edit geometry in space claim . we have import the geometry inside the space claim . Then we have to creat a solid model by using volume extract command because it is use for future analysis. After we have to click on suppress the physics because we don't need outer part.By using this we can hide the outer part.Once we completed geometrical cleanup, then we have to close the space claim.
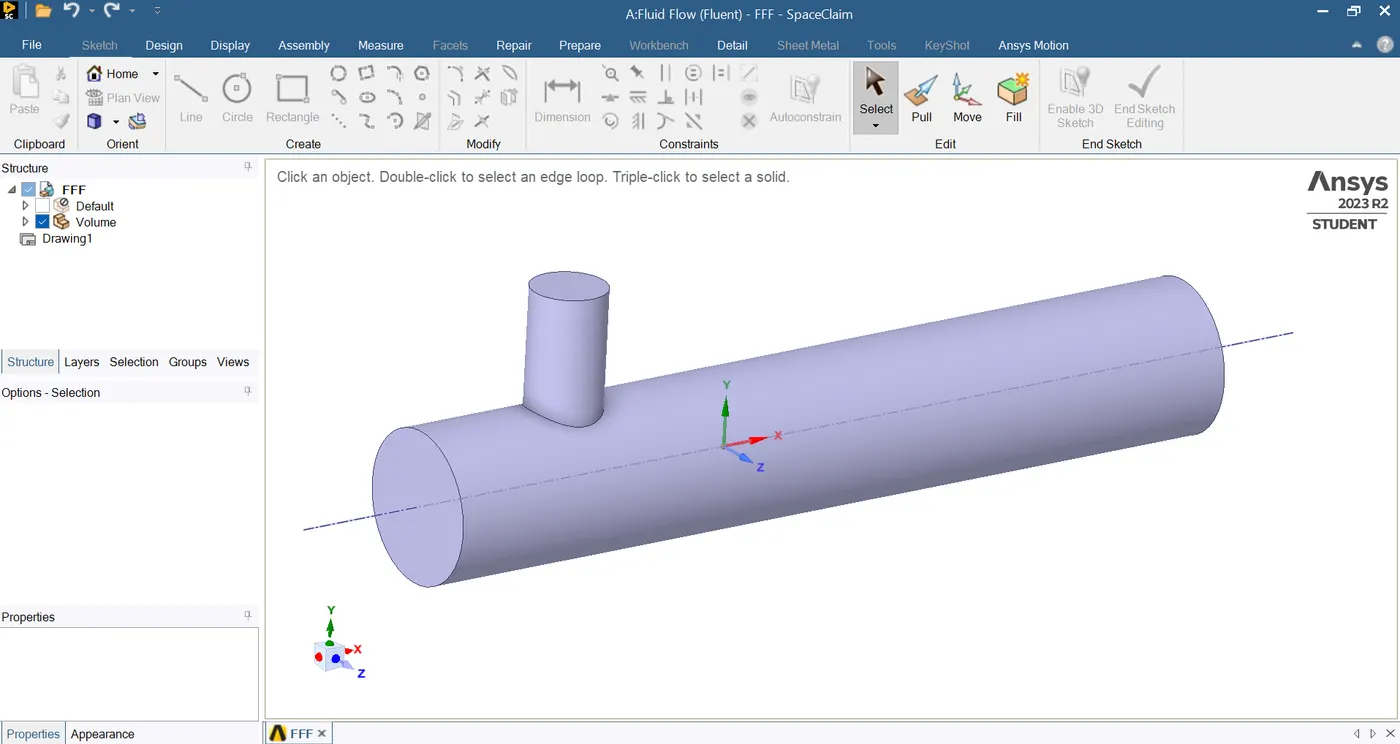
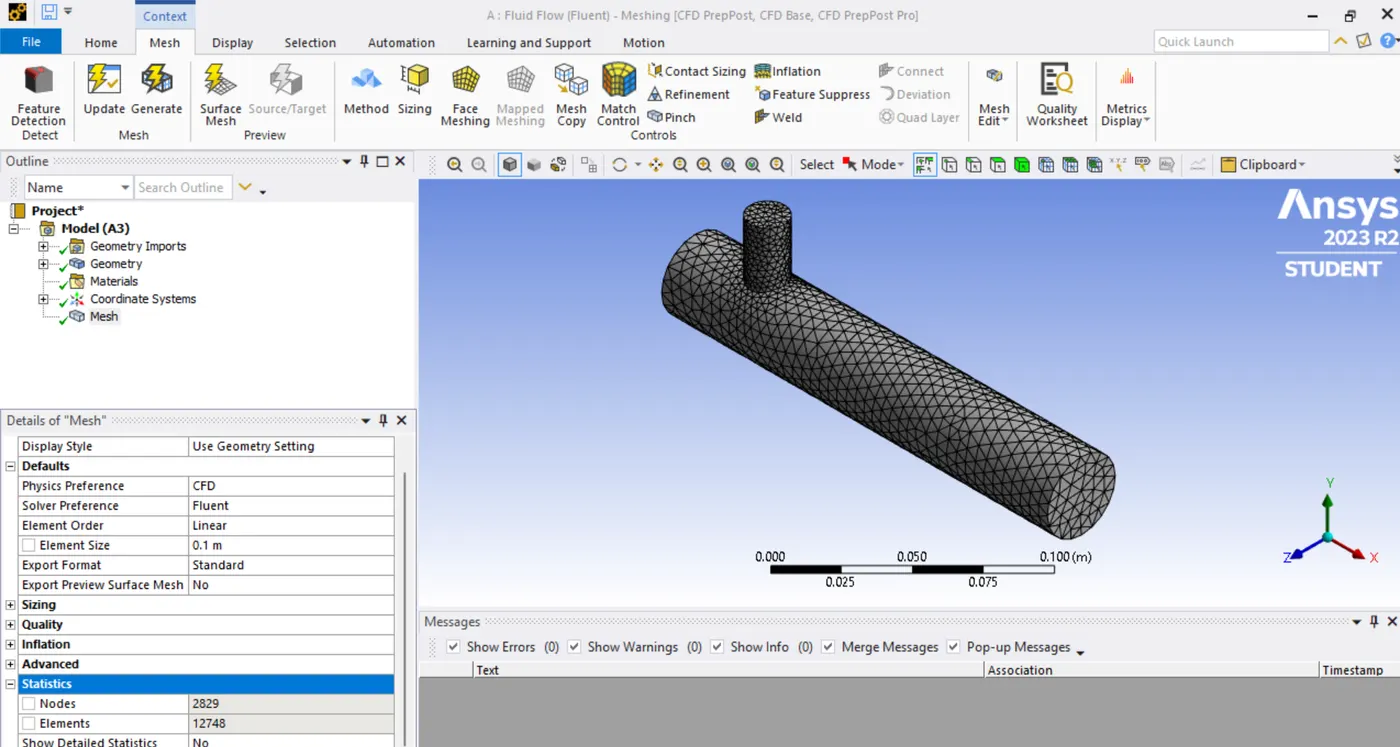
>>We have to go inside Mesh option. We have to give the element size is 0.1. After that we have to go inside mesh option then we have to click on generate mesh. After i completed meshing then I got to total element count is 12748 .
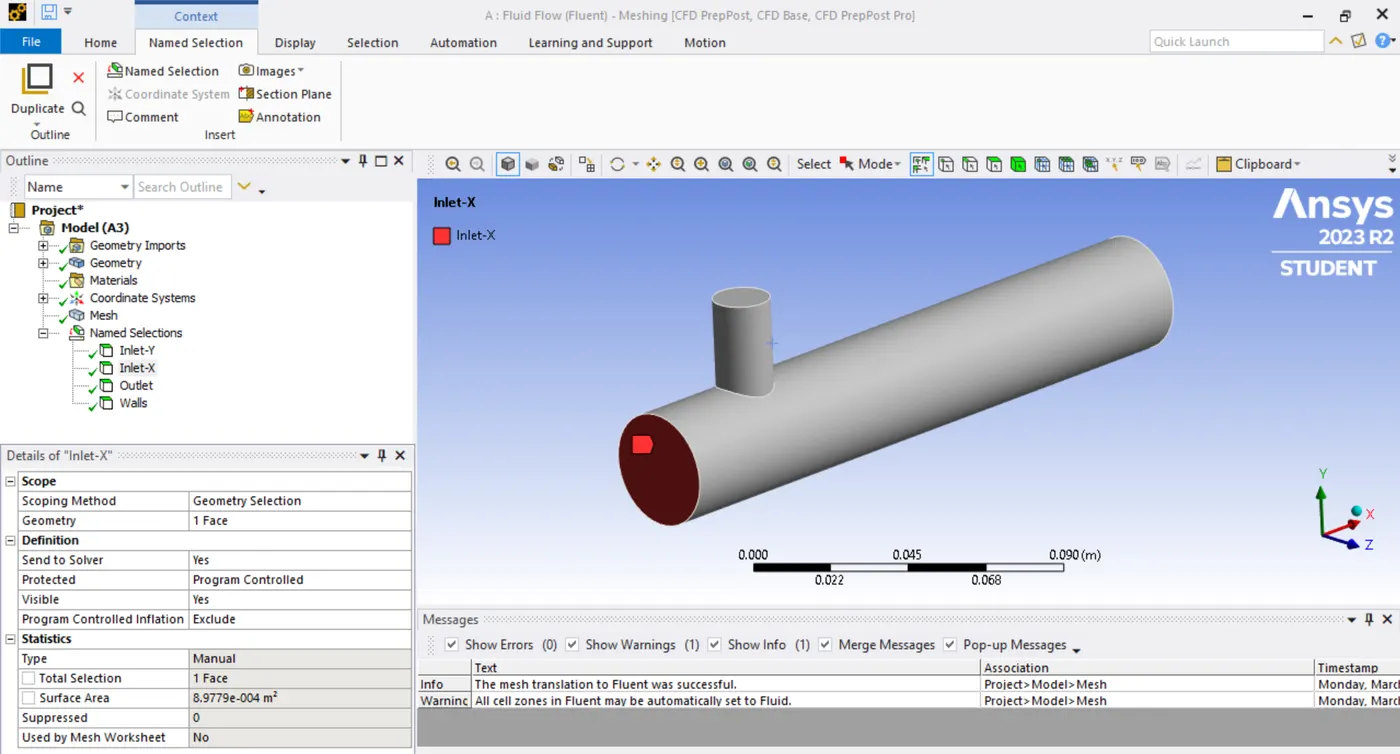
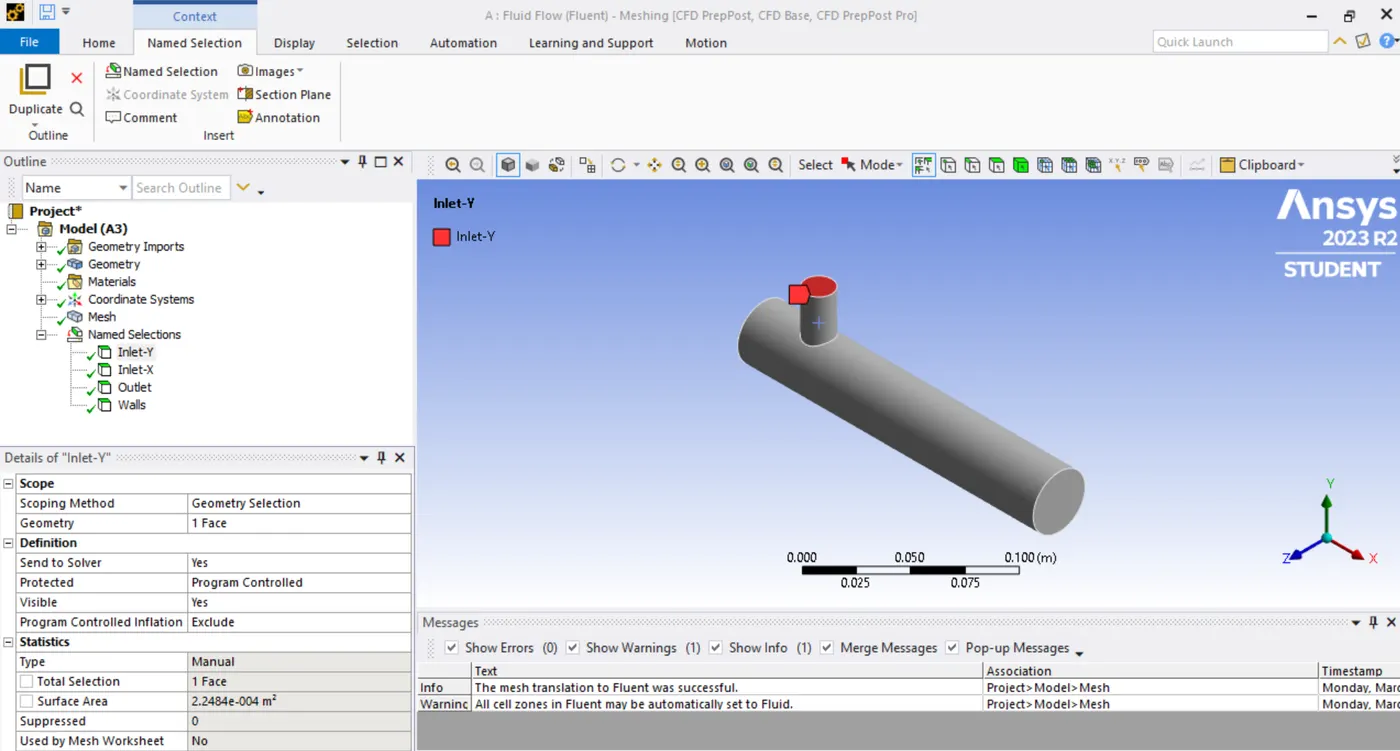
>>We have to right click on face inside the solid model then we have to click on Create Named Selection . Then we have give the name like Inlet-X( X Axis), Inlet-Y( Y Axis), Outlets and Walls .It seems like,
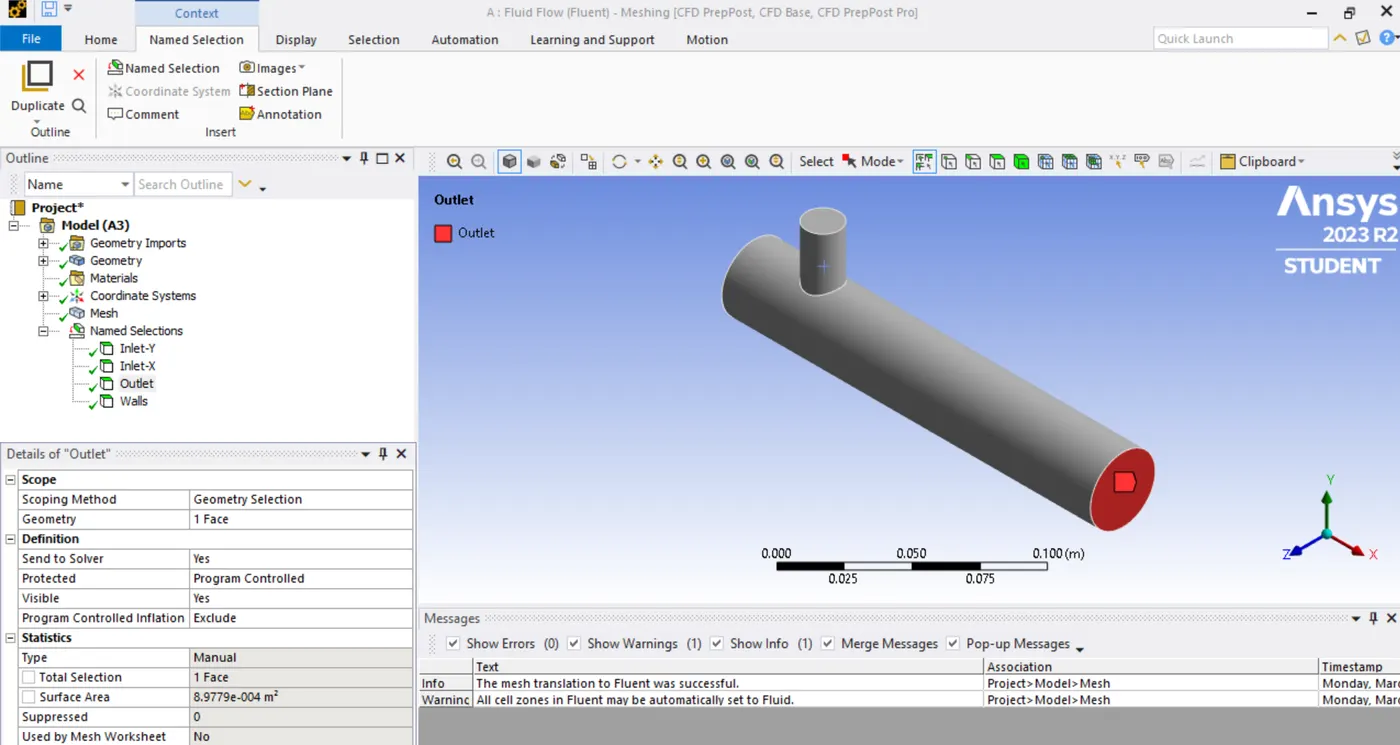
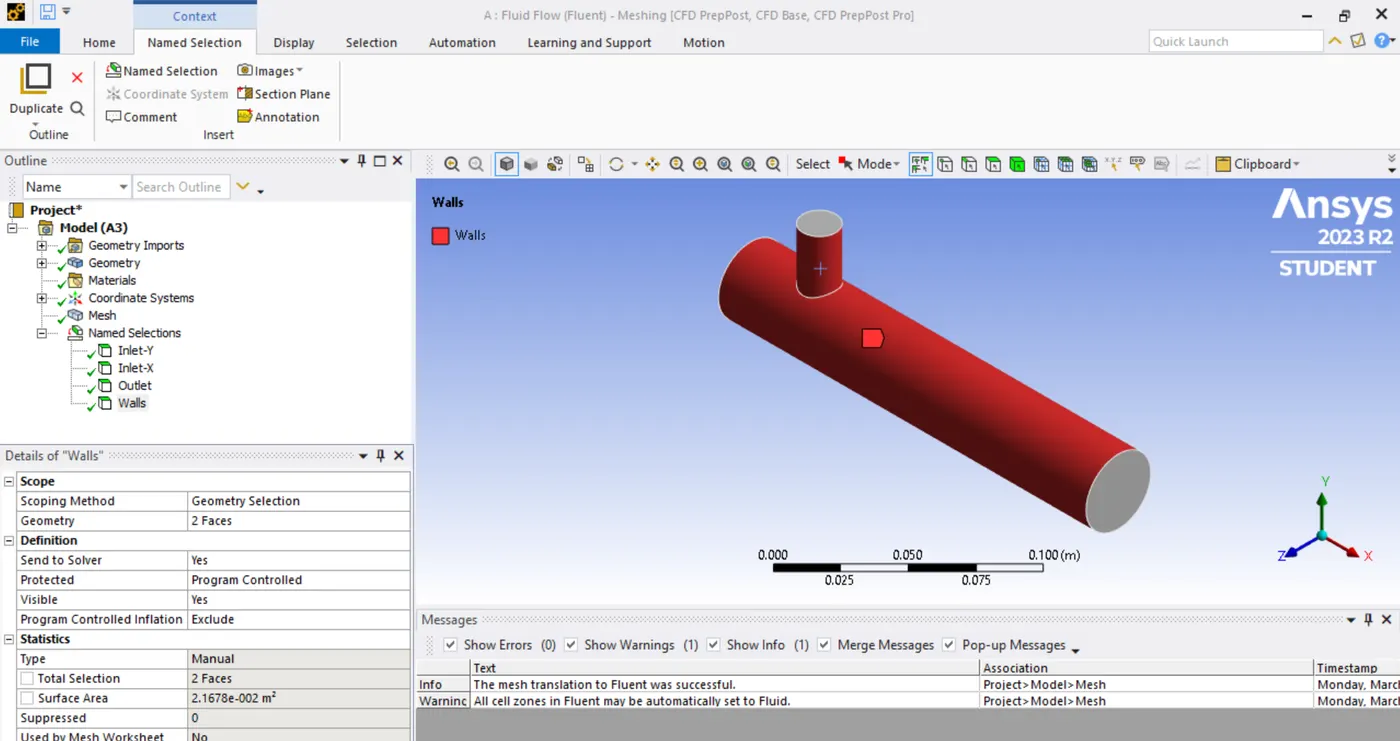
Once we completed all of process inside meshing then we have to close the mesh.
>>Case-1 (a) Short mixing tee with a hot inlet velocity of 3m/s. (b) Momentum ratio is 2 :-
K-EPSILON - >>We have to go inside setup .Then we have to check the mesh inside console If it is showing Our meshing display .....done then we have to go next step. We have to click on Units and go to temperature then change it kelvin to celsius.After we have to click on energy in Physics option . Then click on Viscous(Turbulence) , Inside this having K-epsilon and K-omega, First we have to use k-epsilon Then we have to take K-omega .After this both cases and based on your judgment use the more suitable model for further cases. we have to go inside material , we have put air inside the material type then save and close it. After we have to go inside Cell zones , in cell zone also we can the material type .
>> Then select Boundaries, Inside boundaries we have 4 type of faces which is Inlet-X, Inlet-Y, Outlet and Walls . Then we have to put hot inlet velocity of 3m/s and temperature is 360C inside the Inlet-X. we have take 2 then we have to equal both hot inlet and momentum ratio is 2 then we will got first inlet velocity at cold inlet which is 6m/s and temperature is 190C. Then inside outlet Gauge Pressure should be zero and inside walls no need to change its automatically taken. we have to go inside Definitions ,we have to select Area-weighted Average and Standard Deviations then it will as two report page .From this report page we will got how much output coming inside the outlet. After we have to go inside the Initialization,then We have to select on hybrid , click on initialize .Once intialize is done it shown like,
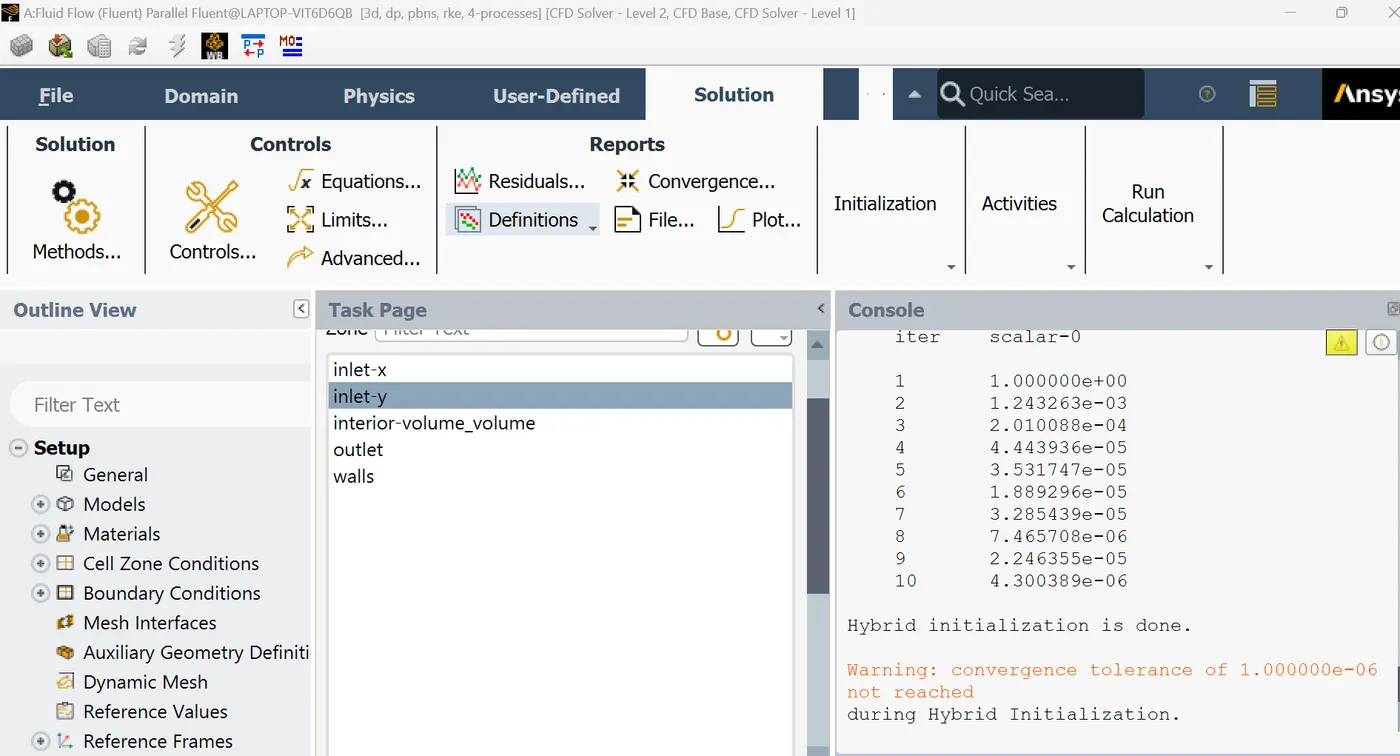
>> After we have to go inside Run Calculation, then we have to put number of itration is 200 and click on calculate. Once this itration is completed then we will result inside the repot page and it shown like,
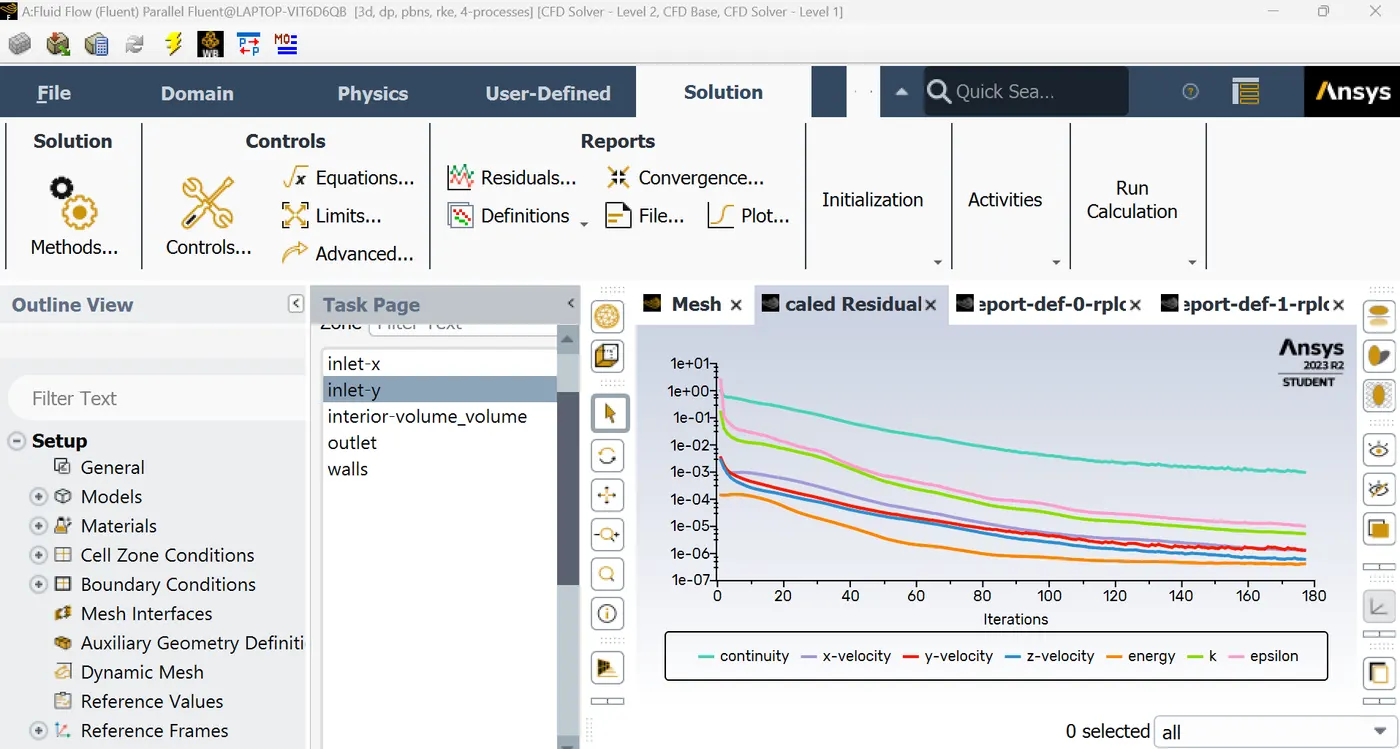
>>we got report Area-weighted Average and Standard Deviations. it shown like,
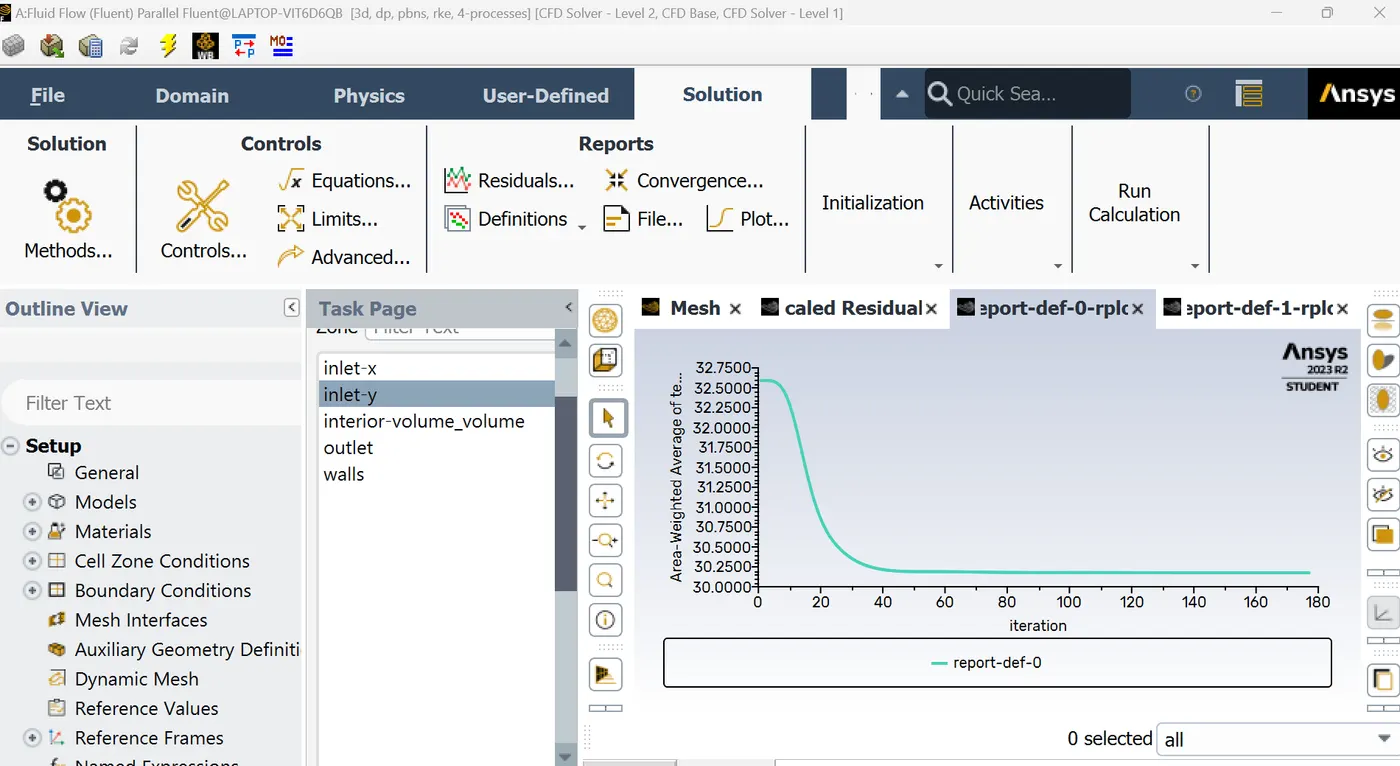
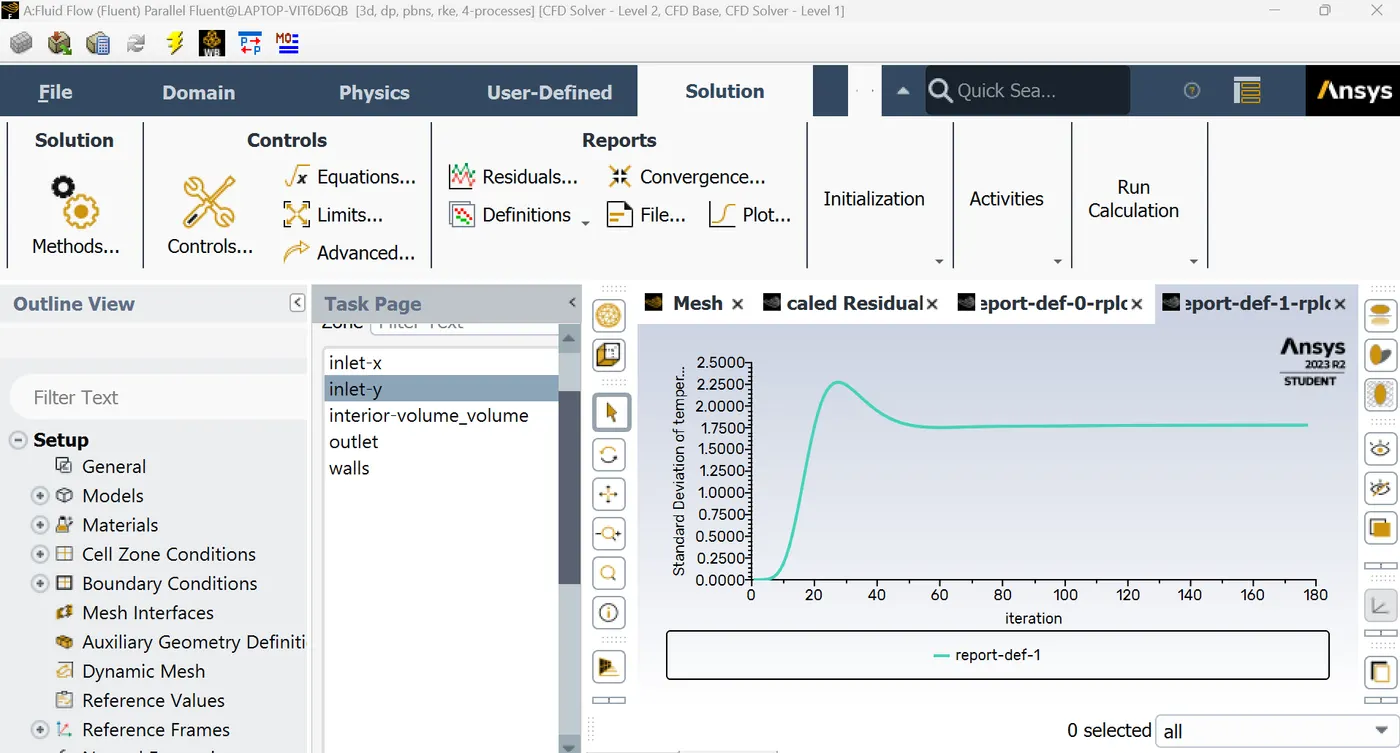
>> Then we have to compute the Area-weighted Average and Standard Deviations in Report Definitions. we got output temperature is 30.175342 .It shown below as
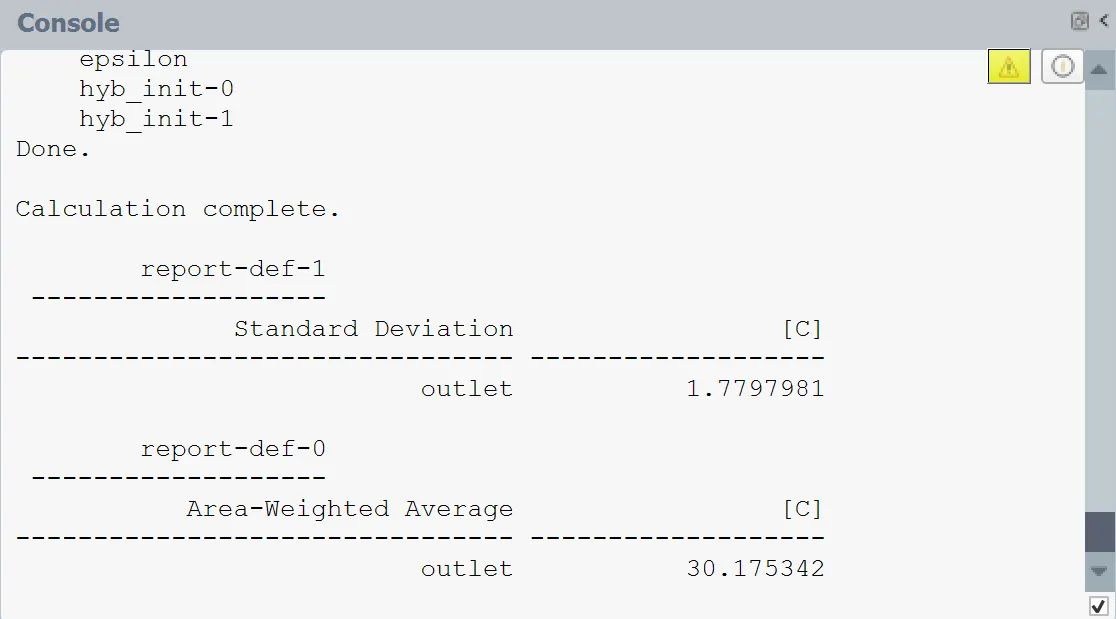
Once We completed all of process inside the Solution then save and close it.
>> We have to double click on result , once we entered inside results then we have to hide the Inlet-X, Inlet-y and Outlets. We have work on Walls then click on walls , change the colour to white and for batter visiblity inside the wall we will make it as a transparency by given the value of transparent. Then we have to go inside Insert,click on Location then add a XY-plane inside the mixing tee . We have to go inside the XY-plane and click on colour then change to variable after that we have to put temperature inside the variable then apply it.Then we have to go inside Default legend view and in precision we have the format type then we will change Scientific to Fixed format.It shown like,
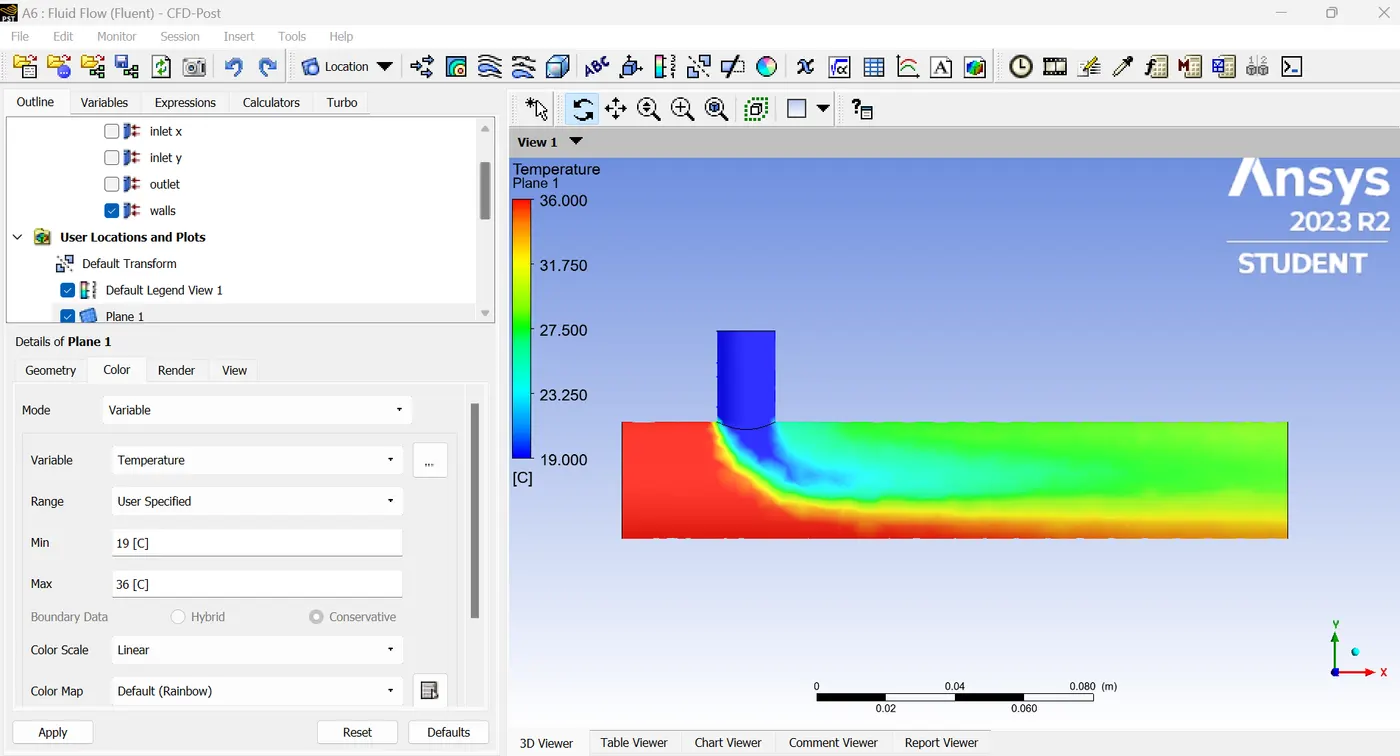
>>From this report we are not getting that much of good results.Then we have to go with another momentum ratio .
K-OMEGA:-
>> Again we have to go inside the Viscous(Turbulence) , Inside this we have select on K-omega and also we have to select SST. Then we have to Click on initialization.Once intialize is done then we have click on run calculation , after we have give the number of iteration is 200 and click on calulate.It show like,
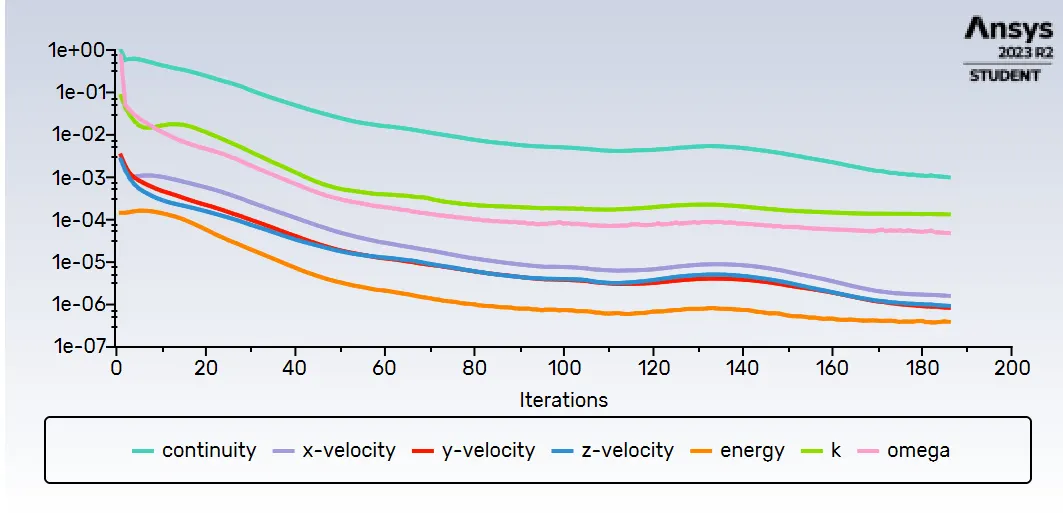
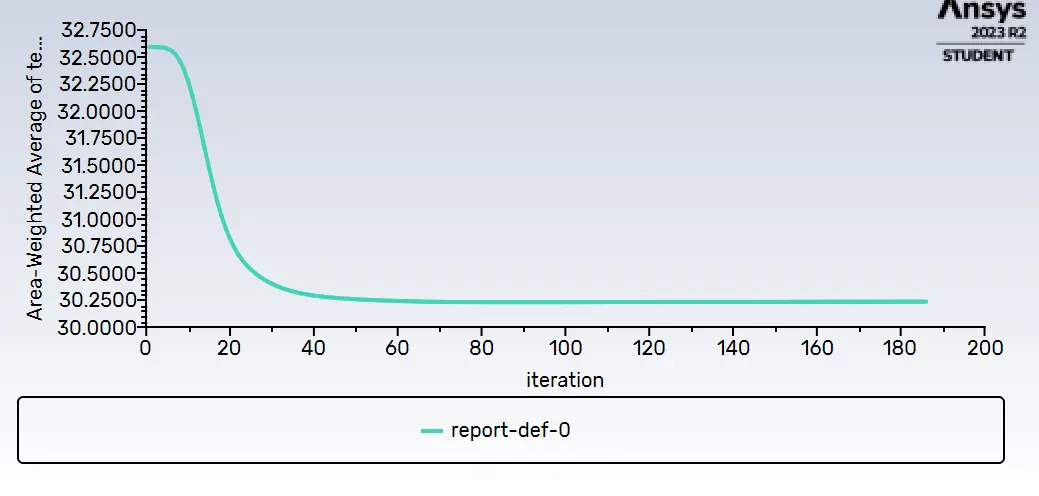
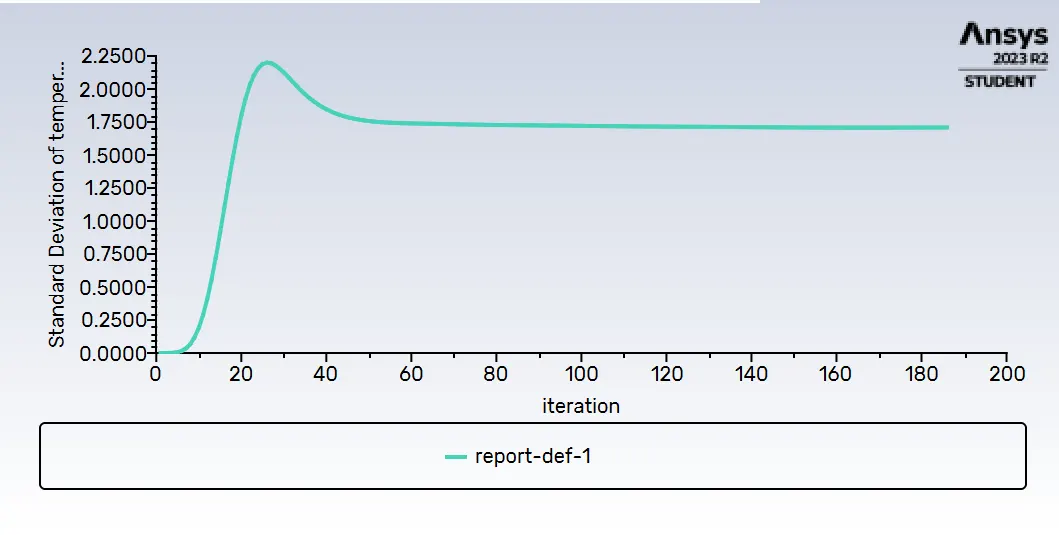
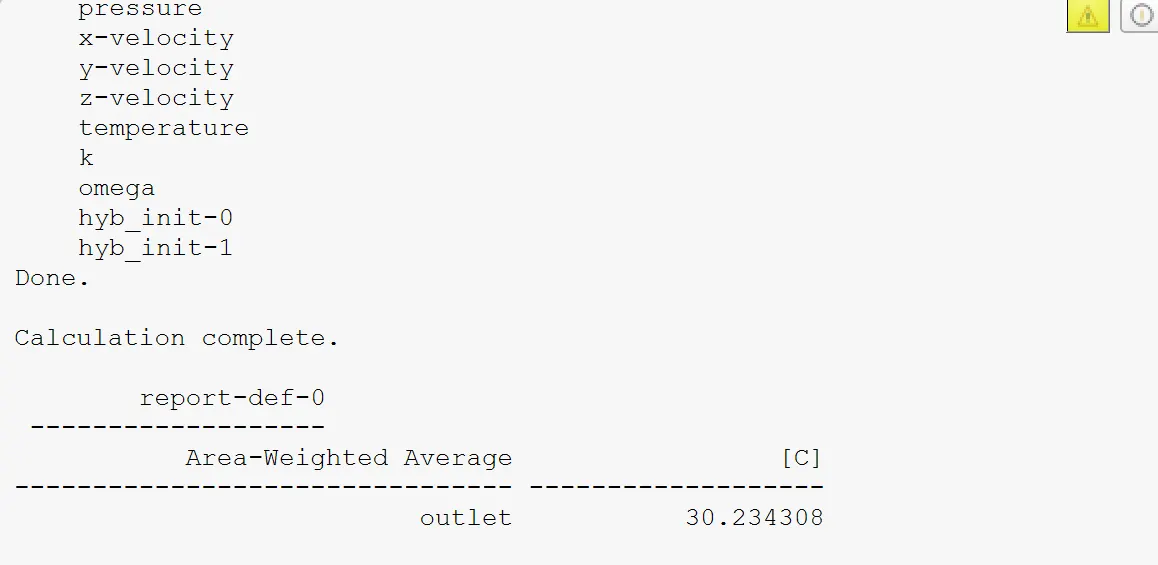
>> Then we have to compute the Area-weighted Average and Standard Deviations in Report Definitions. we got output temperature is 30.234308 .It shown below as
>>Same procedure we have to apply on results,then it showing like this,
COMPARISON BOTH K-EPSILON AND K-OMEGA :-
>> we are use k-epsilon then we got output temperature is 30.175342 .Again we are using k-omega then we will got output temperature is 30.234308. If we are compair both of this we got good result in k-epsilon and k-omege is not given that much good result . But both are having little bit difference.
(b) Momentum ratio is 4:-
K-EPSILON:-
>>Again we have go inside Setup .Then we have to select the Viscous(Turbulence) and select the K-Epsilon.After select Boundaries, Inside boundaries we have 4 type of faces which is Inlet-X, Inlet-Y, Outlet and Walls . Then we have to put hot inlet velocity of 3m/s and temperature is 360C inside the Inlet-X. we have to equal both hot inlet and momentum ratio is 4 then we will got first inlet velocity at cold inlet which is 12m/s and temperature is 190C. Then inside outlet Gauge Pressure should be zero and inside walls no need to change its automatically taken. we have to go inside Definitions ,we have to select Area-weighted Average and Standard Deviations then it will as two report page .From this report page we will got how much output coming inside the outlet. After we have to go inside the Initialization,then We have to select on hybrid , click on initialize .Once intialize is done it shown like,
>> After we have to go inside Run Calculation, then we have to put number of itration is 200 and click on calculate. Once this itration is completed then we will result inside the repot page and it shown like,
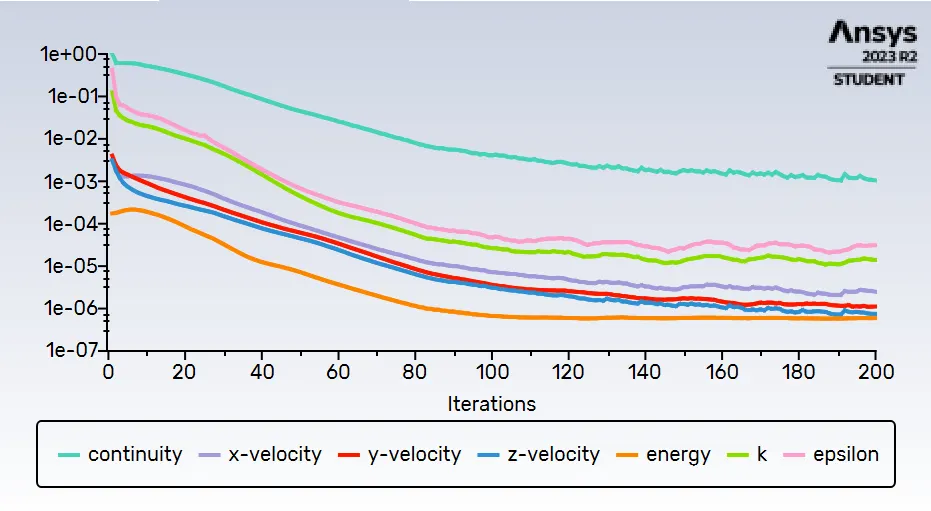
>>we got report Area-weighted Average and Standard Deviations. it shown like,
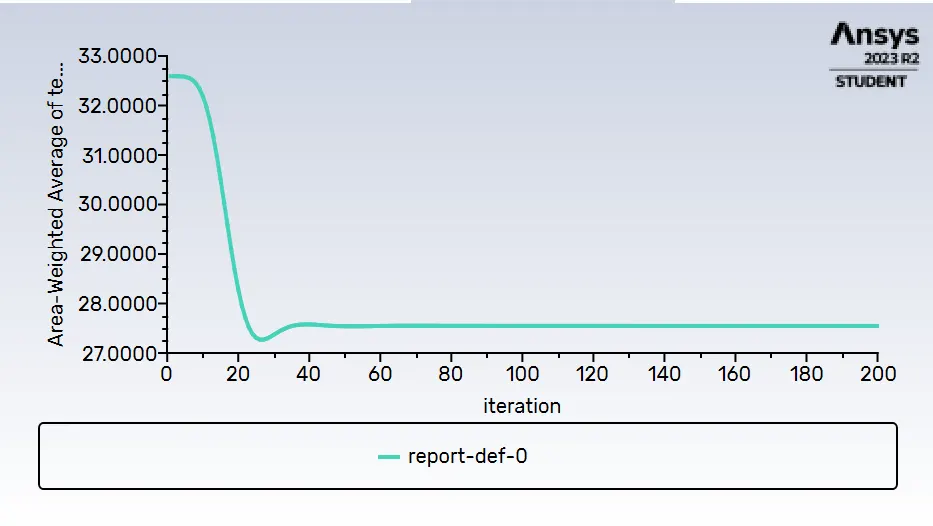
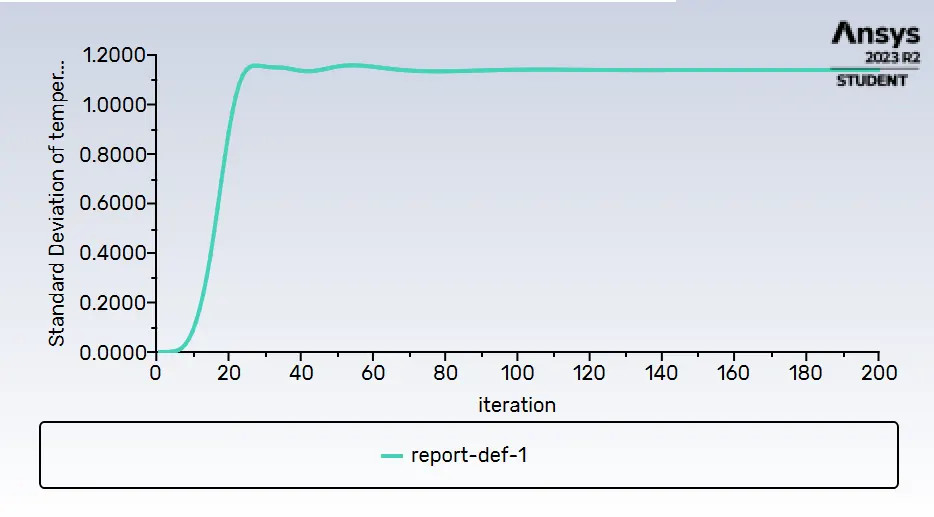
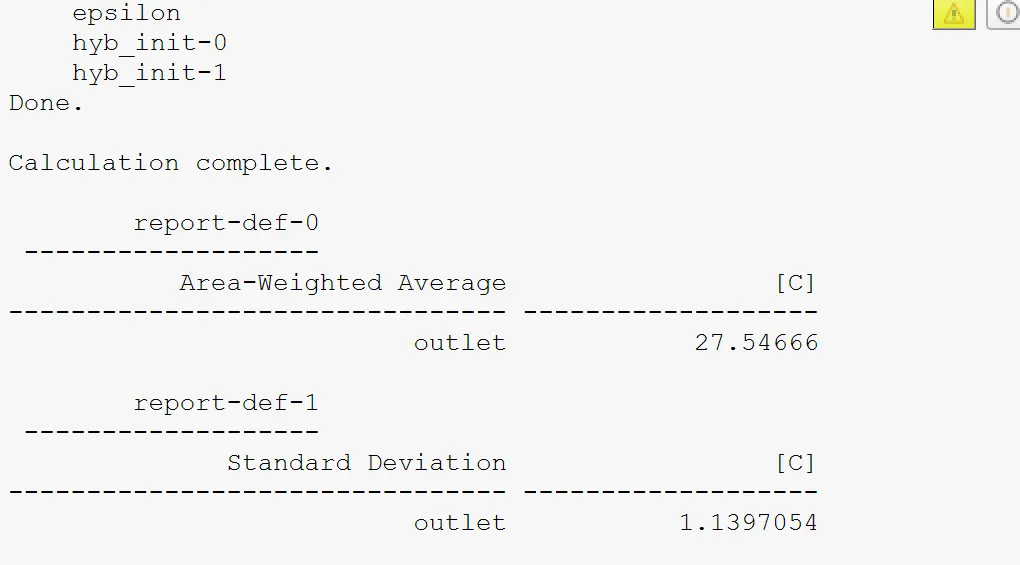
>> Then we have to compute the Area-weighted Average and Standard Deviations in Report Definitions. we got output temperature is 27.54666 inside the cansole .It shown below as
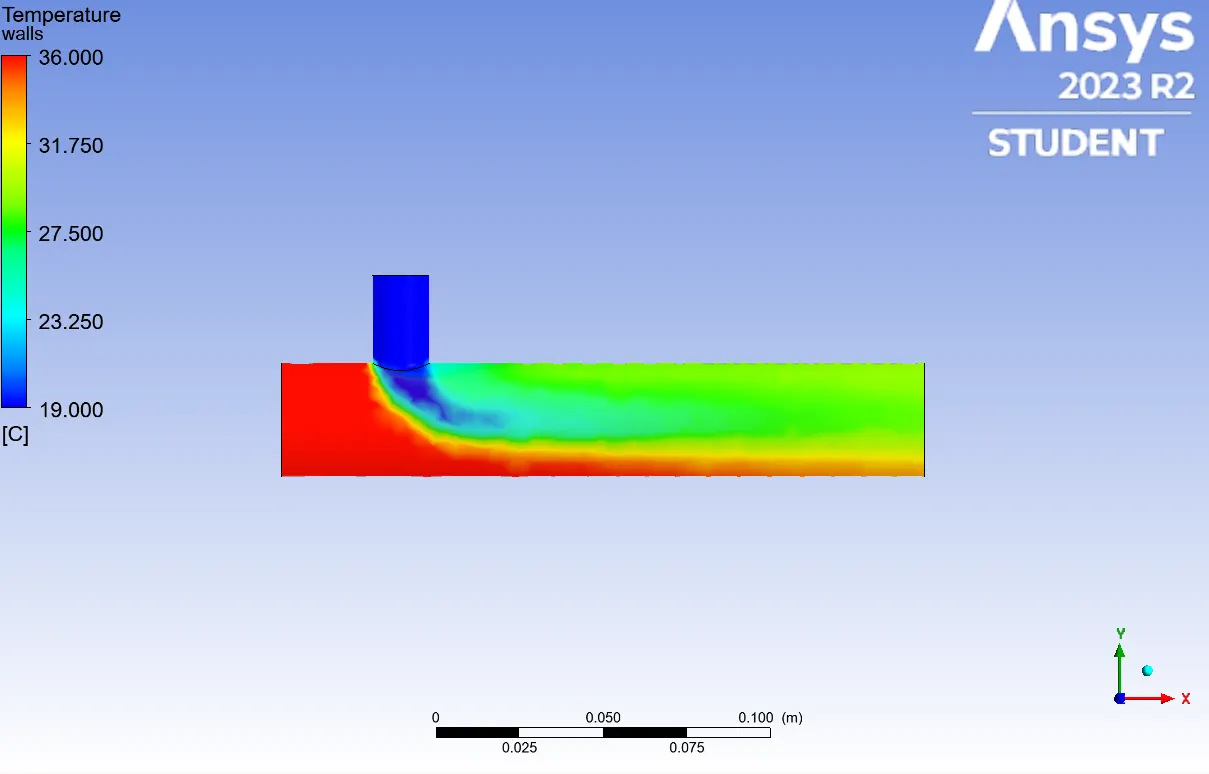
>> We have to double click on result , once we entered inside results then we have to hide the Inlet-X, Inlet-y and Outlets. We have work on Walls then click on walls , change the colour to white and for batter visiblity inside the wall we will make it as a transparency by given the value of transparent. Then we have to go inside Insert,click on Location then add a XY-plane inside the mixing tee . We have to go inside the XY-plane and click on colour then change to variable after that we have to put temperature inside the variable then apply it.Then we have to go inside Default legend view and in precision we have the format type then we will change Scientific to Fixed format.It shown like,
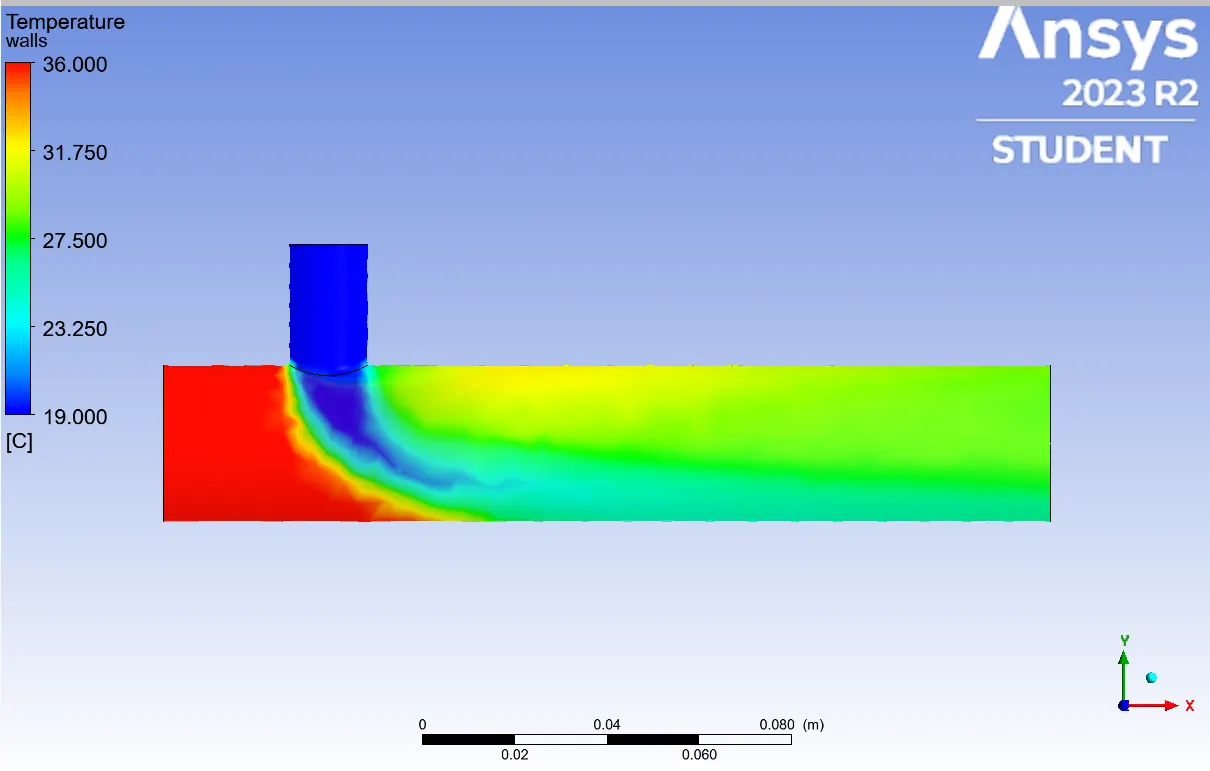
>> From this report we are getting good results.
K-OMEGA:-
>> Again we have to go inside the Viscous(Turbulence) , Inside this we have select on K-omega and also we have to select SST. Then we have to Click on initialization.Once intialize is done then we have click on run calculation , after we have give the number of iteration is 200 and click on calulate.It show like,
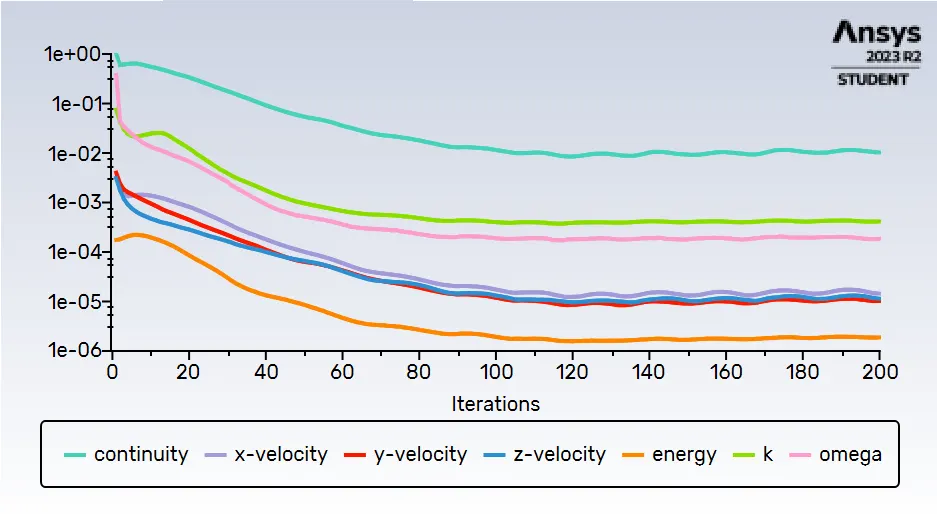
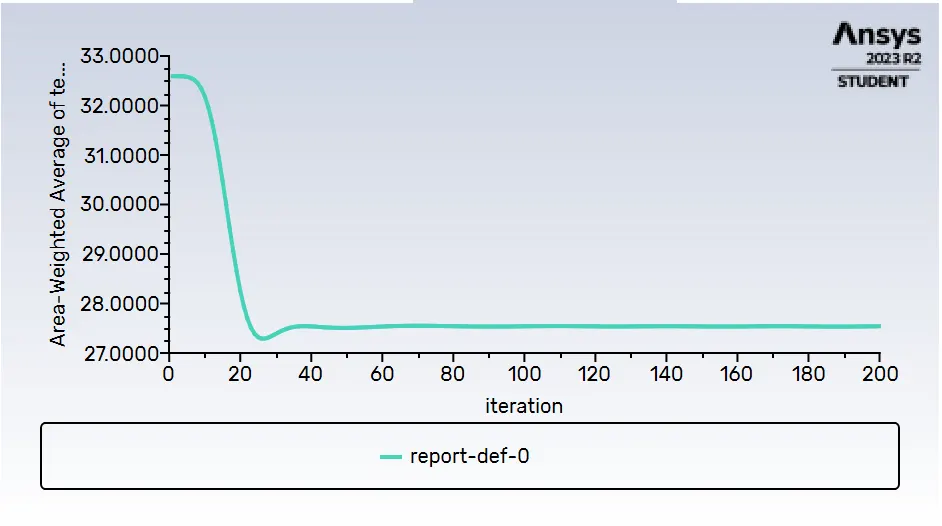
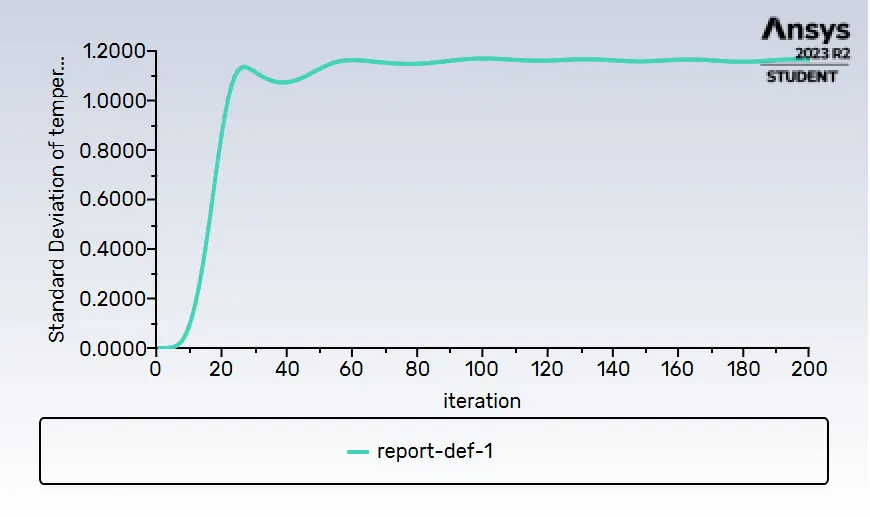
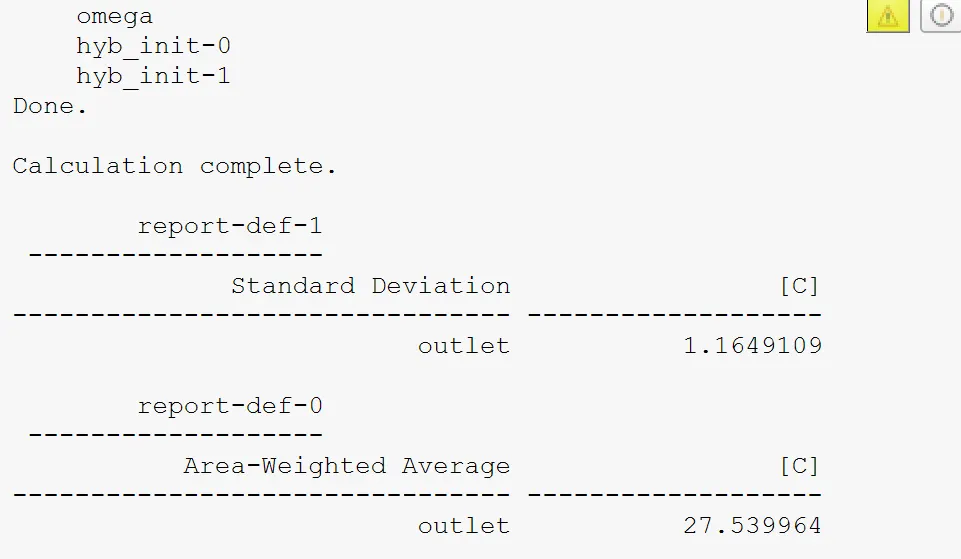
>> Then we have to compute the Area-weighted Average and Standard Deviations in Report Definitions. we got output temperature is 27.539964 .It shown below as
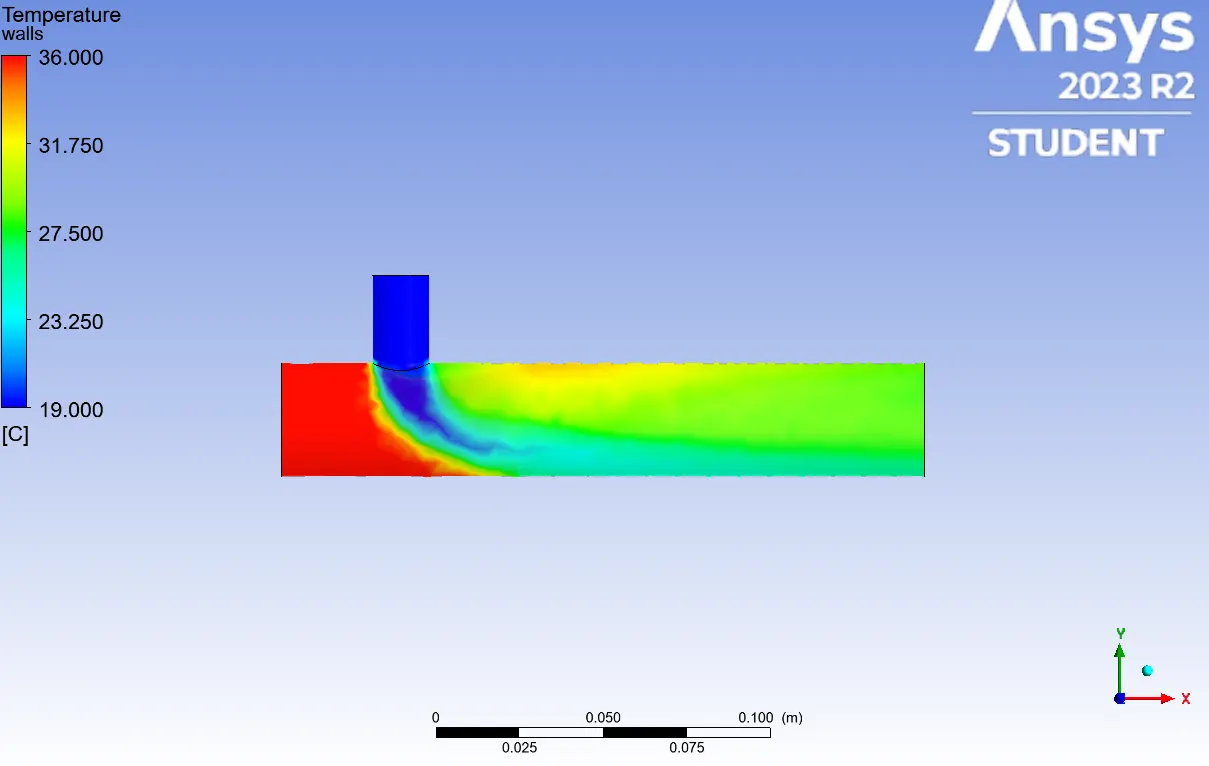
>>Same procedure we have to apply on results,then it showing like this,
COMPARISON BOTH K-EPSILON AND K-OMEGA :-
>> we are use k-epsilon then we got output temperature is 27.54666 .Again we are using k-omega then we will got output temperature is 27.539964 . If we are compair both of this we got good result . But both are having little bit difference.
2.Long Mixing Tee :-
>> We have to go inside edit geometry in space claim . we have import the geometry inside the space claim . Then we have to creat a solid model by using volume extract command because it is use for future analysis. After we have to click on suppress the physics because we don't need outer part.By using this we can hide the outer part.Once we completed geometrical cleanup, then we have to close the space claim.
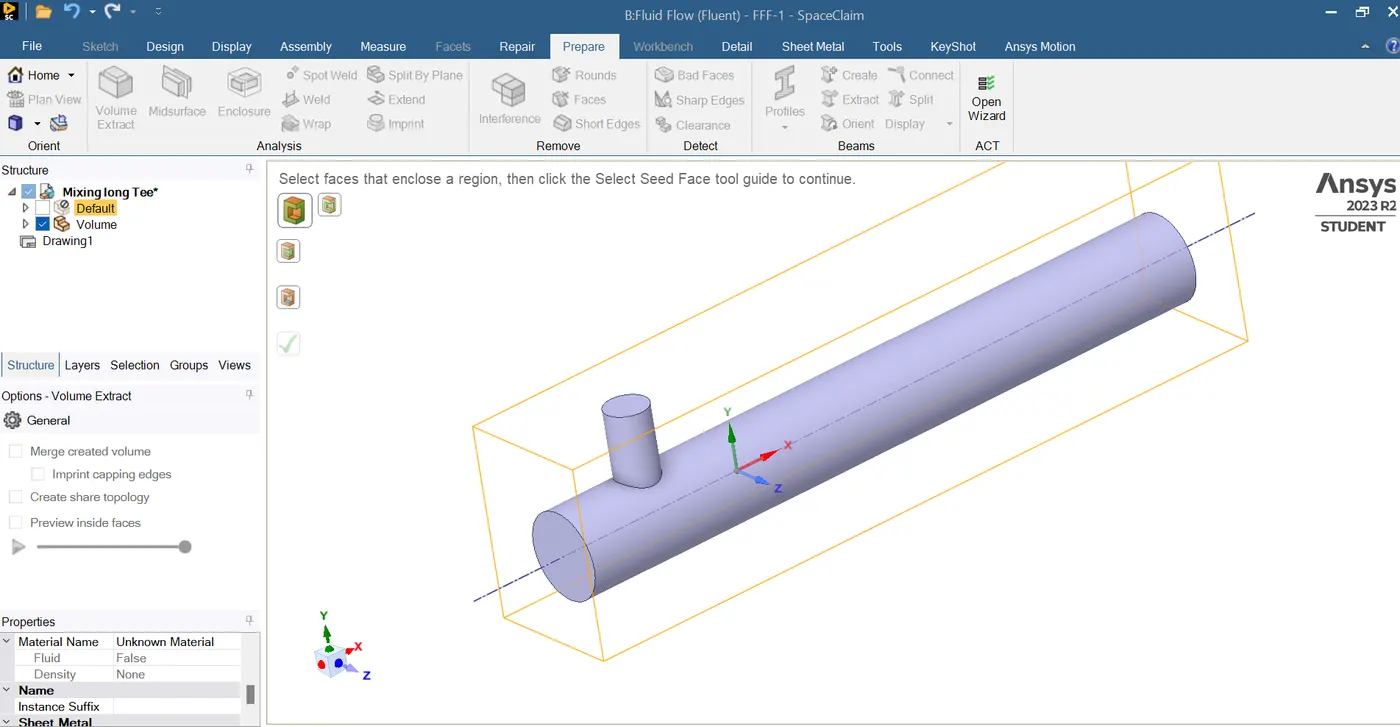
>>We have to go inside Mesh option. We have to give the element size is 0.1. After that we have to go inside mesh option then we have to click on generate mesh. After i completed meshing then I got to total element count is 15616. We have to right click on face inside the solid model then we have to click on Create Named Selection . Then we have to give the name like Inlet-X( X Axis), Inlet-Y( Y Axis), Outlets and Walls .Once we did named selection then close the mesh.
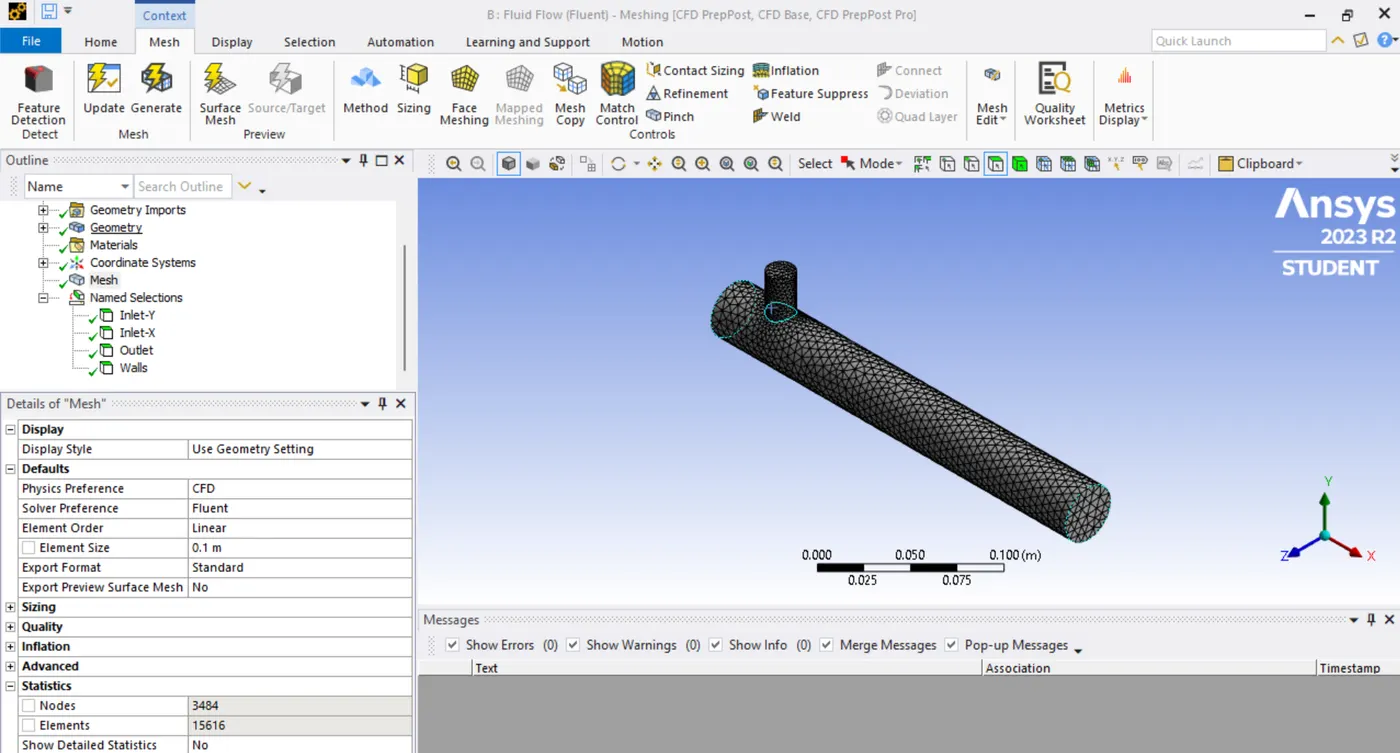
>>Case-2 (a) Short mixing tee with a hot inlet velocity of 3m/s. (b) Momentum ratio is 2 :-
K-Epsilon:-
>>We have to go inside setup .Then we have to check the mesh inside console If it is showing Our meshing display .....done then we have to go next step. We have to click on Units and go to temperature then change it kelvin to celsius.After we have to click on energy in Physics option . Then click on Viscous(Turbulence) and select K-Epsilon .we have to go inside material , we have put air inside the material type then save and close it. After we have to go inside Cell zones , in cell zone also we can the material type . Then select Boundaries, Inside boundaries we have 4 type of faces which is Inlet-X, Inlet-Y, Outlet and Walls . Then we have to put hot inlet velocity of 3m/s and temperature is 360C inside the Inlet-X. we have take 2 then we have to equal both hot inlet and momentum ratio is 2 then we will got first inlet velocity at cold inlet which is 6m/s and temperature is 190C. Then inside outlet Gauge Pressure should be zero and inside walls no need to change its automatically taken. we have to go inside Definitions ,we have to select Area-weighted Average and Standard Deviations then it will as two report page .From this report page we will got how much output coming inside the outlet. After we have to go inside the Initialization,then We have to select on hybrid , click on initialize .Once intialize is done it shown like,
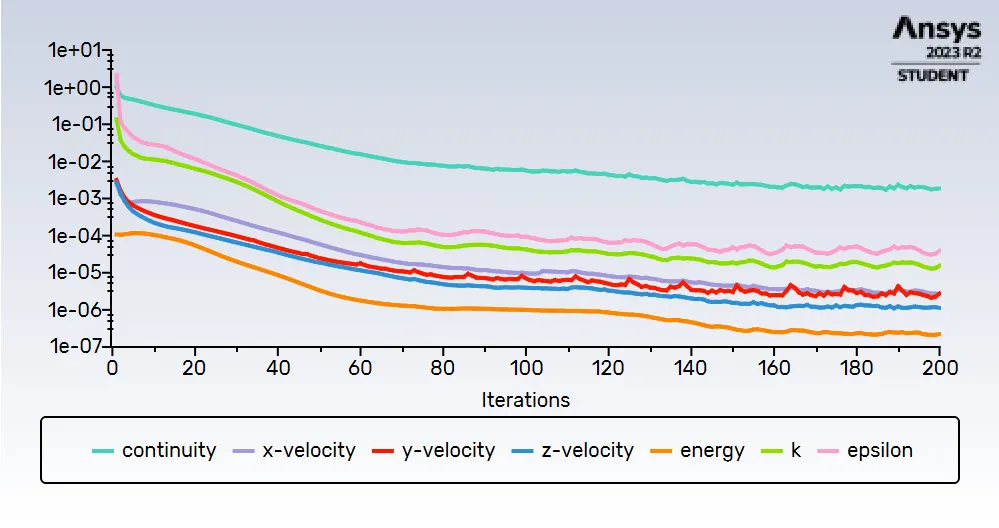
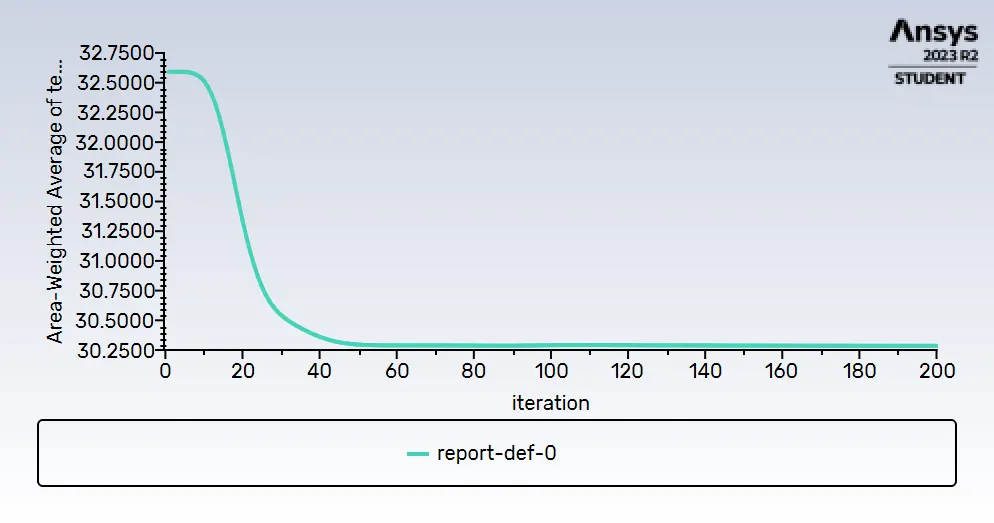
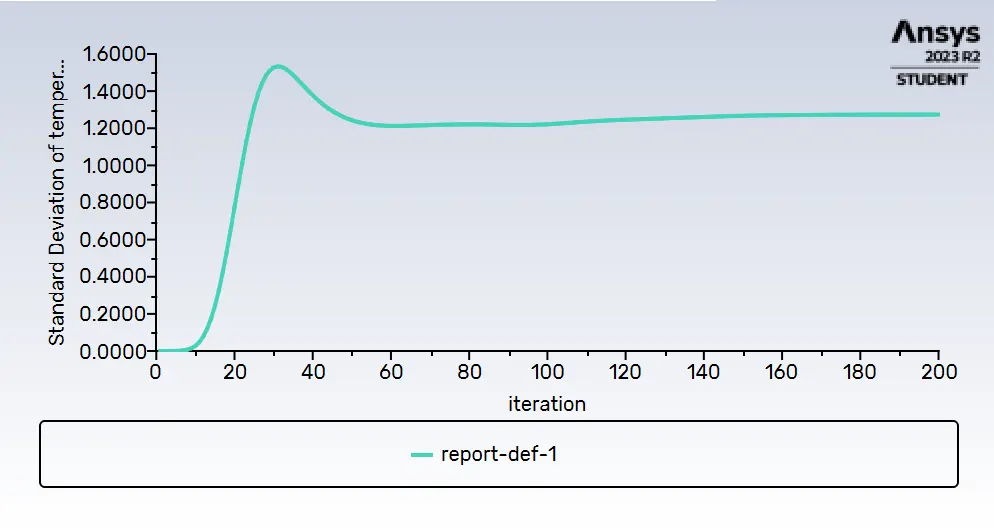
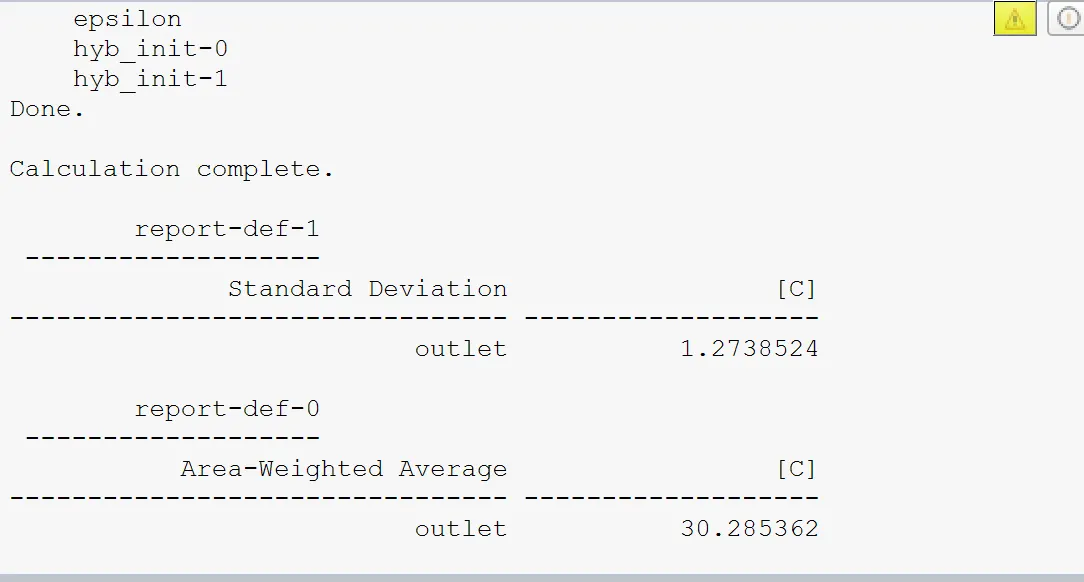
>> Then we have to compute the Area-weighted Average and Standard Deviations in Report Definitions. we got output temperature is 30.285362 .It shown below as
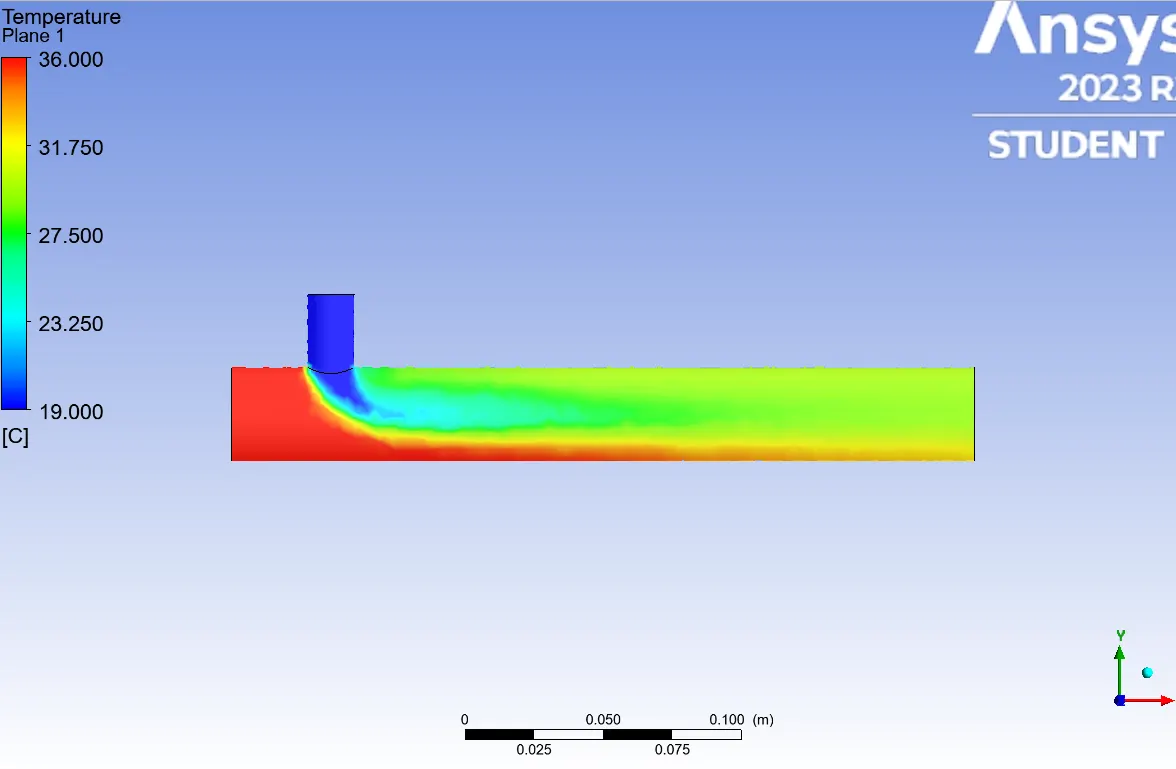
>> We have to double click on result , once we entered inside results then we have to hide the Inlet-X, Inlet-y and Outlets. We have work on Walls then click on walls , change the colour to white and for batter visiblity inside the wall we will make it as a transparency by given the value of transparent. Then we have to go inside Insert,click on Location then add a XY-plane inside the mixing tee . We have to go inside the XY-plane and click on colour then change to variable after that we have to put temperature inside the variable then apply it.Then we have to go inside Default legend view and in precision we have the format type then we will change Scientific to Fixed format.It shown like,
K-OMEGA:-
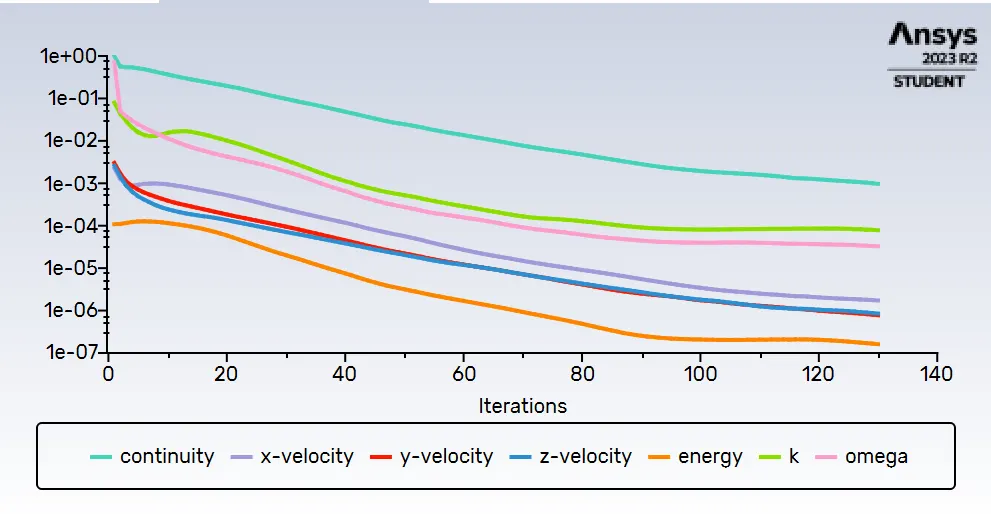
>> Again we have to go inside the Viscous(Turbulence) , Inside this we have select on K-omega and also we have to select SST. Then we have to Click on initialization.Once intialize is done then we have click on run calculation , after we have give the number of iteration is 200 and click on calulate.It show like,
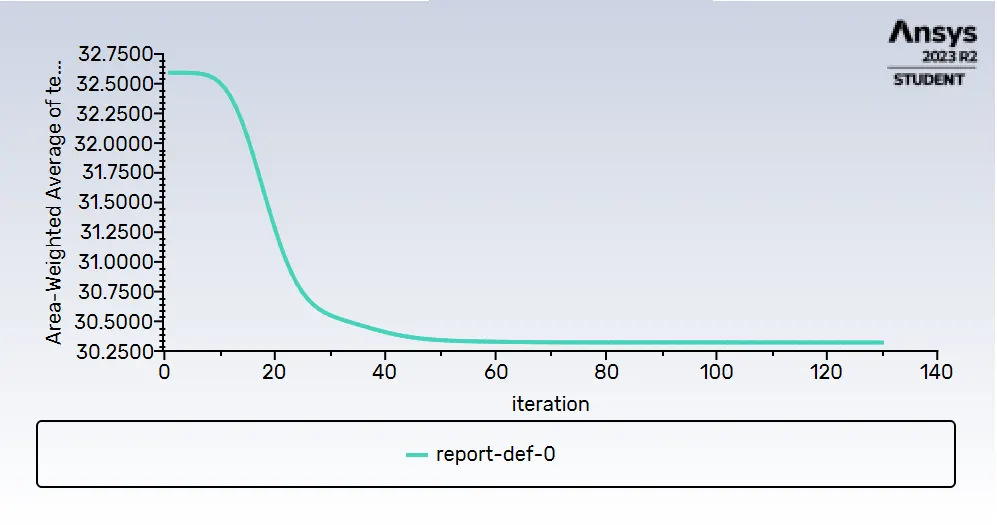
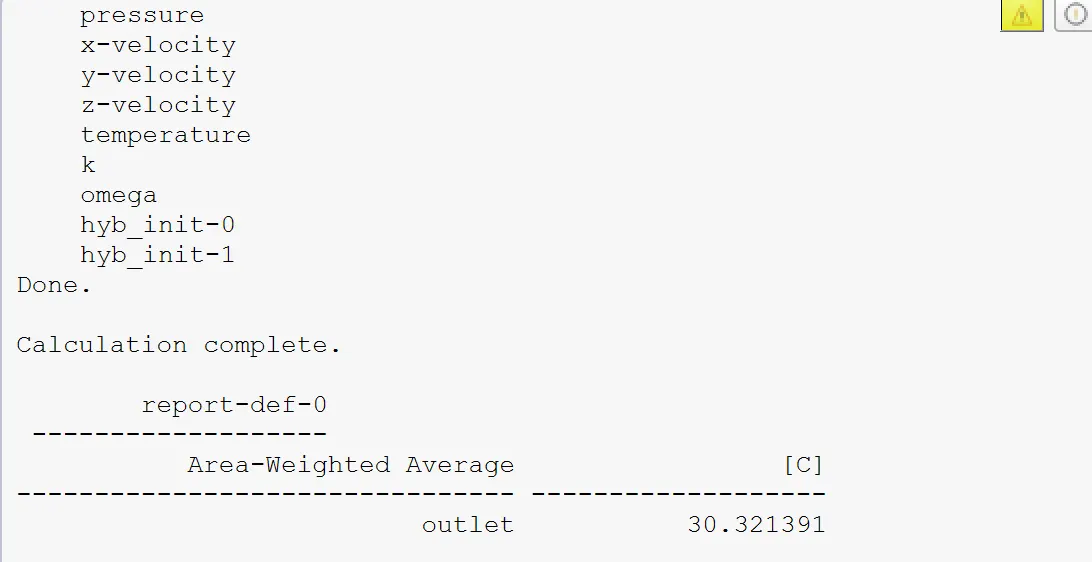
>> Then we have to compute the Area-weighted Average and Standard Deviations in Report Definitions. we got output temperature is 30.321391 .It shown below as
>>Same procedure we have to apply on results,then it showing like this,
COMPARISON BOTH K-EPSILON AND K-OMEGA :-
>> we are use k-epsilon then we got output temperature is 30.285362 .Again we are using k-omega then we will got output temperature is 30.321391. If we are compair both of this we got good result in k-epsilon and k-omege is not given that much good result . But both are having little bit difference.
(b) Momentum ratio is 4 :-
K-EPSILON:-
>>Again we have go inside Setup .Then we have to select the Viscous(Turbulence) and select the K-Epsilon.After select Boundaries, Inside boundaries we have 4 type of faces which is Inlet-X, Inlet-Y, Outlet and Walls . Then we have to put hot inlet velocity of 3m/s and temperature is 360C inside the Inlet-X. we have to equal both hot inlet and momentum ratio is 4 then we will got first inlet velocity at cold inlet which is 12m/s and temperature is 190C. Then inside outlet Gauge Pressure should be zero and inside walls no need to change its automatically taken. we have to go inside Definitions ,we have to select Area-weighted Average and Standard Deviations then it will as two report page .From this report page we will got how much output coming inside the outlet. After we have to go inside the Initialization,then We have to select on hybrid , click on initialize .Once intialize is done it shown like,
>> After we have to go inside Run Calculation, then we have to put number of itration is 200 and click on calculate. Once this itration is completed then we will result inside the repot page and it shown like,
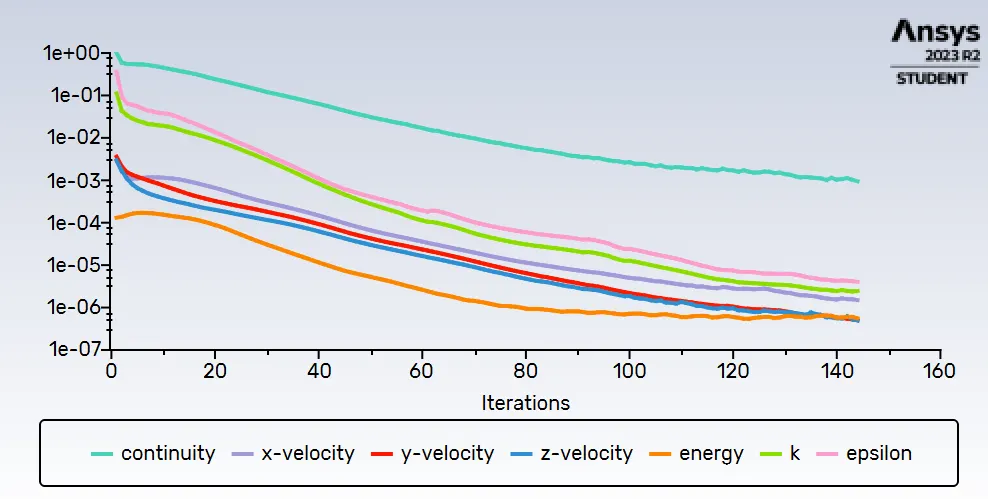
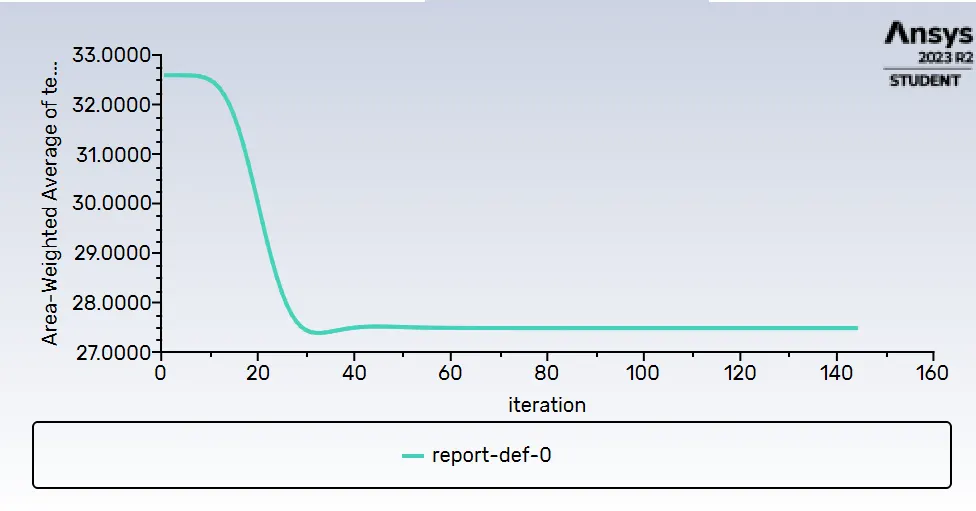
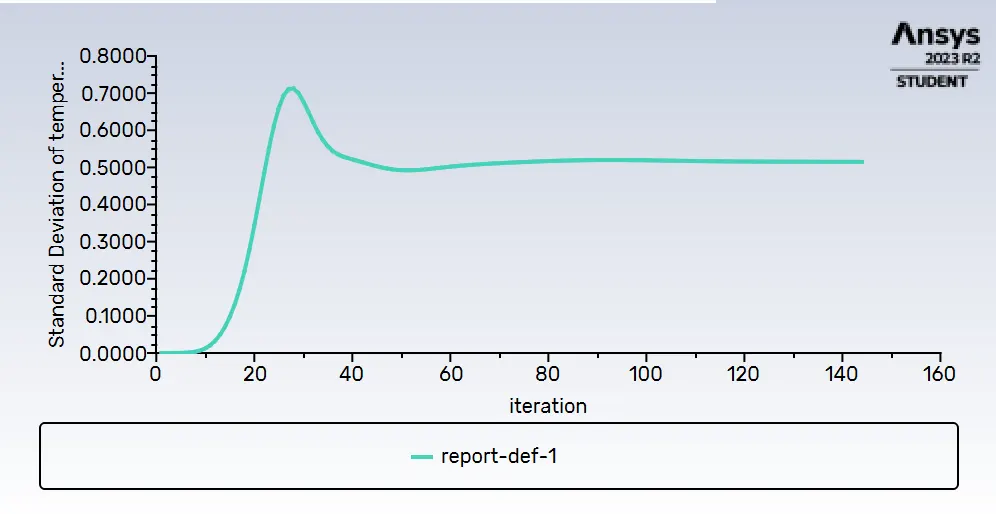
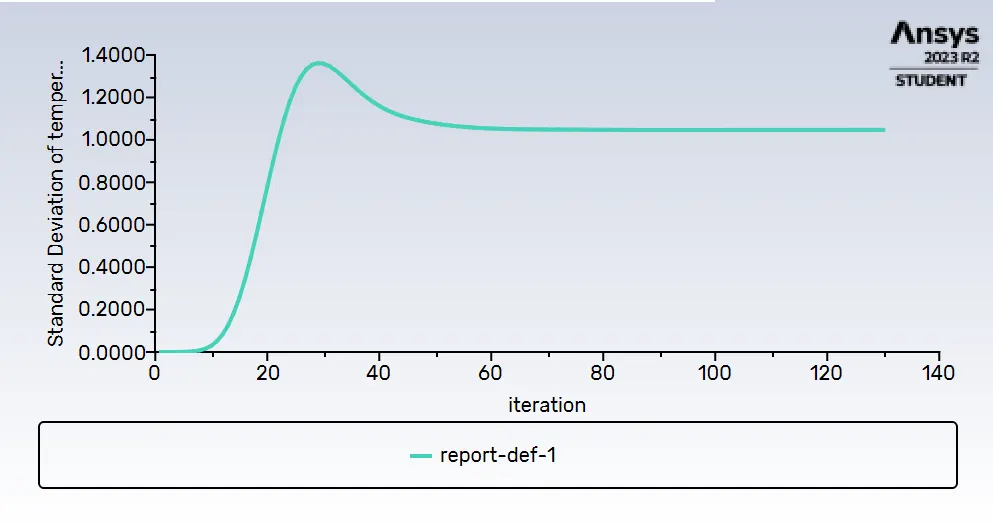
>> Then we have to compute the Area-weighted Average and Standard Deviations in Report Definitions. we got output temperature is 27.482862 inside the cansole .It shown below as
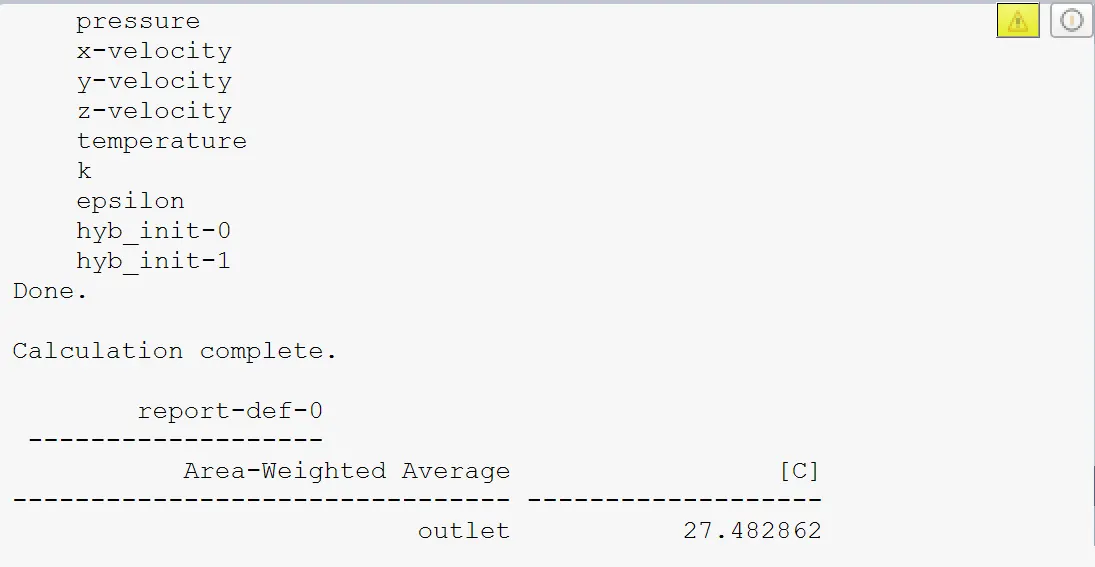
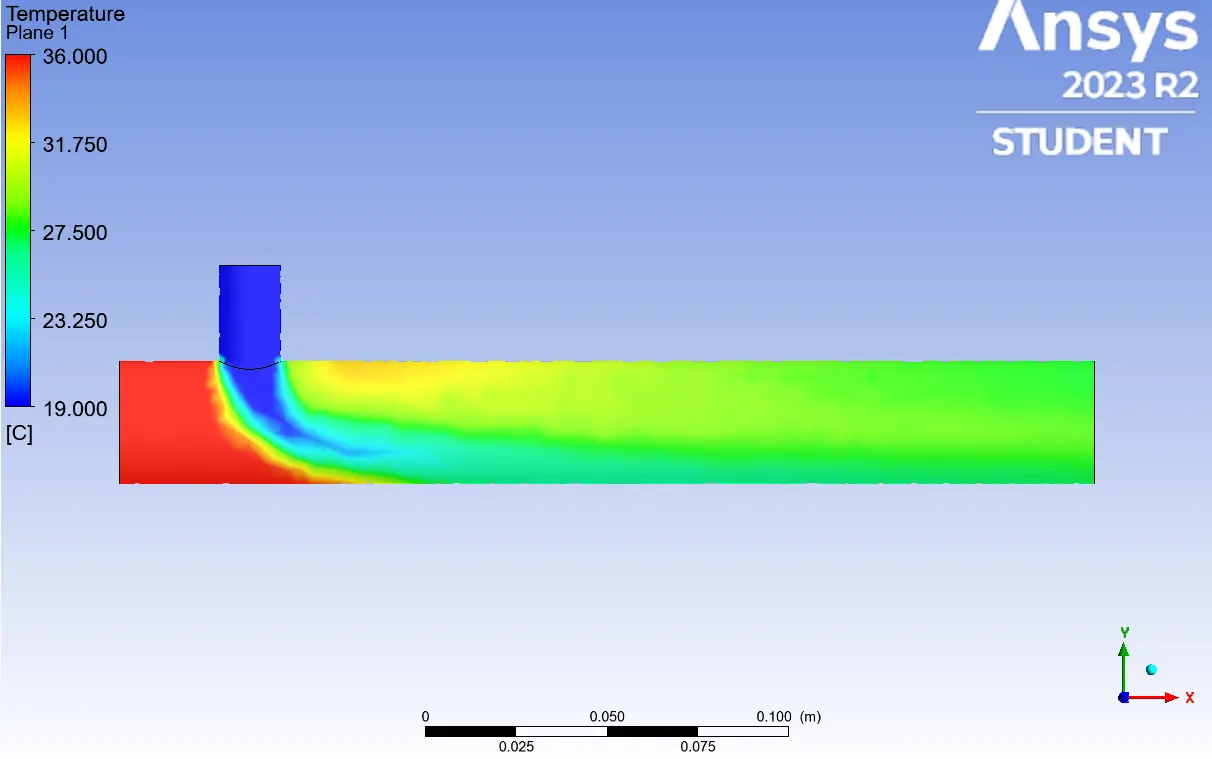
>> We have to double click on result , once we entered inside results then we have to hide the Inlet-X, Inlet-y and Outlets. We have work on Walls then click on walls , change the colour to white and for batter visiblity inside the wall we will make it as a transparency by given the value of transparent. Then we have to go inside Insert,click on Location then add a XY-plane inside the mixing tee . We have to go inside the XY-plane and click on colour then change to variable after that we have to put temperature inside the variable then apply it.Then we have to go inside Default legend view and in precision we have the format type then we will change Scientific to Fixed format.It shown like,
K-OMEGA:-
>> Again we have to go inside the Viscous(Turbulence) , Inside this we have select on K-omega and also we have to select SST. Then we have to Click on initialization.Once intialize is done then we have click on run calculation , after we have give the number of iteration is 200 and click on calulate.It show like,
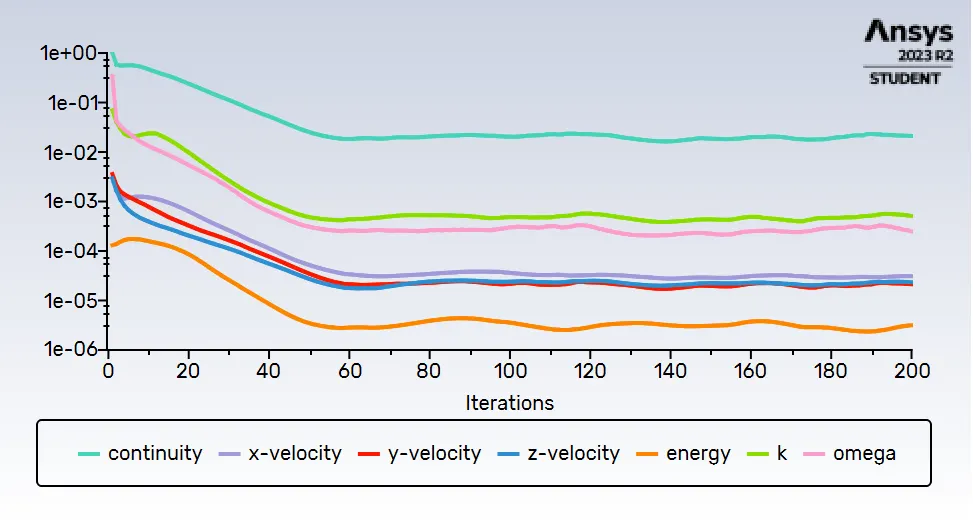
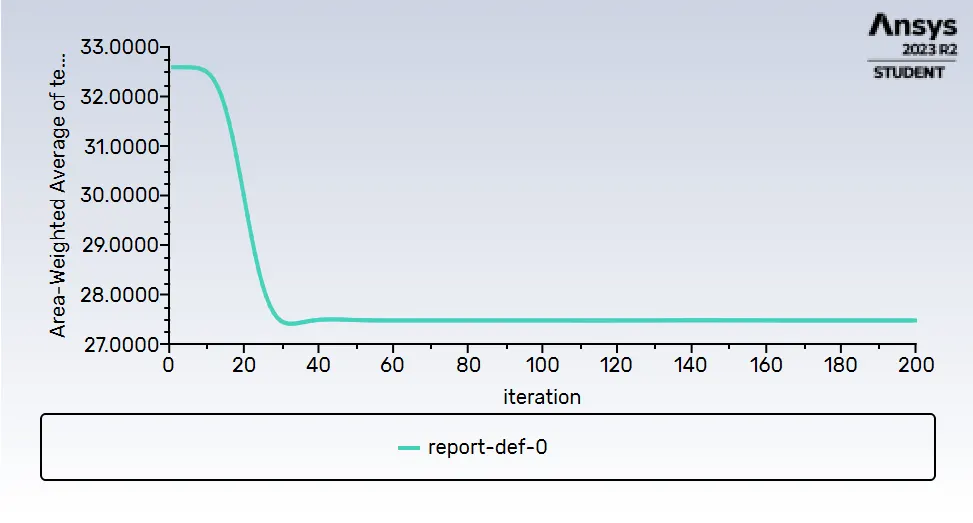
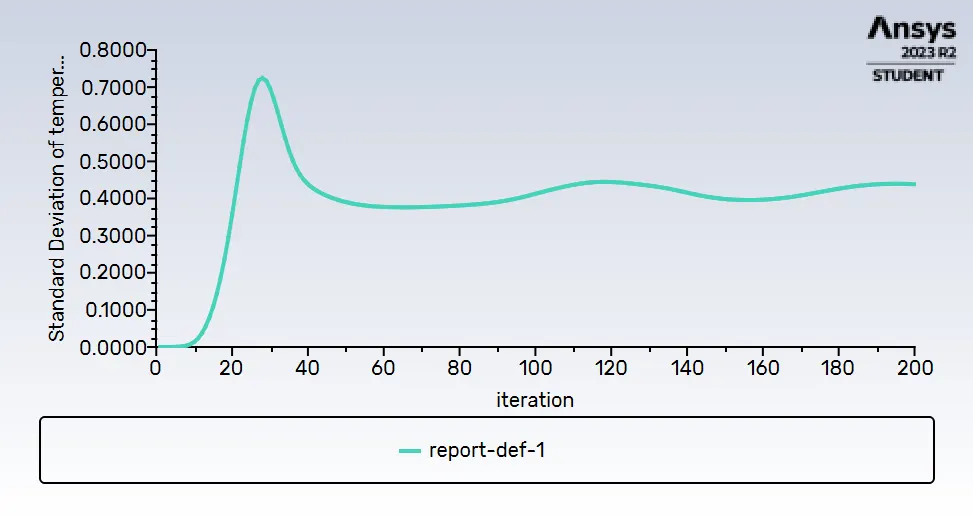
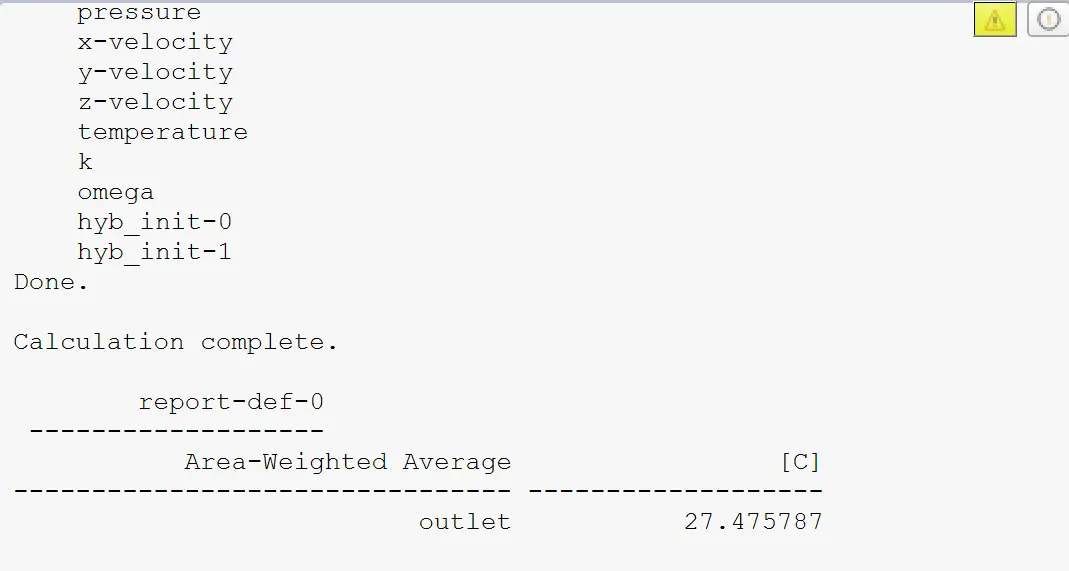
>> we have to compute the Area-weighted Average and Standard Deviations in Report Definitions. we got output temperature is 27.475787 .It shown below as
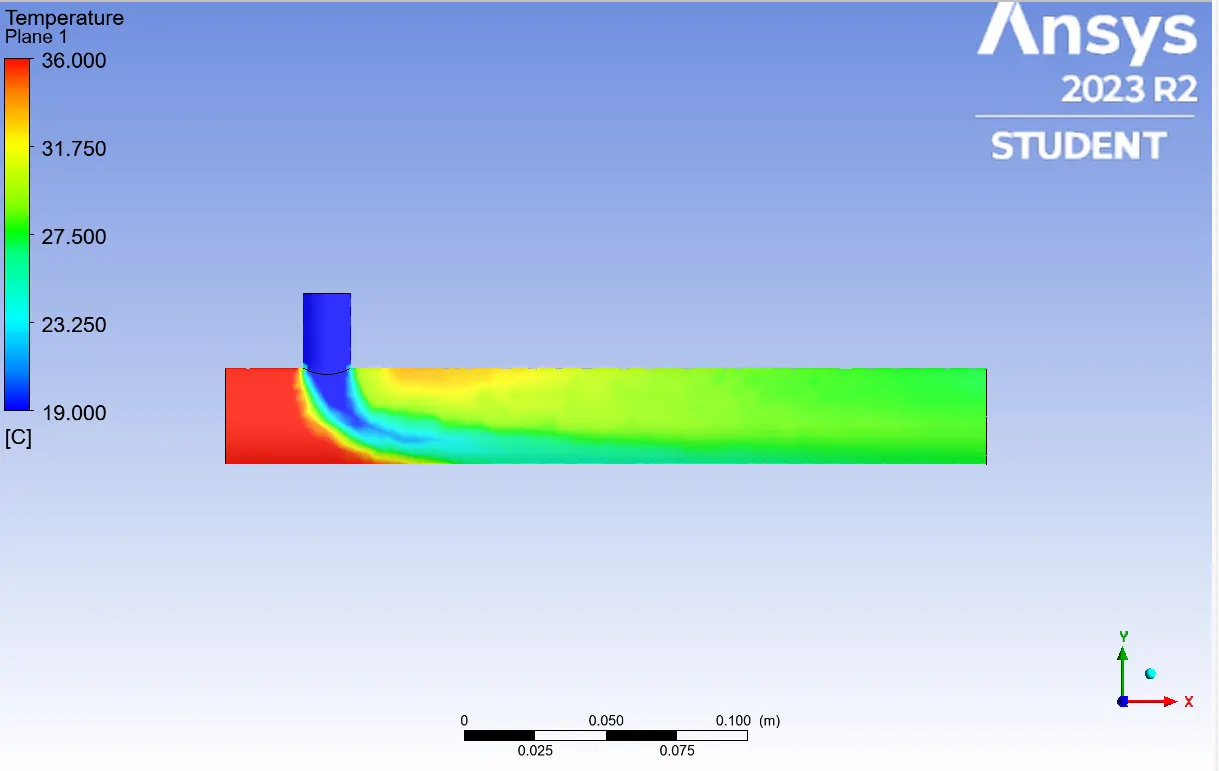
>>Same procedure we have to apply on results,then it showing like this,
COMPARISON BOTH K-EPSILON AND K-OMEGA :-
>> we are use k-epsilon then we got output temperature is 27.482862 .Again we are using k-omega then we will got output temperature is 27.475787. If we are compair both of this we got good result . But both are having little bit difference.
(1) Velocity and temperature contour plots on the cut planes along and across the pipe :-
(a) Short Mixing Tee
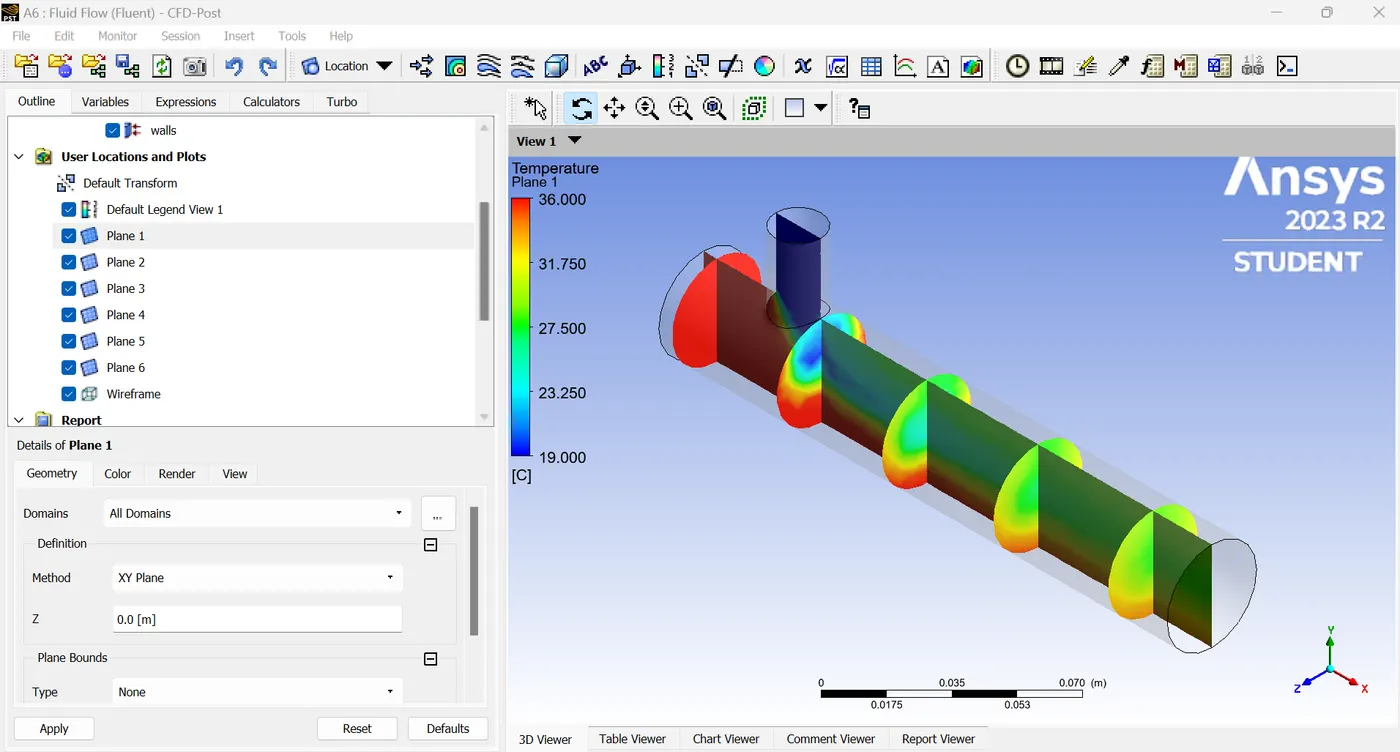
>>Temperature(momentum ratio of 2):
> We have to go inside the results then we have to create the cut planes along, it means XY plane.Then select the Insert , Inside having plane then click on plane and creat the XY plane . After created XY plane then we have to Outline , Inside outline having plane option and select on plane then click on colour and change the mode from Constant to Variable ,Inside variable we have to change to Temperature then click on apply .After that we got contour plot inside the Result. >We have to create the cut planes across,It means YZ plane.we have to do with same procedure inside the result .After we will got across cut plane inside the result . Then we have to create Five YZ planes over the XY plane then only we will got Temprature contour plots on cut planes along and across the pipe. It seems like,
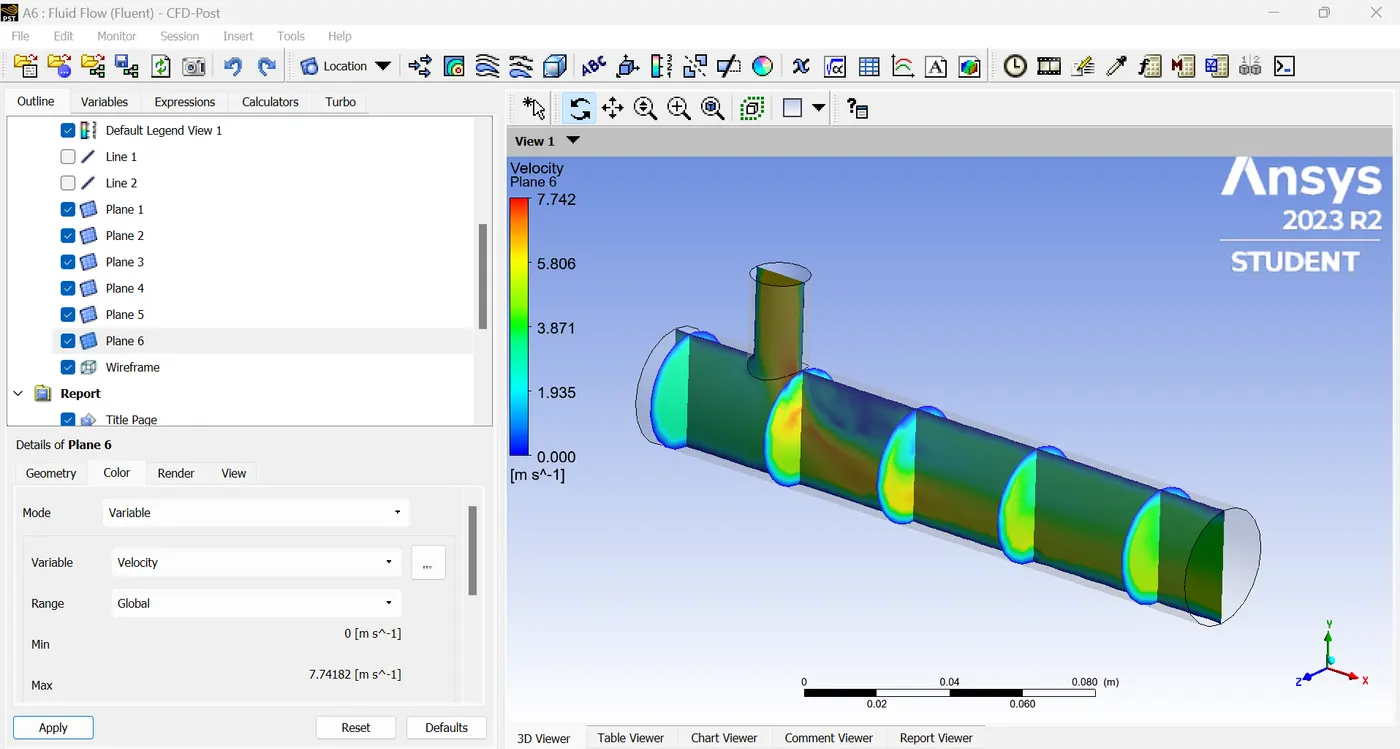
>>Velocity(momentum ratio of 2):
>select on plane then click on colour and change the mode from Constant to Variable ,Inside variable we have to change to Velocity then click on apply .After that we got contour plot inside the Result. It seems like,
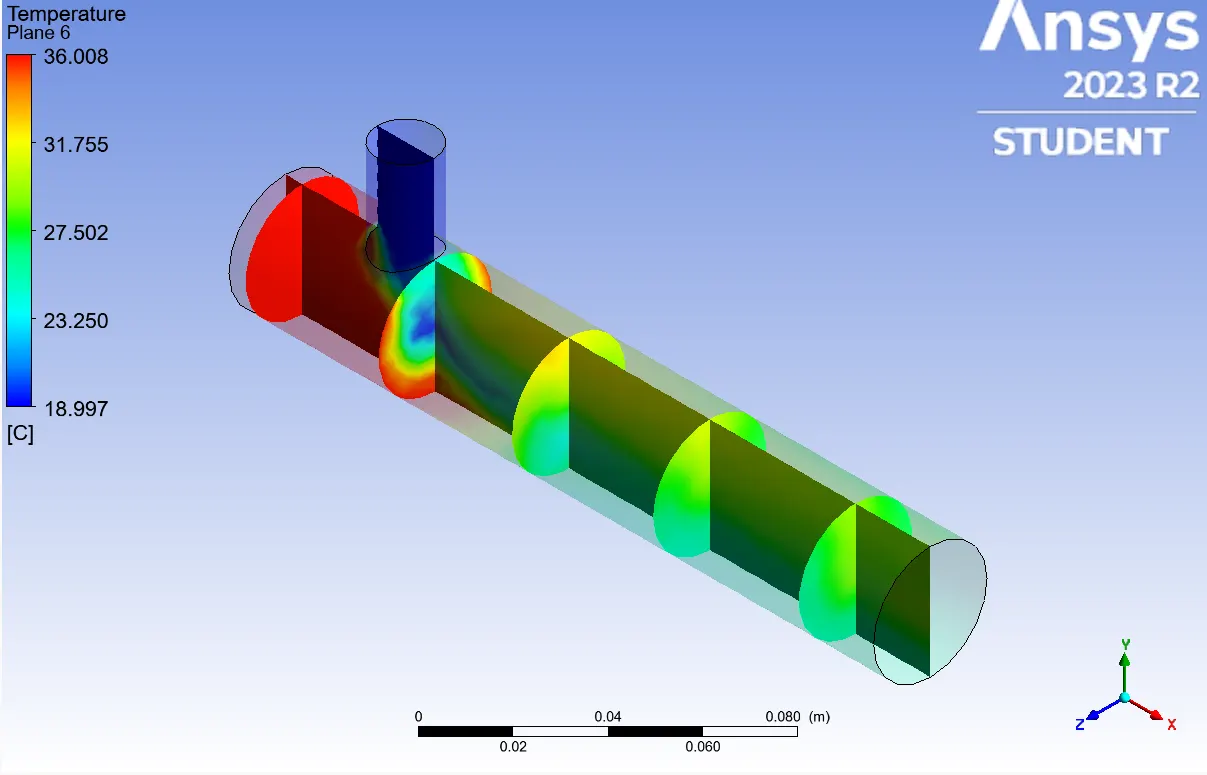
>>Temperature(momentum ratio of 4):
>We have to do same procedure inside the model . Then we will got contour plot like this,
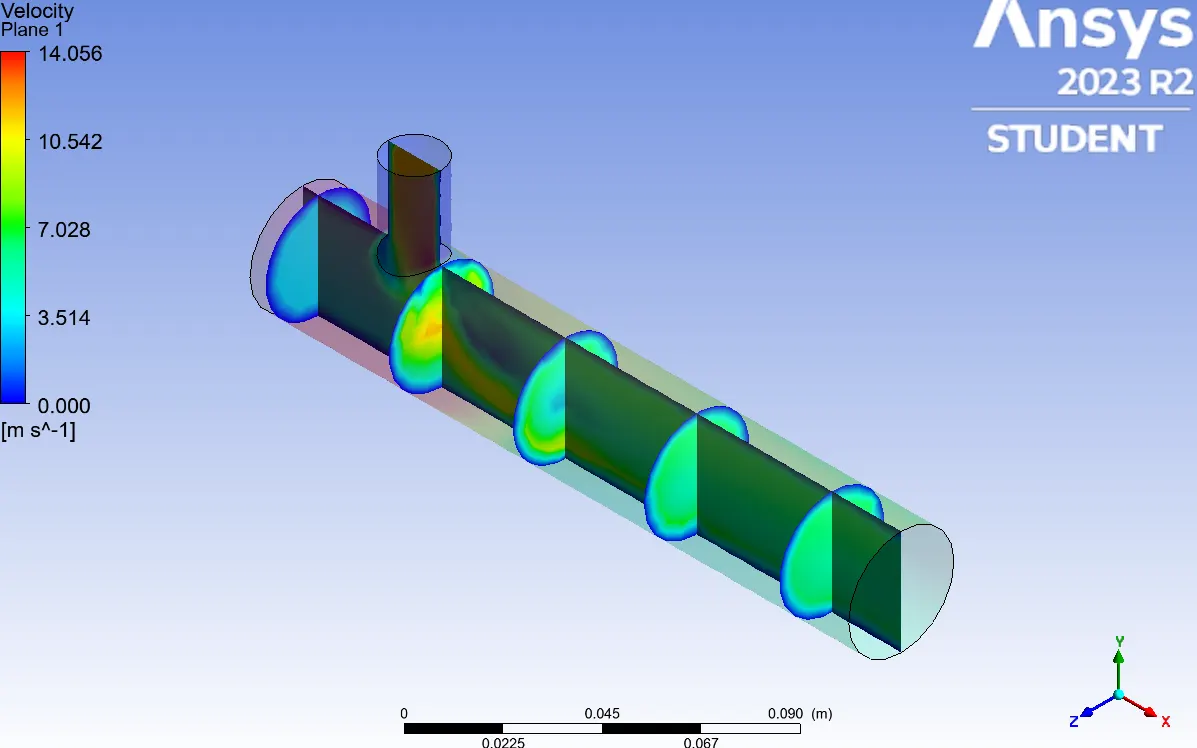
>>Velocity(momentum ratio of 4):
> We will got contour plots like this,
a) Long Mixing Tee
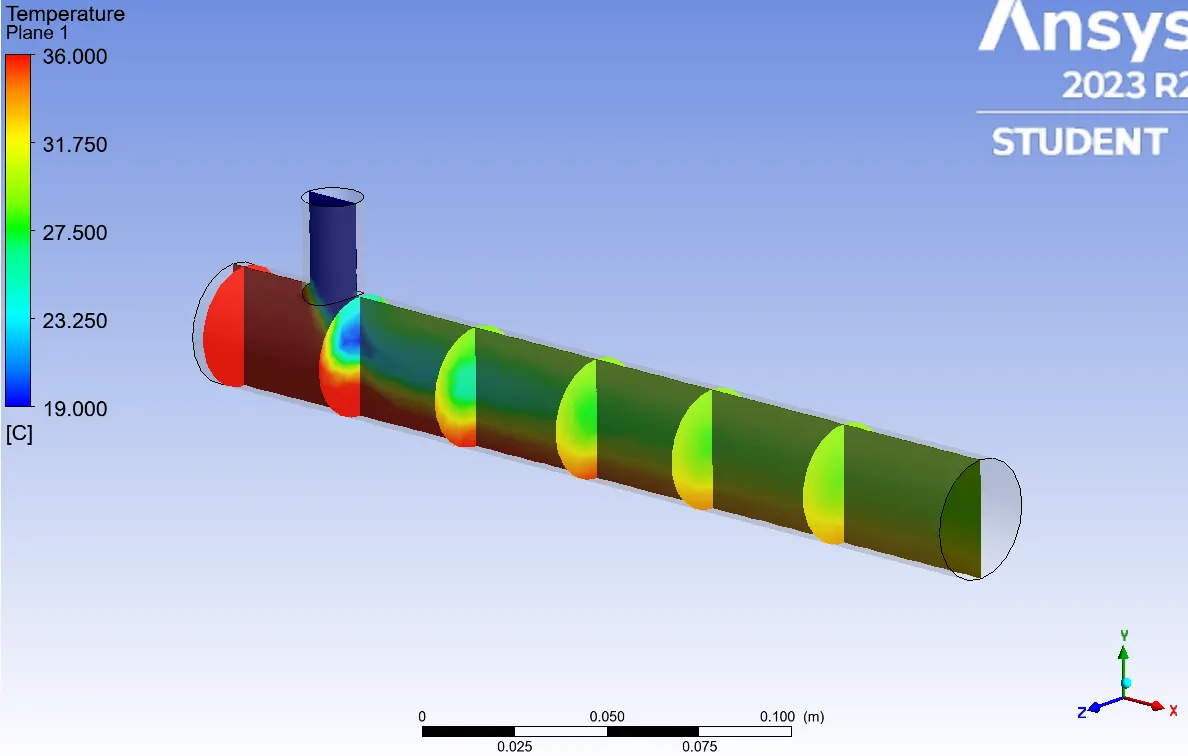
>>Temperature(momentum ratio of 2):
> We have to go inside the results then we have to create the cut planes along, it means XY plane.Then select the Insert , Inside having plane then click on plane and creat the XY plane . After created XY plane then we have to Outline , Inside outline having plane option and select on plane then click on colour and change the mode from Constant to Variable ,Inside variable we have to change to Temperature then click on apply .After that we got contour plot inside the Result. >We have to create the cut planes across,It means YZ plane.we have to do with same procedure inside the result .After we will got across cut plane inside the result . Then we have to create six YZ planes over the XY plane then only we will got Temprature contour plots on cut planes along and across the pipe. It seems like
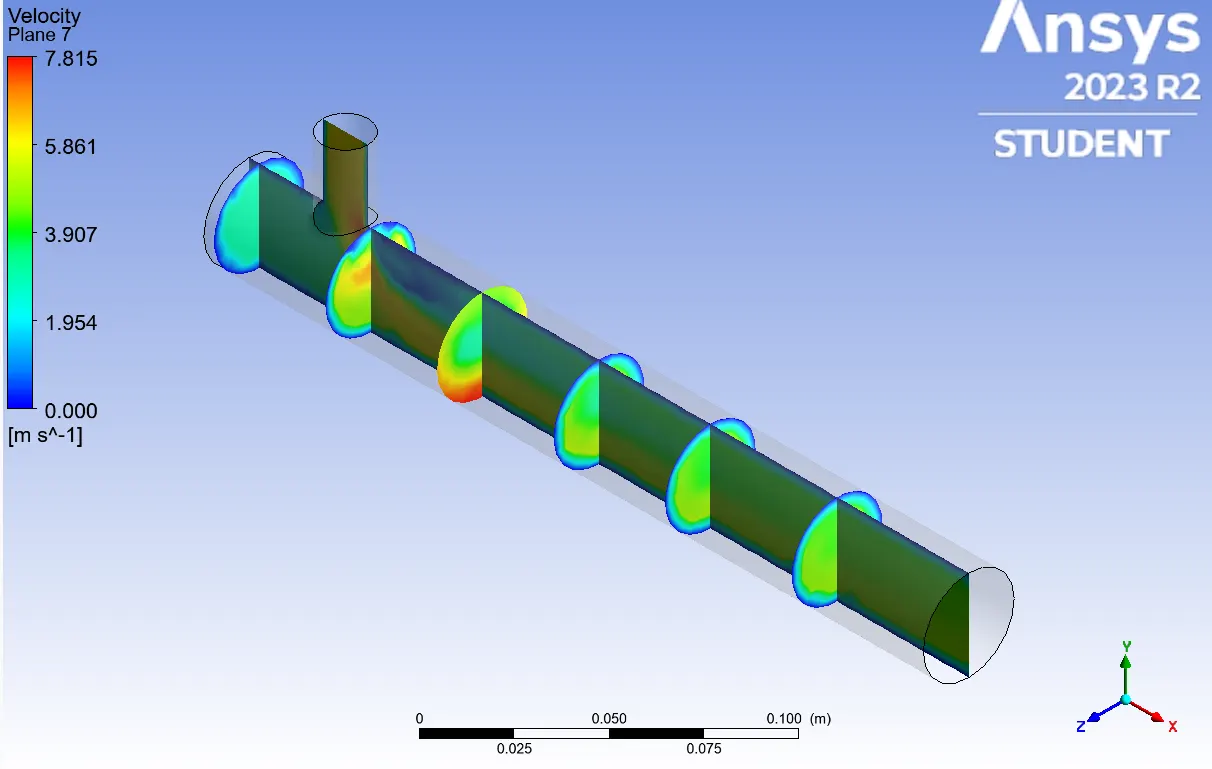
>>Velocity(momentum ratio of 2):
>select on plane then click on colour and change the mode from Constant to Variable ,Inside variable we have to change to Velocity then click on apply .After that we got contour plot inside the Result. It seems like,
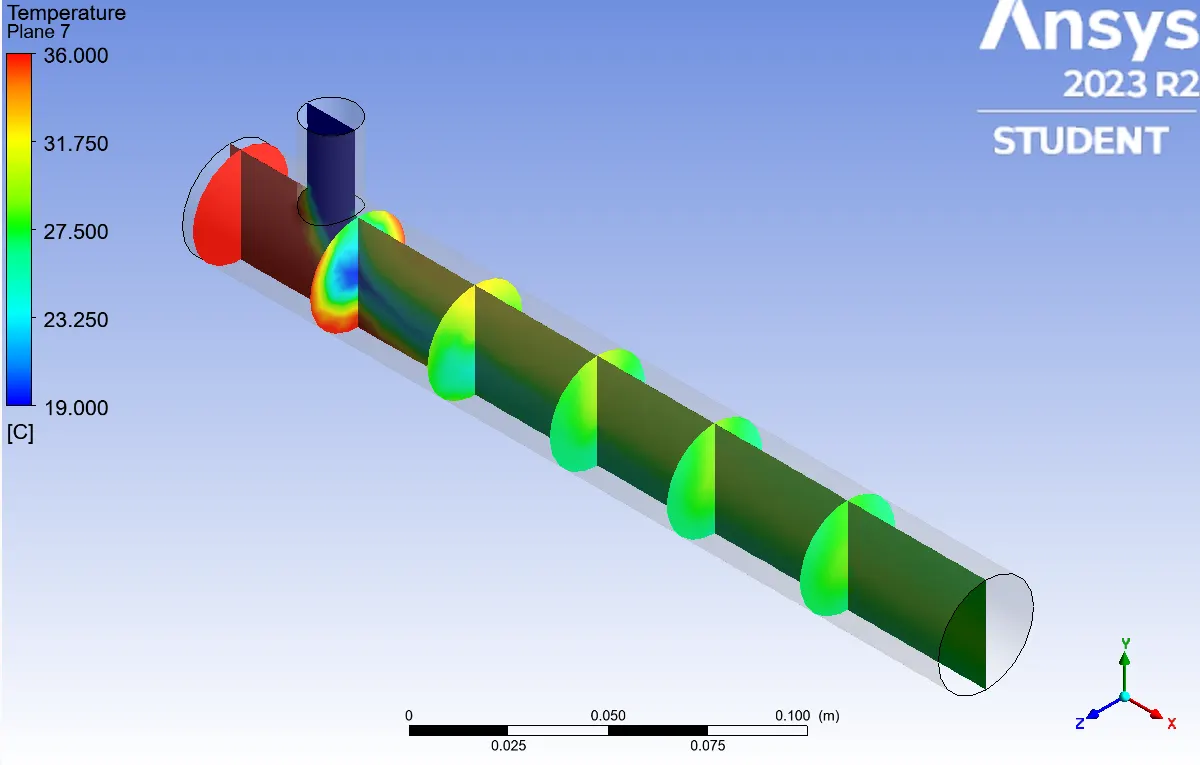
>>Temperature(momentum ratio of 4):
> We have to do same thing inside result.Then it look like,
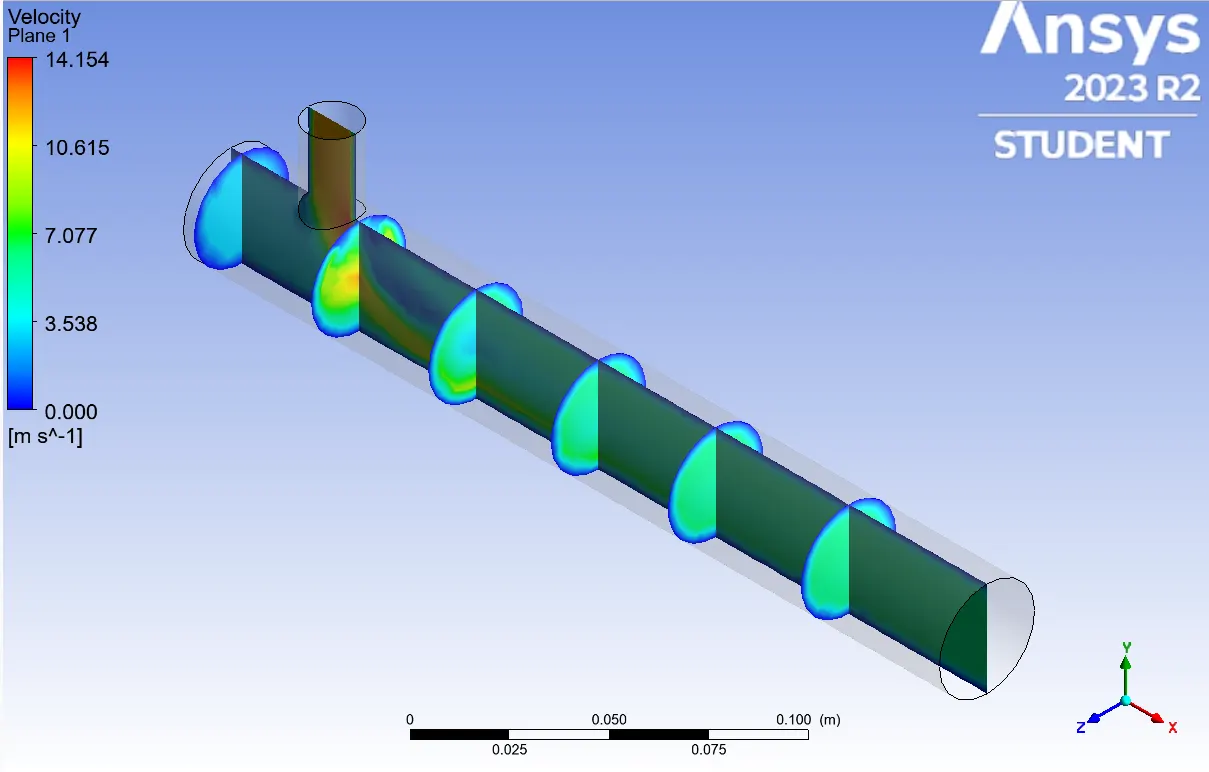
>>Velocity(momentum ratio of 4):
>select on plane then click on colour and change the mode from Constant to Variable ,Inside variable we have to change to Velocity then click on apply .After that we got contour plot inside the Result. It seems like,
2. Velocity and temperature line plots along and across the length of the pipe:-
Short Mixing Tee:
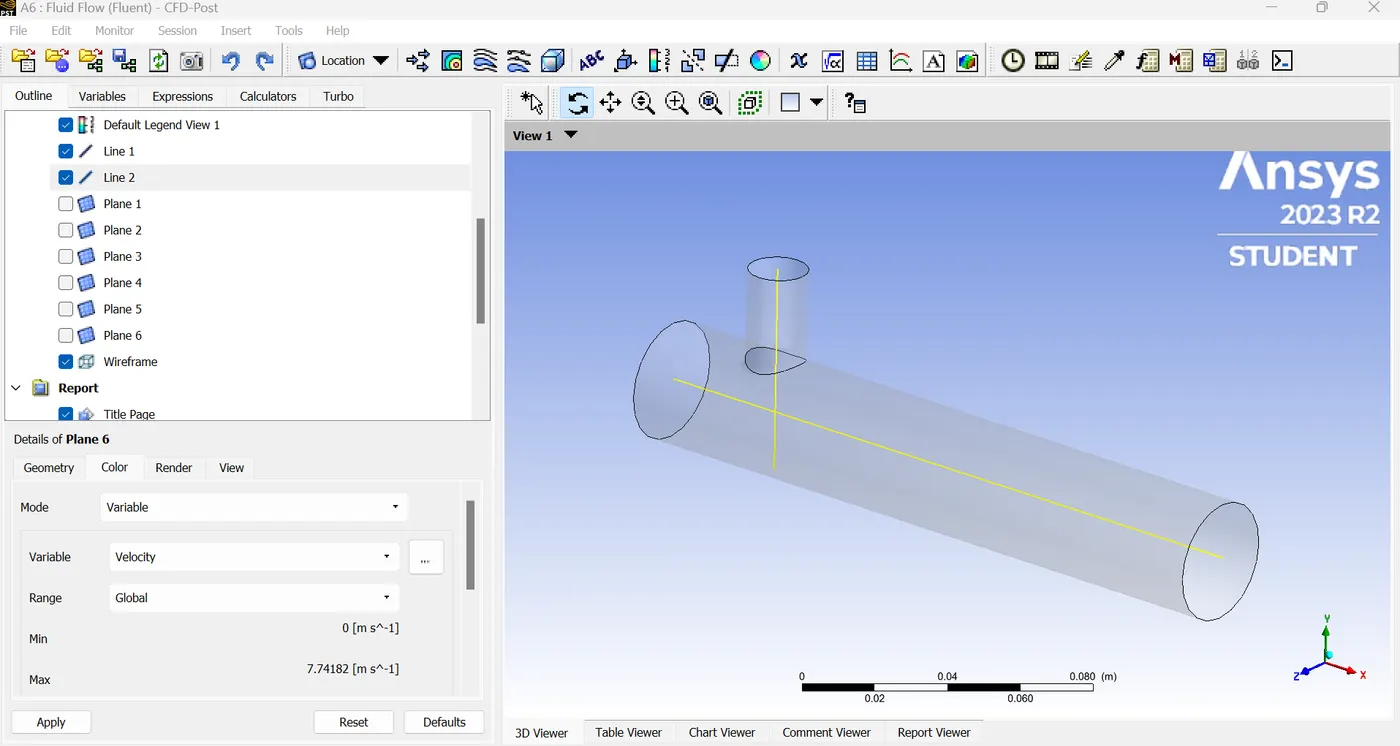
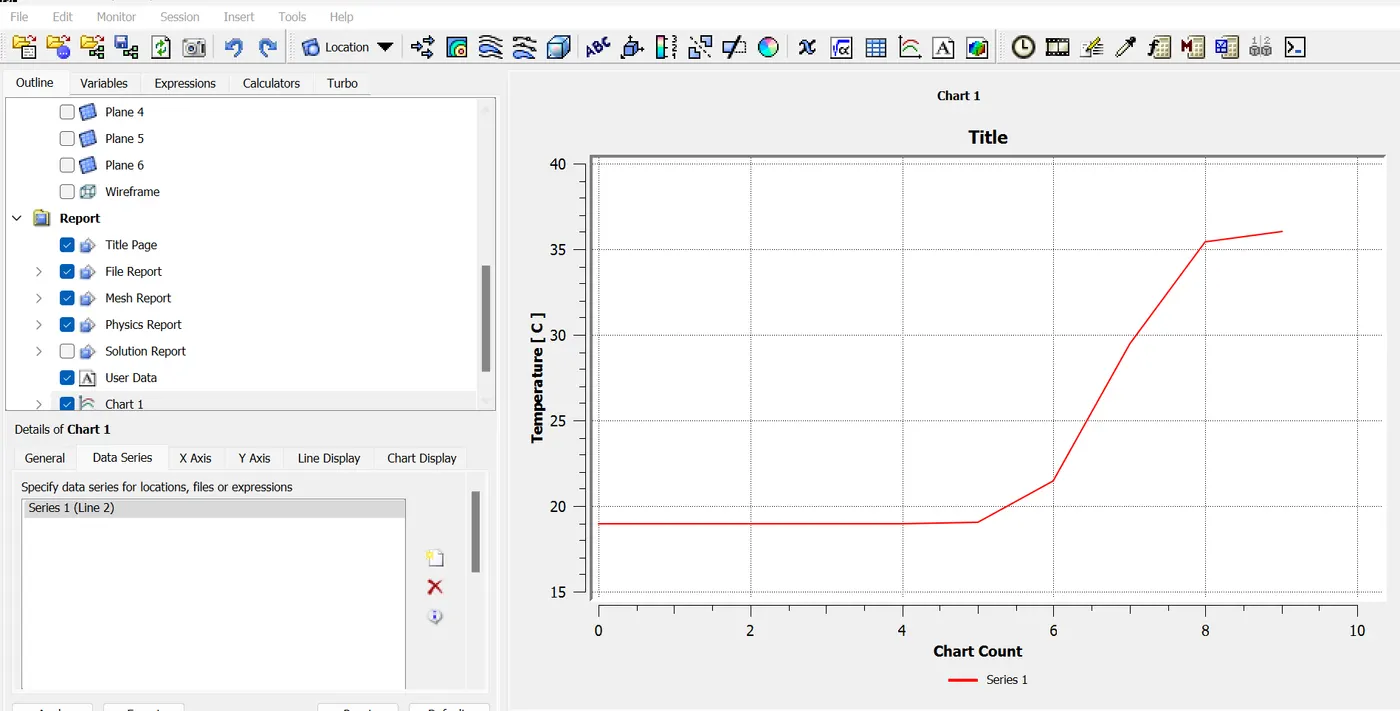
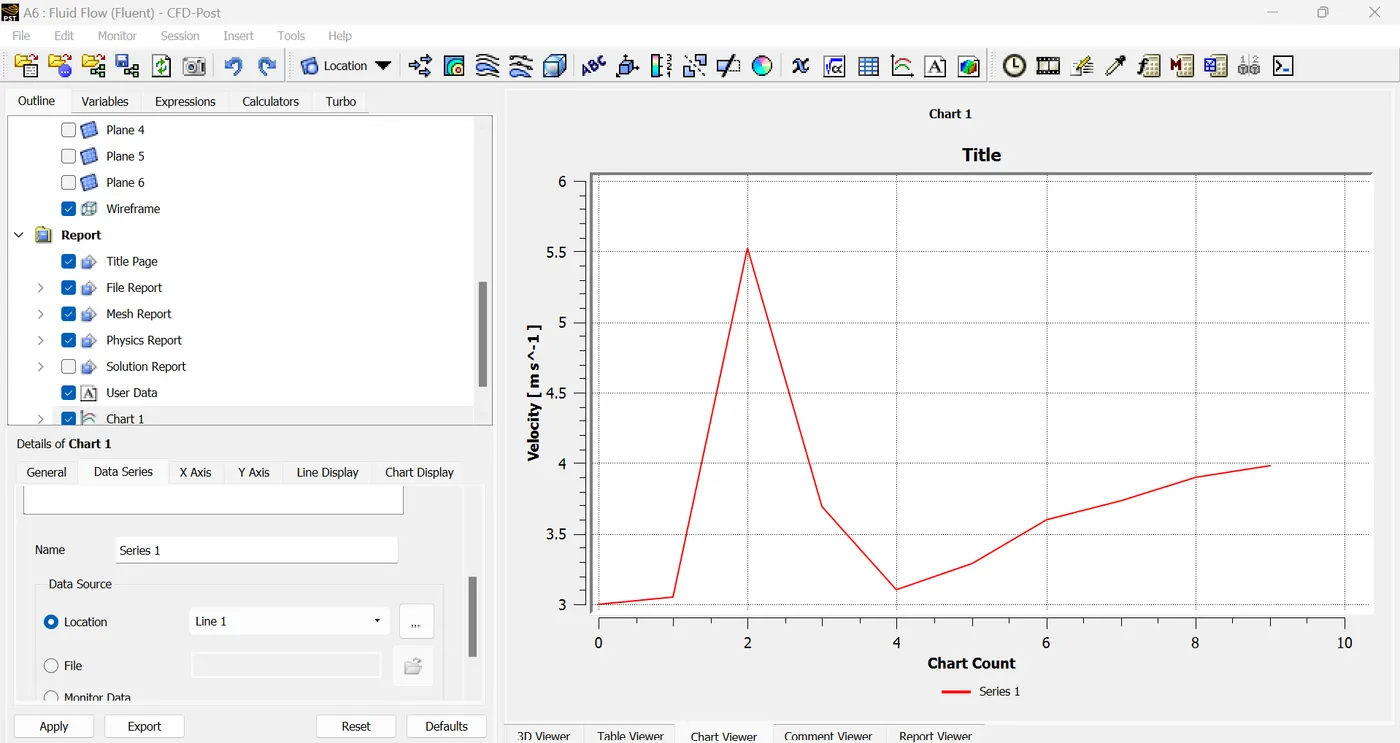
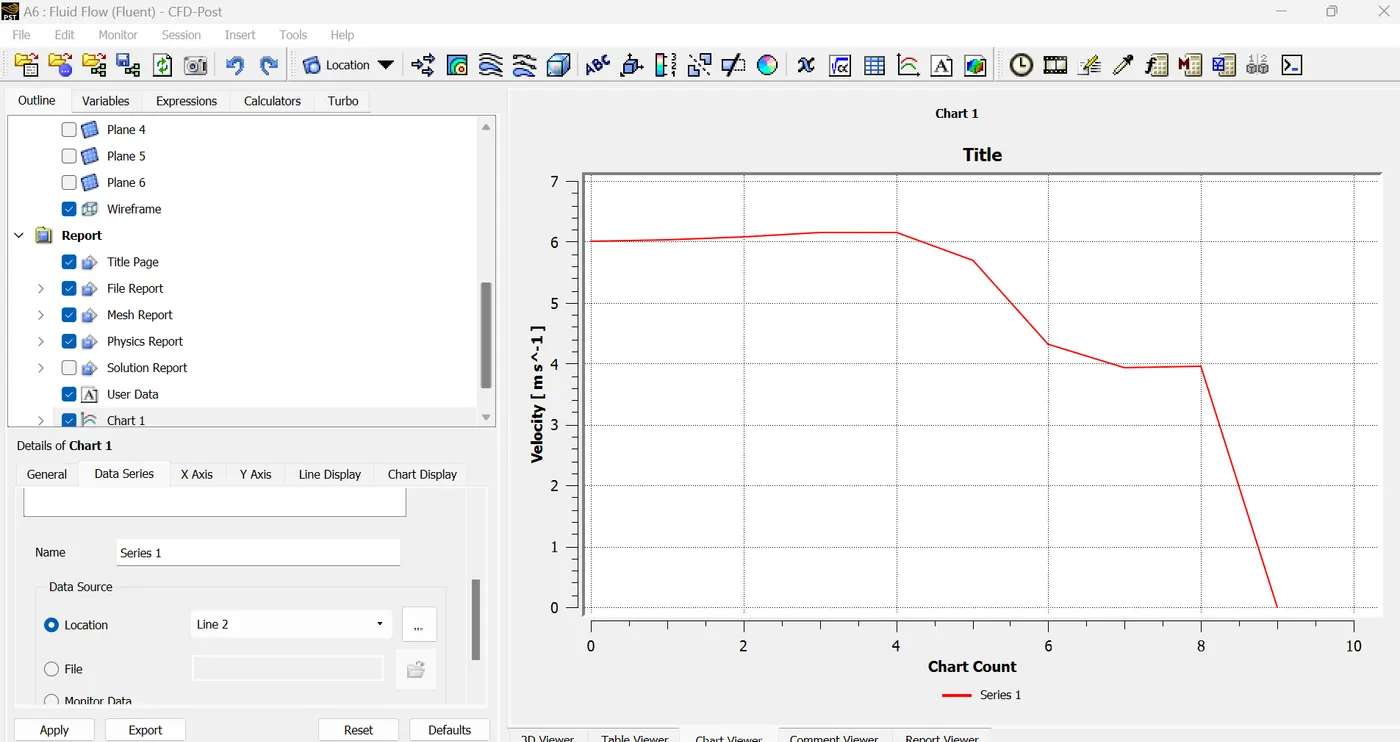
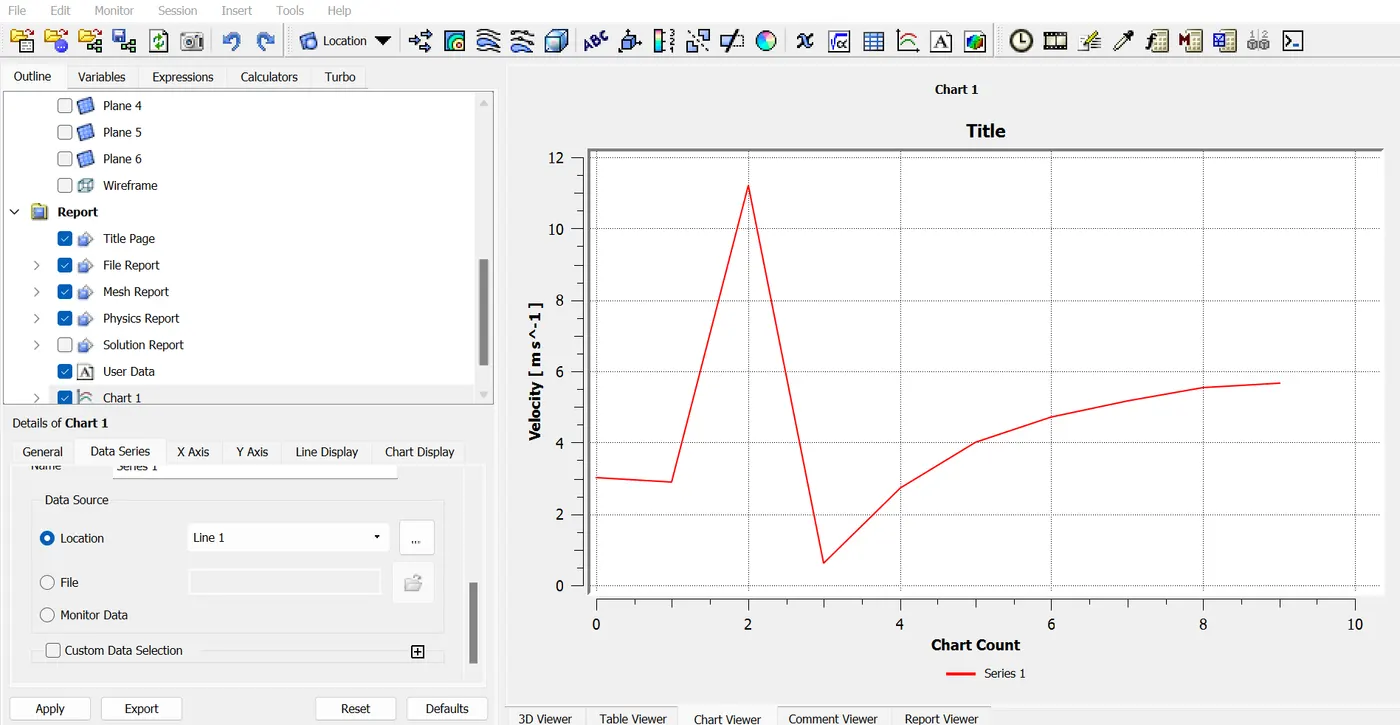
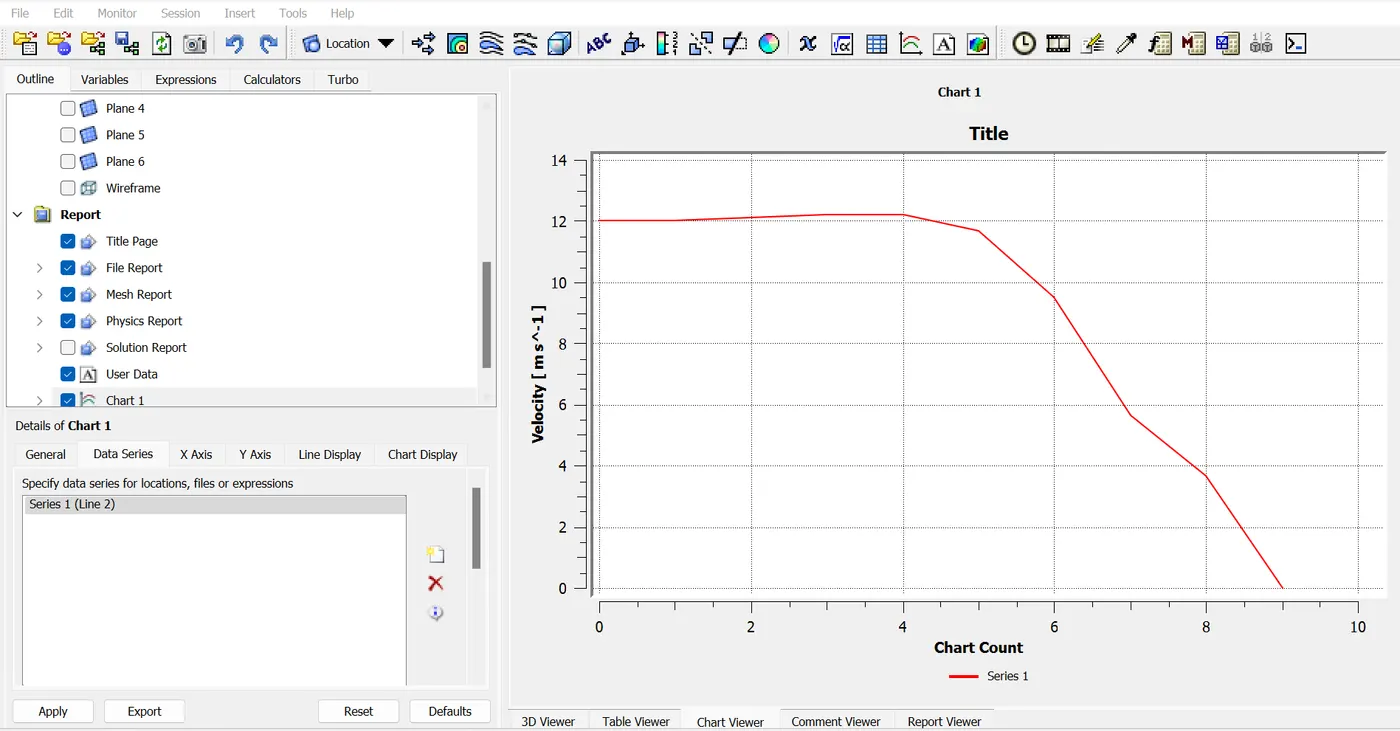
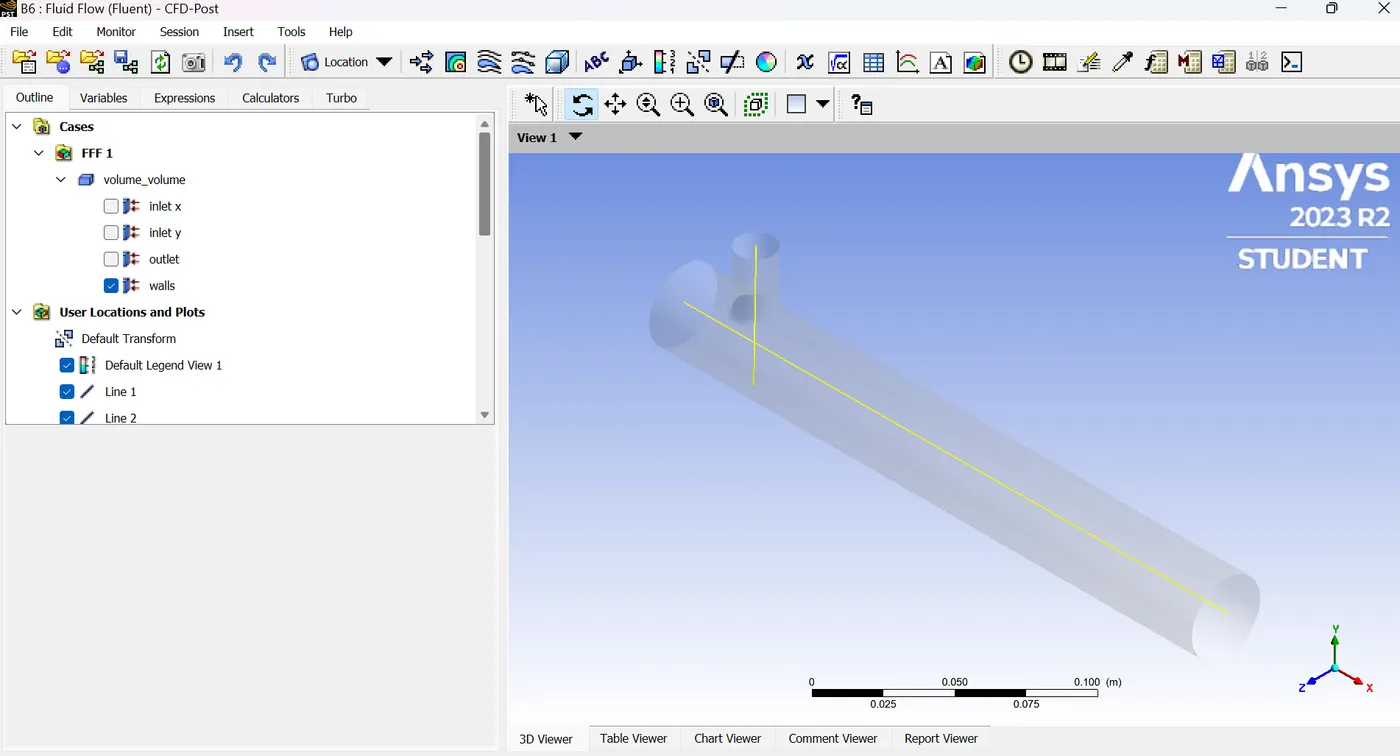
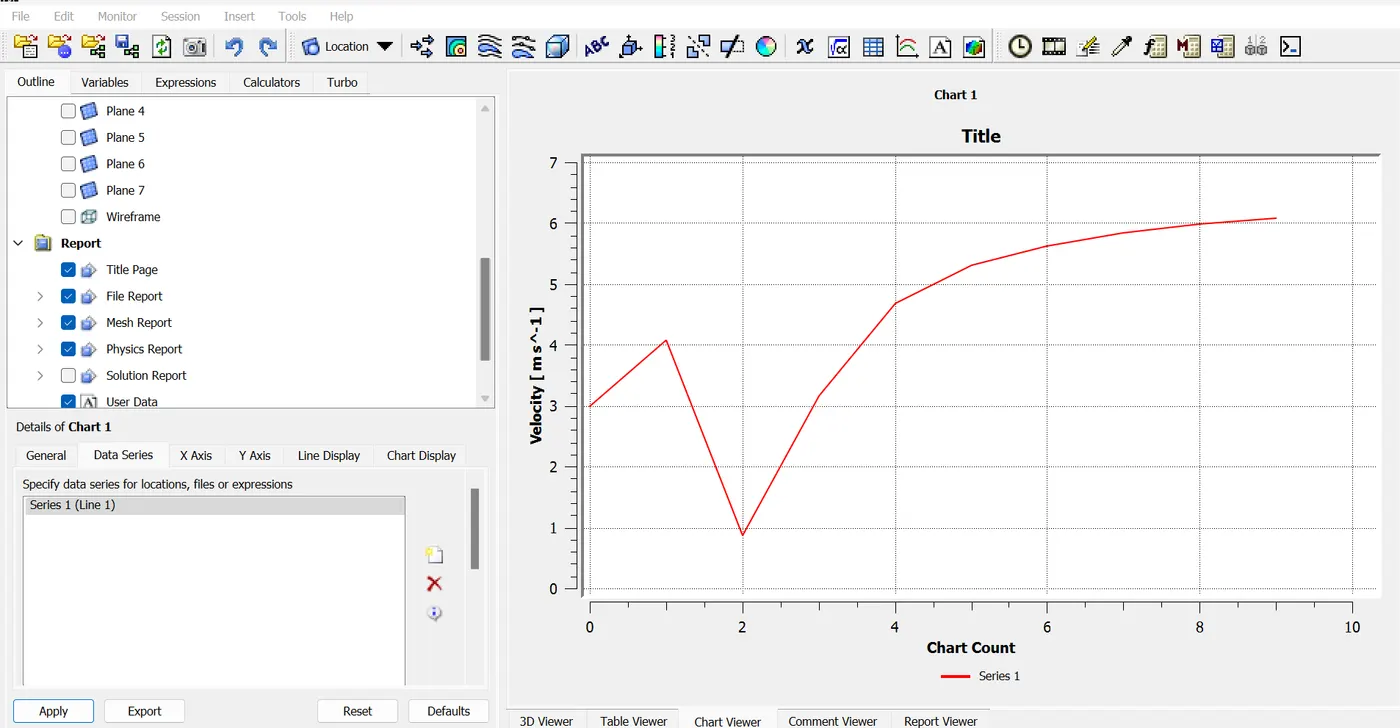
> We have to go inside the results then we have to create a horizontal line and a vertical line . First of all we have to go inside the insert option ,In insert having Line option we have click on it then select the parallel face , create Horrizontal and vertical line inside the T-joint. Once we created the lines then we have creat the Chart .
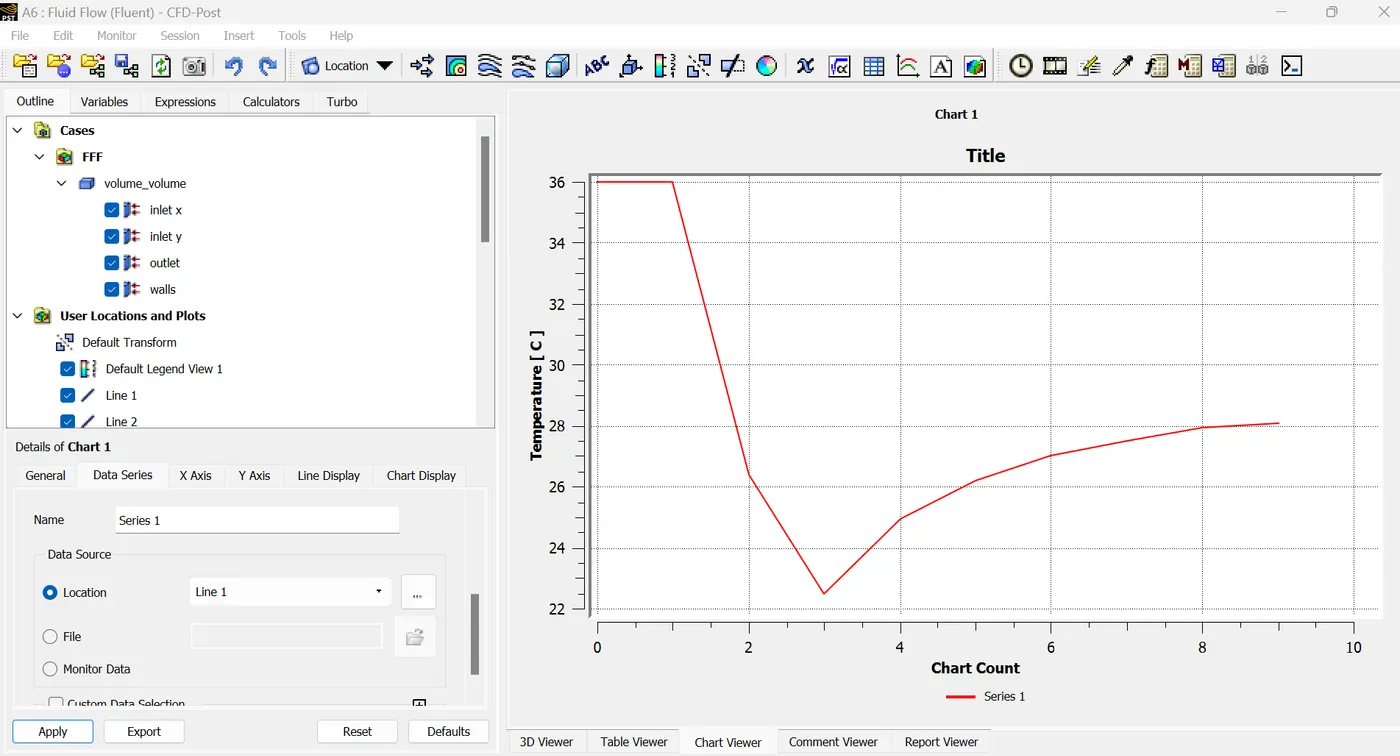
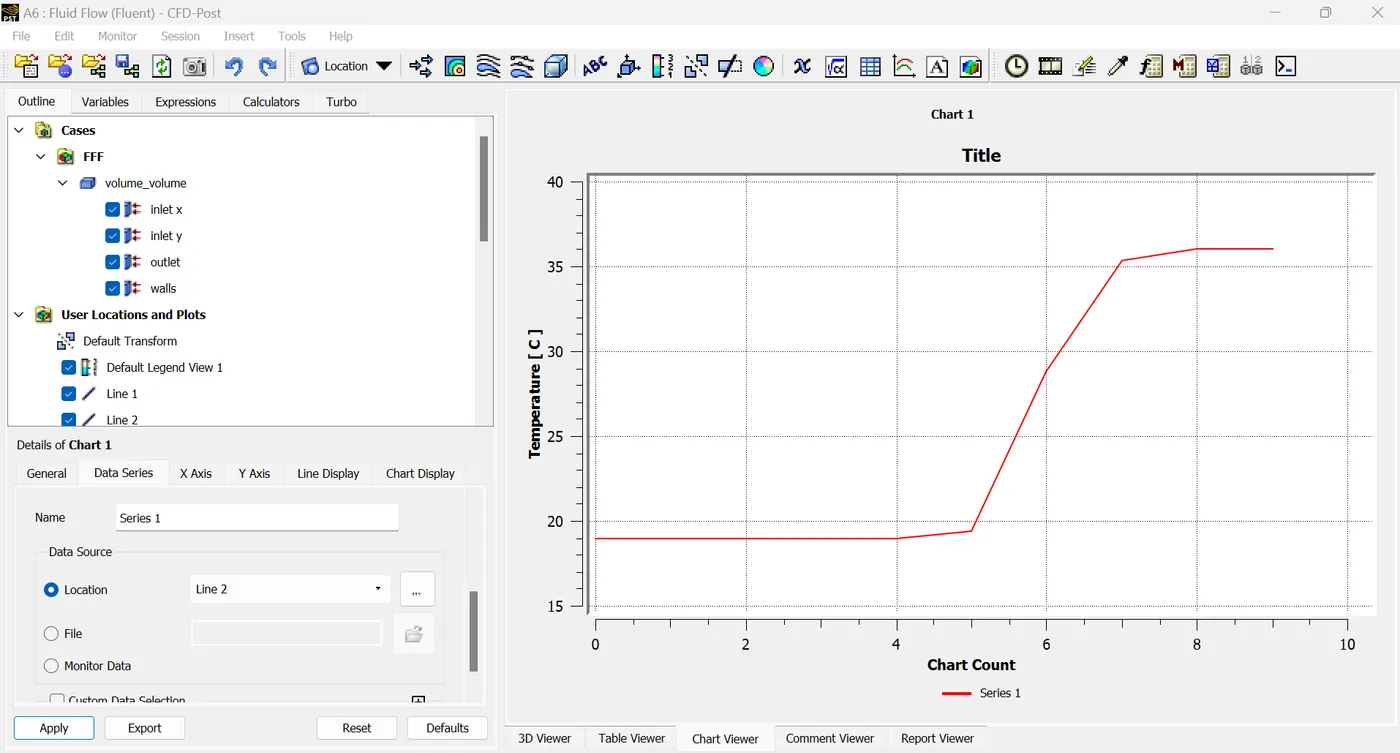
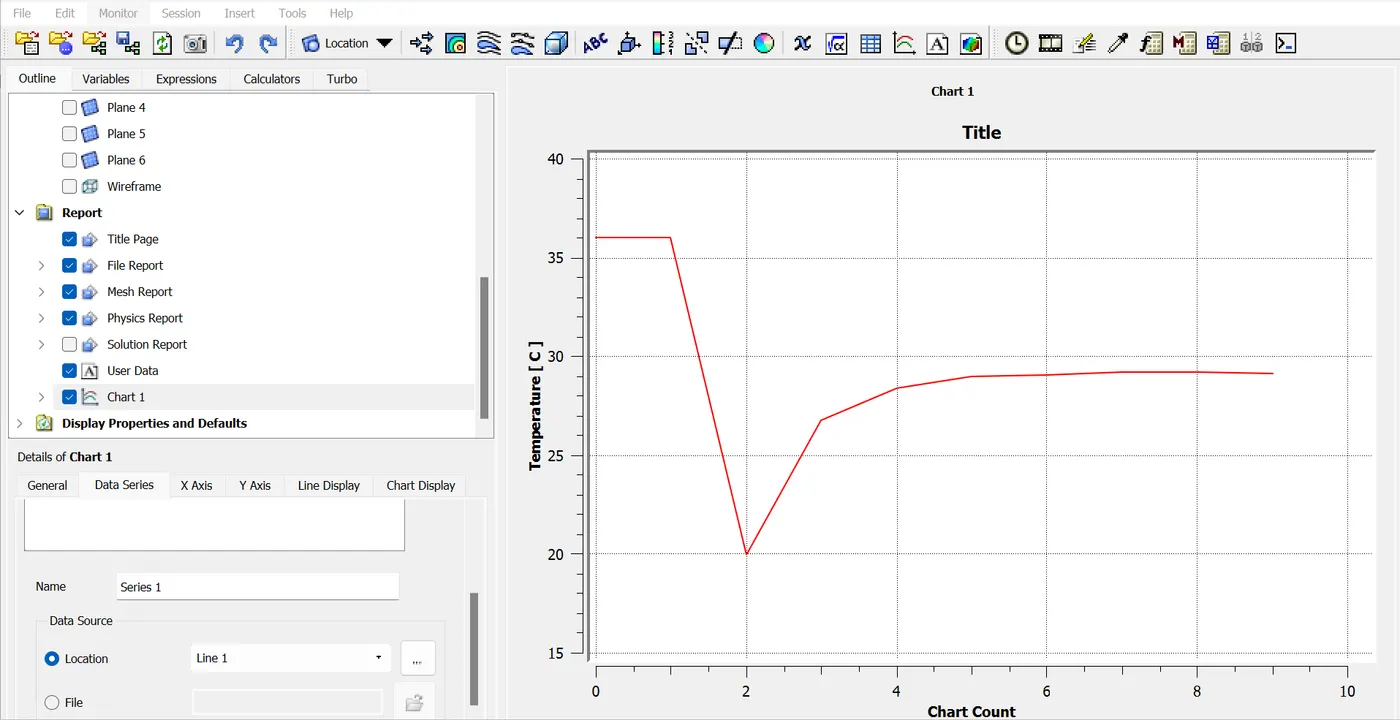
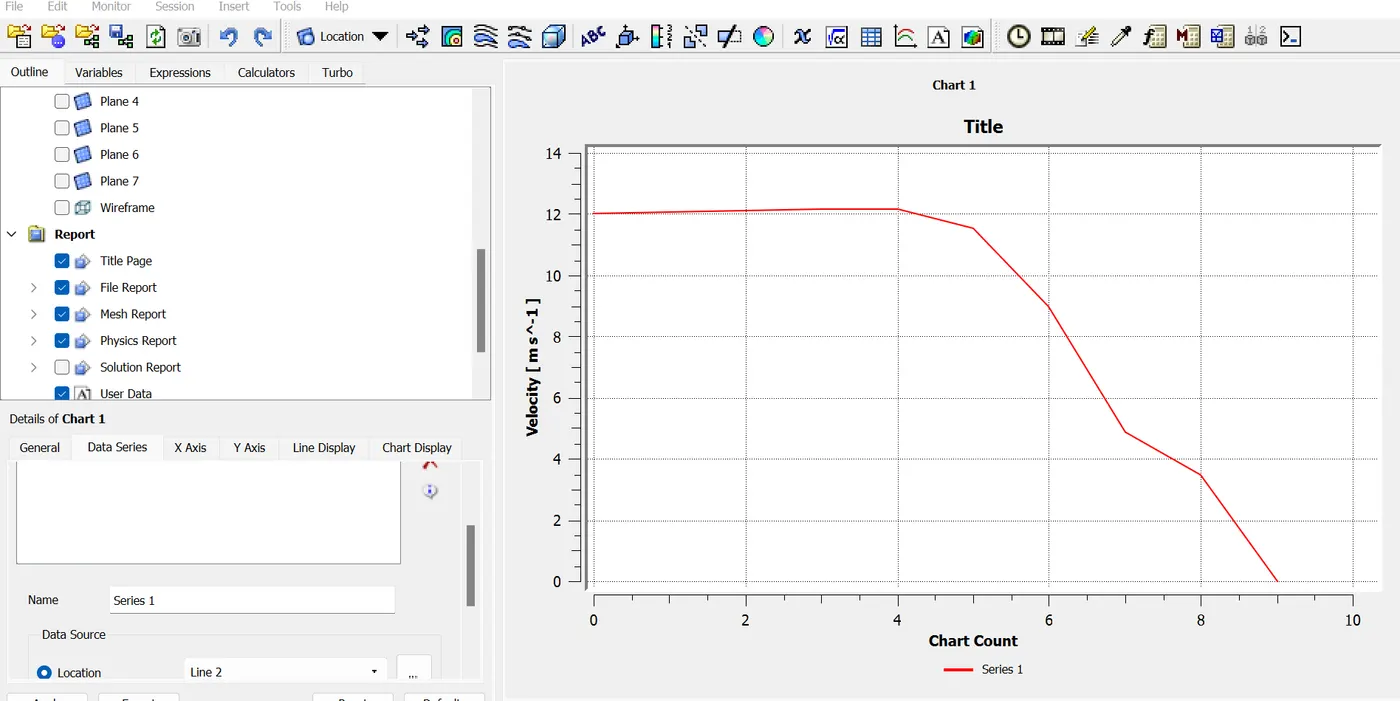
> Again we have to go inside Insert option then select the Chart and creat. After we have to go inside data series then creat a series 1 .we have select Line-1(Horizontal Line) or Line-2(Vertical Line) inside the Location. Then we have to go inside the X-Axis ,In X-Axis we have keep on Chart count inside variable. After that we have to go inside the Y-Axis then we have change to temperature Or Velocity inside variable. Then we no need to change anything and click on ok. we wiil got line plots inside the Chart.It seems like ,
Temperature:-
Line Plot (momentum ratio of 2):
 Line Plot (momentum ratio of 4):
Velocity:-
Line Plot (momentum ratio of 2):
Line Plot (momentum ratio of 4):
Long Mixing Tee:
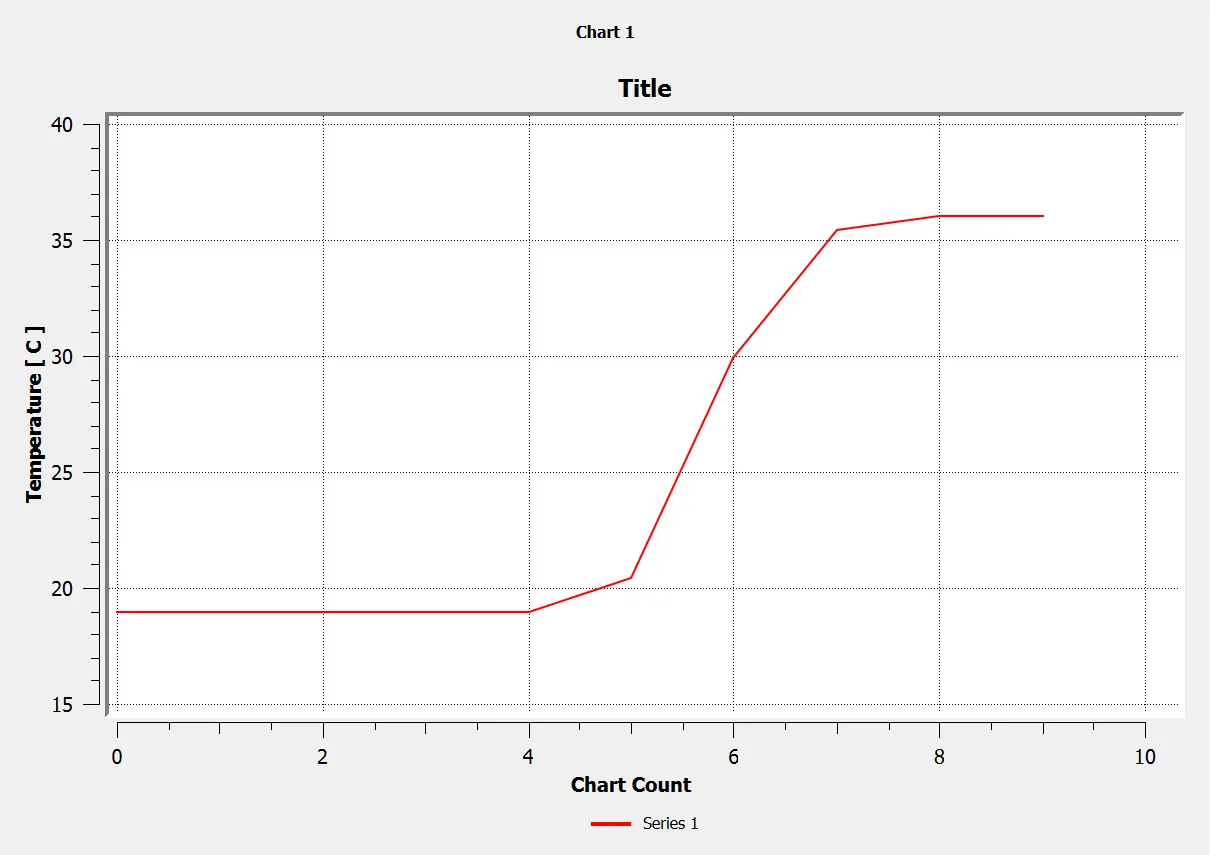
> We have to go inside the results then we have to create a horizontal line and a vertical line . First of all we have to go inside the insert option ,In insert having Line option we have click on it then select the parallel face , create Horrizontal and vertical line inside the T-joint. Once we created the lines then we have creat the Chart .
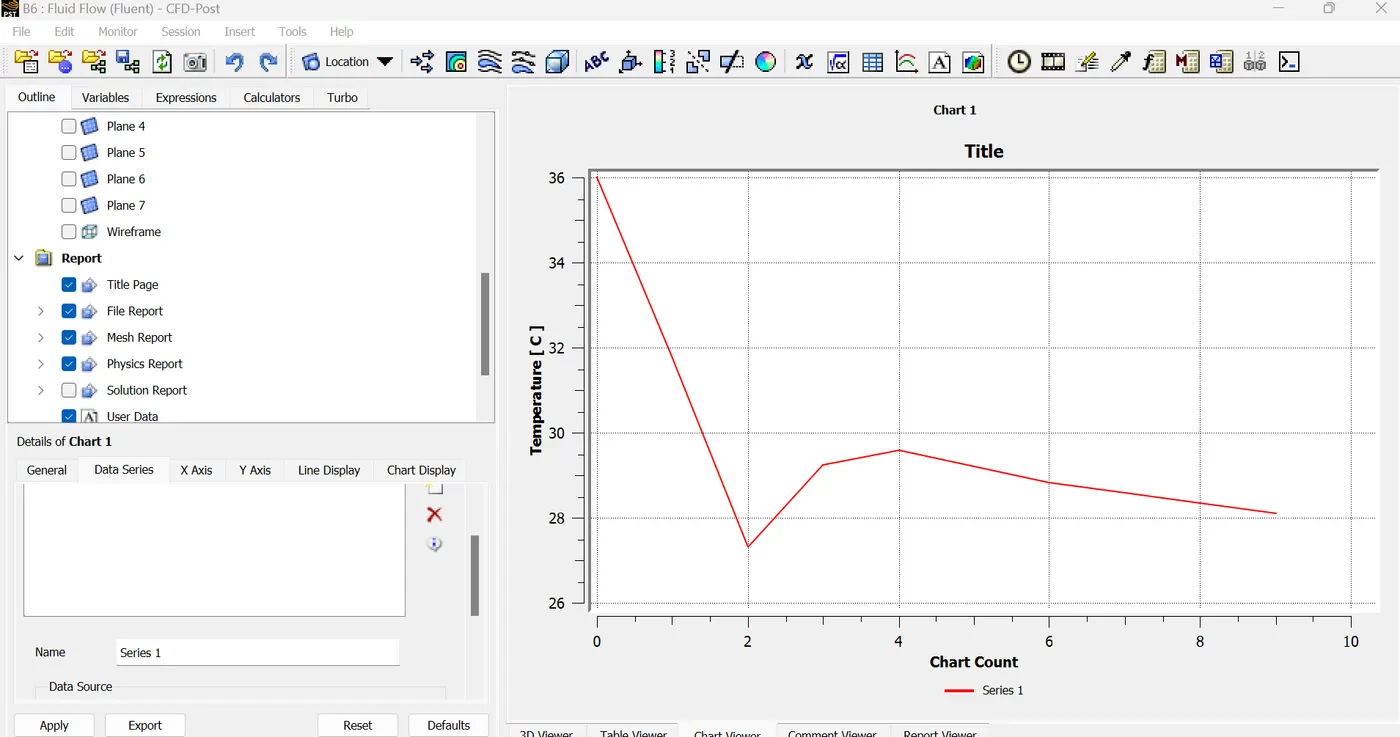
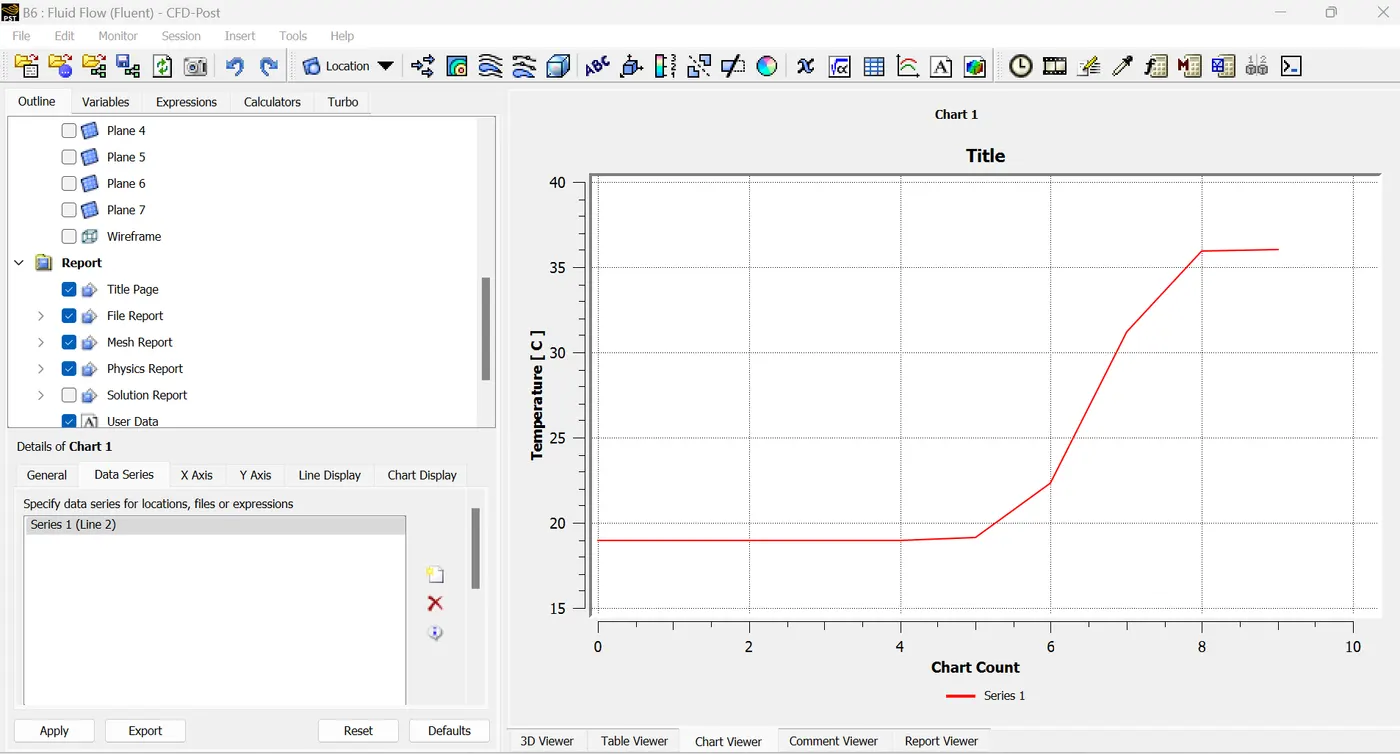
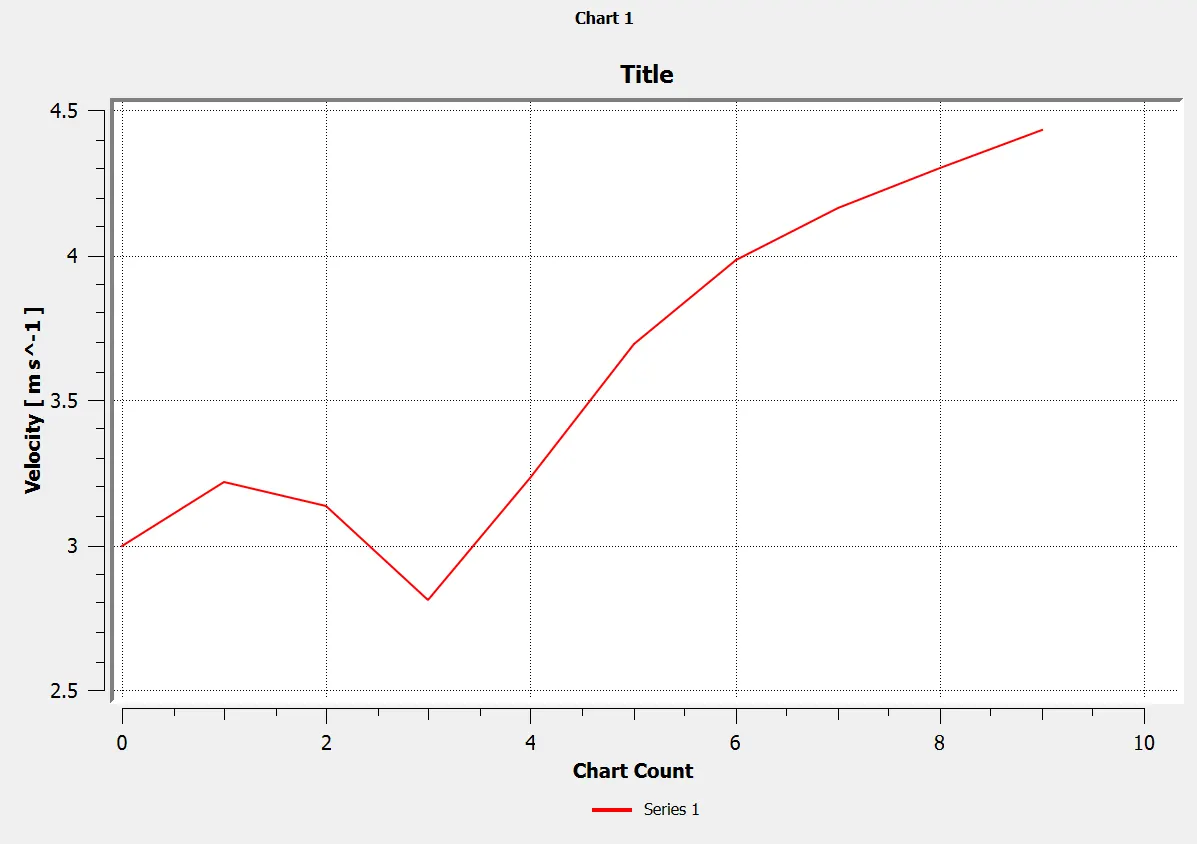
> Again we have to go inside Insert option then select the Chart and creat. After we have to go inside data series then creat a series 1 .we have select Line-1(Horizontal Line) or Line-2(Vertical Line) inside the Location. Then we have to go inside the X-Axis ,In X-Axis we have keep on Chart count inside variable. After that we have to go inside the Y-Axis then we have change to temperature Or Velocity inside variable. Then we no need to change anything and click on ok. we wiil got line plots inside the Chart.It seems like ,
Temperature:-
Line Plot (momentum ratio of 2):
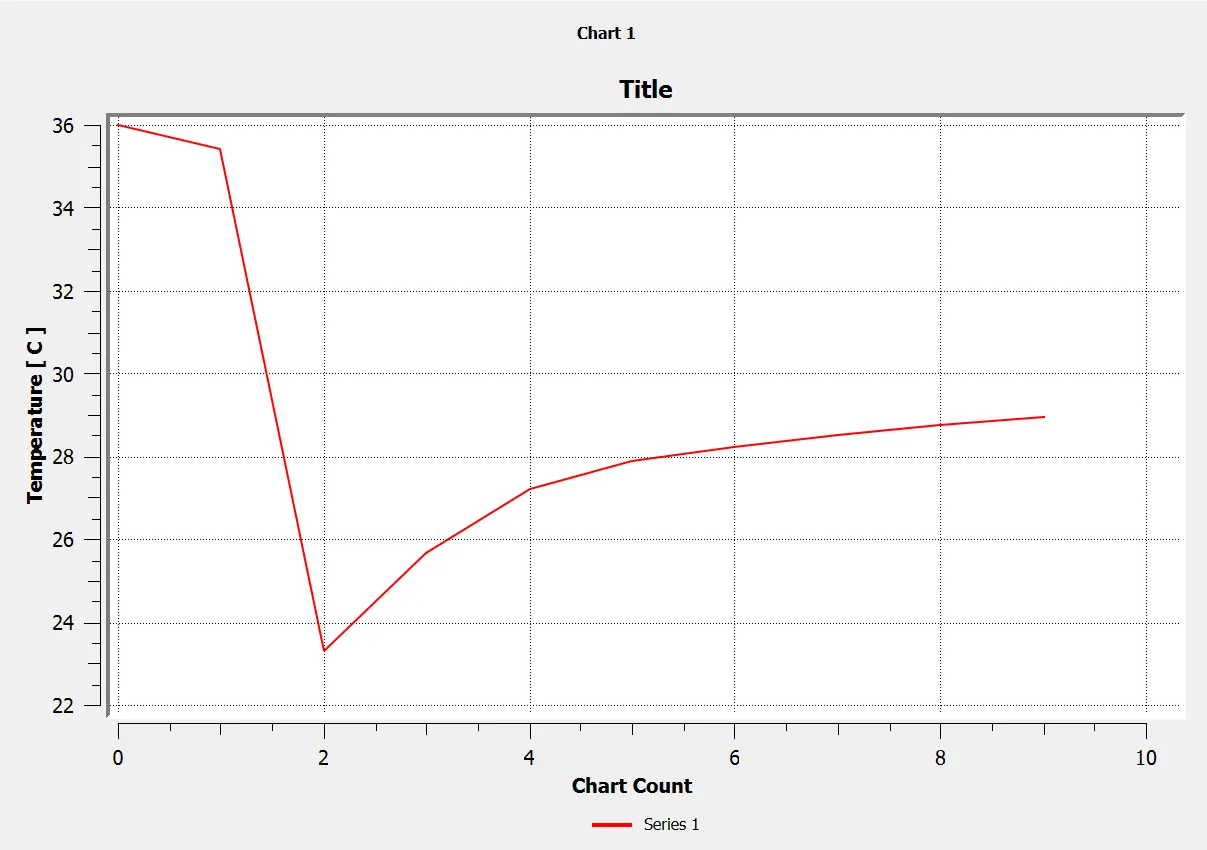
Line Plot (momentum ratio of 4):
Velocity:-
Line Plot (momentum ratio of 2):
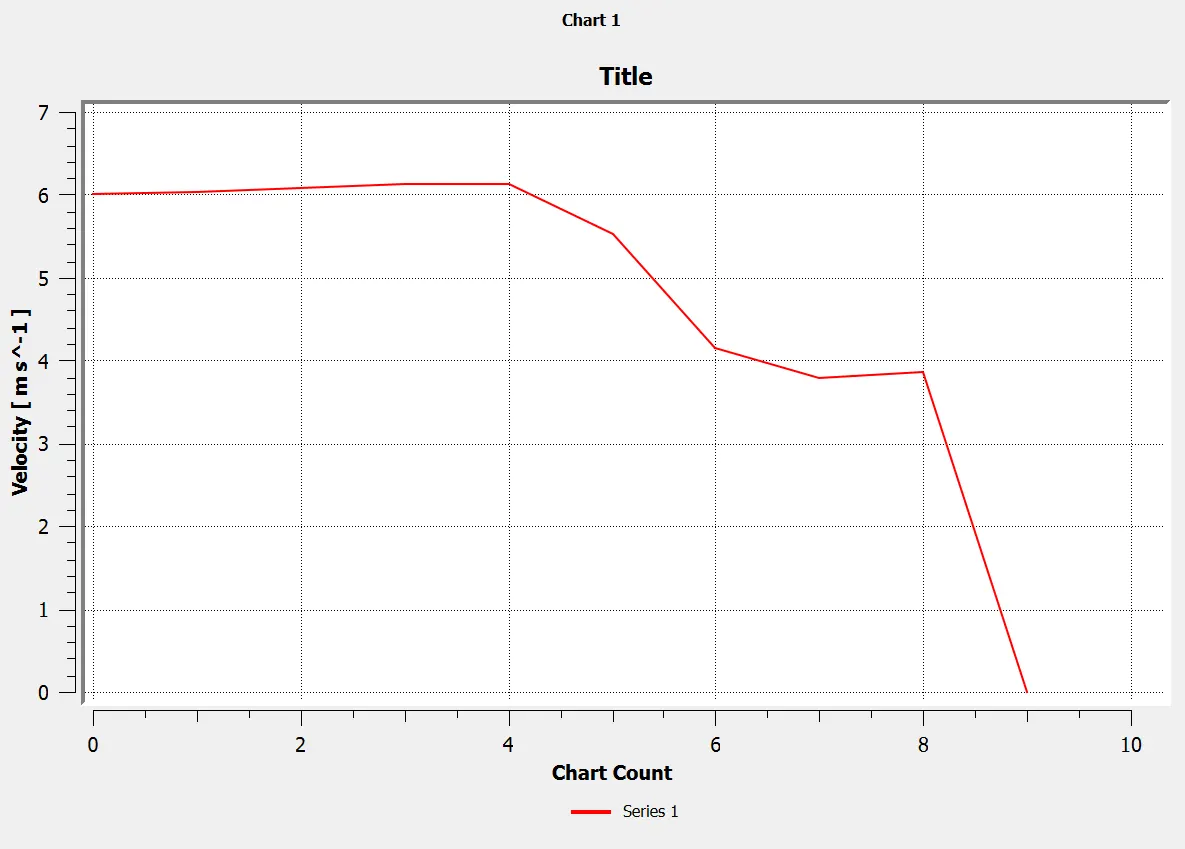
Line Plot (momentum ratio of 4):
3.Perform Mesh independent study for any one case:-
>> If we Increase the cell count then we are not getting good surface inside this model. If we decrease the cell count then we will got good surface. In this short mixing tee , we meshed with cell count is 0.1. after that i got good result. If we are making more smoother with less count then we wiil got good result after meshing.
>> In this Long mixing tee, we took cell count is 0.1. then we will got good .we are making more smoother with less count then we wiil got good result after meshing.
4.Discuss the effect of length and momentum ratio on results:-
>> In short mixing tee, when we putted hot inlet velocity is 3m/s and cold inlet with momentum ratio of 2 (it means Velocity of hot inlet is equal to Momentum ratio) in the same time. Then we don.t get that much of good result. Again we are going to put hot inlet velocity is 3m/s and cold inlet with momentum ratio of 4 in the same time. Then we will got good result.
>> In this Long mixing tee,we putted hot inlet velocity is 3m/s and cold inlet with momentum ratio of 2 in the same time. Then we don.t get that much of good result. Again we are going to put hot inlet velocity is 3m/s and cold inlet with momentum ratio of 4 in the same time. Then we will got good result.
>> If we are increase the cold inlet velocity then only we will got good result inside the T-joint.
>> If we are decrease the cold inlet velocity then we don,t get good result inside the T-joint.