Week 1- Mixing Tee
AIM=
.to set up steady simulattion to compare the mixing effectiveness when hot inlet temp is 36 degree c and cold inlet is at 19 degree c using k-epsilon and k-omega sst model for following model
1.case1
.short mixing tee with a hot inlet velocity of 3m/s
momentum ratio of 2,4
2.case 2
long mixing tee with a hot inlet veocity of 3/s
.momentum ratio 2,4
. to compare the following values from the 2 cases
1. cell count
2.average outlret temprature
.to make the followung result
1. velocity and temp contour plots on the cut plane along and across the pipe
2. velocity and temp line plots along and across the length of the pipe
3. perform mesh independently steady for momentum ratio on result
SOLUTION
procedure to set up simulation
GEOMETRY
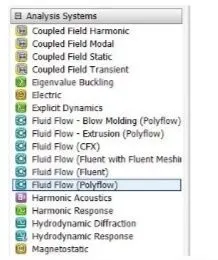
FIRST OFF ALL SETUP MAKE A SIMULATION SETUP SELECT FLUID FLOW (FLUENT) FROM THE LEFT SIDE WINDOW OF THE WORK BENCH
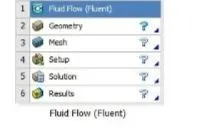
next select the first setup which is tp import geometry
after opening the geometry ,select file>open>and click file that you wanted to open
then click prepare option on the top menu bar to extract the volume
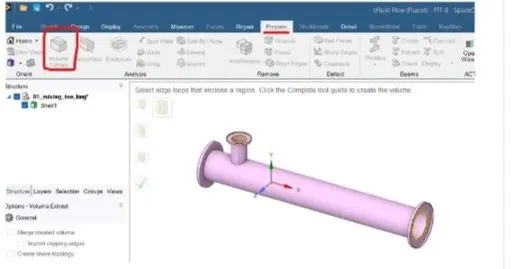
after opening volume extract click the edge from where the fluid flow is in contract during the simulation and remove the unwanted volume of the geometry
once thre geomtry is completed ,it shows mark in work bench geometry after importing geometry close the window and double click.the mesh in the workbench the window for mesh will open with imported the
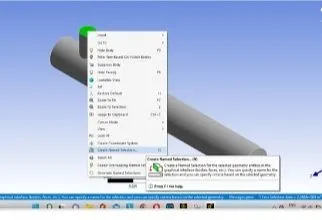
then the nameing section inlet -x
inlet-y
outlet
wall
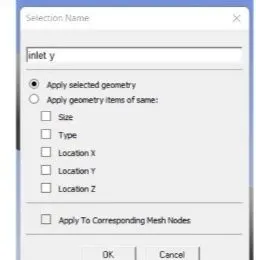
then mesh mouse right click generate mesh done
SETUP
now double click the setup
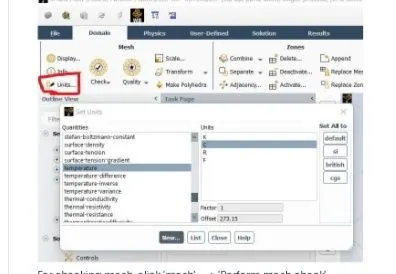
to change the unit of measurment
click unit in the top left of the menu bar and select the unit of mesurment change the temp
check mesh
then click the right mark energy click box since the temp parameter
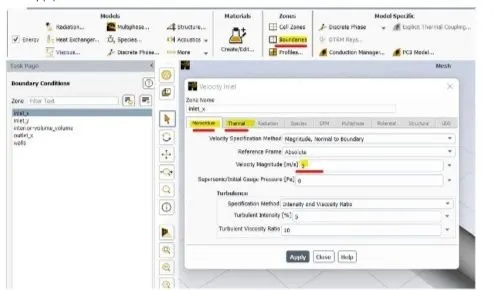
now select boundary in tool bar and select the surface where yoy have to setuup boundary condition for temp and velocity are inserted and apply ok
now click devition >new >surface report >area weighted average and
diffinition >new >surface report >standard devitation
then click initalize and data calcu;lateitteration 150
RESULT after setup close the window and click the result to check analysis than
the result window will open and the wall of the mesh apper on the screen a
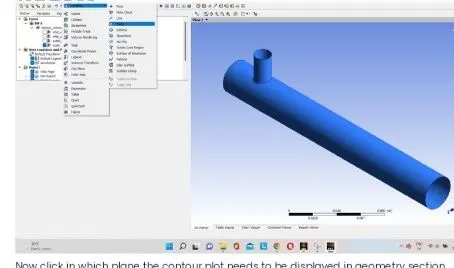
now click plane plane the counter plot need to be displasyed in the secti on
in the colour section change the mode variable portion select reqire temp ,pressureetc
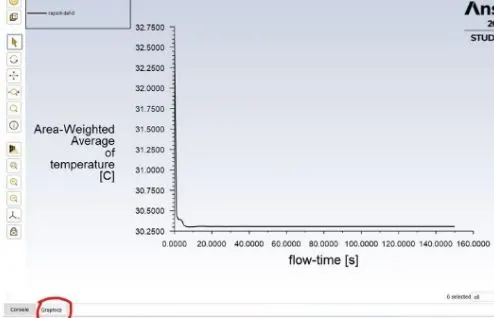
solution
1.cell count
2.average outlet temp
3.number of itteration for conservation the abobe the procedure reoprted for each case that asked in question for both k-epsion and k omega so totally 8 r
k- epsion k- omega
short mixing tee (3m/sinlet velocty) long mixing tee (3m/s inlet vlocity) short mixing tee (3m/s)inlet velocity ) long mixing tee (3m/sinlet velocity)
momentum momentum momentum momentum momentum momentum momentum momentum
ratio-2 ratio=4 ratio=2 ratio=4 ratio=2 ratio=4 ratio=2 ratio=4
cell count 12692 12780 15727 15709 12780 12780 15727 15727
aveg temp outlet 30.2668 27.50 30.2613 27.48 30.26 25.57 30.26 27.49
no o itteration 50 40 60 50 60 50 80 40
stand devition temp 1.15 1.35 1.23 0.46 1.55 1.422 0.982 0.629
-
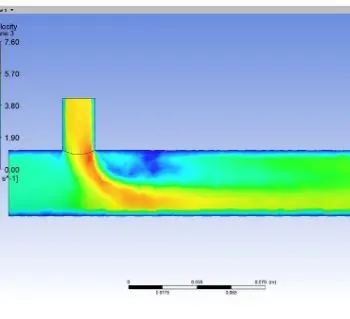
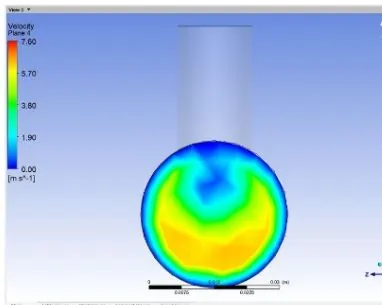
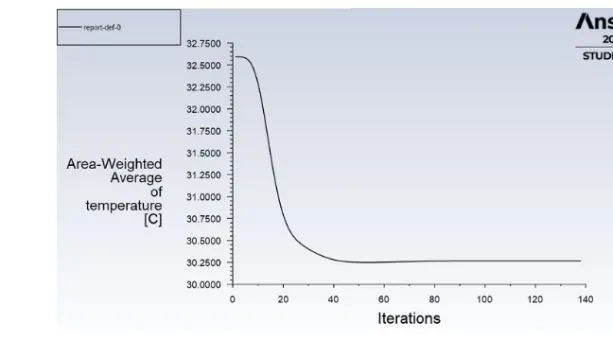
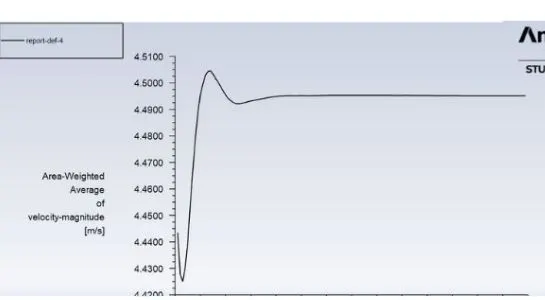
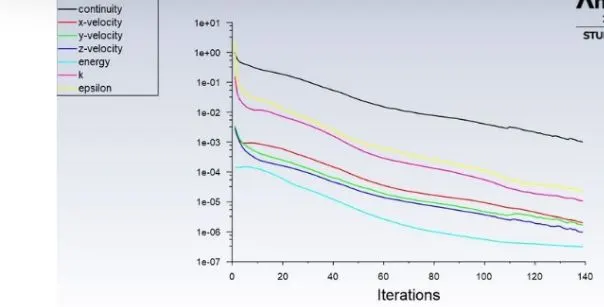
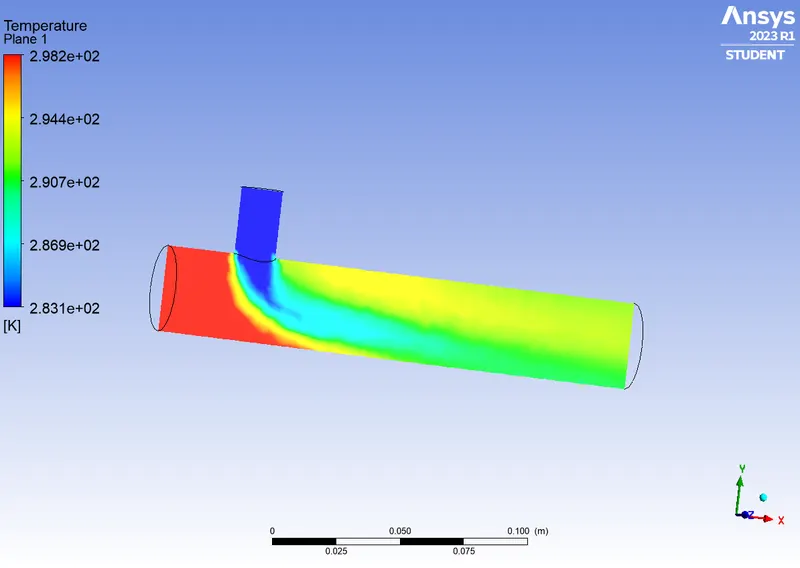
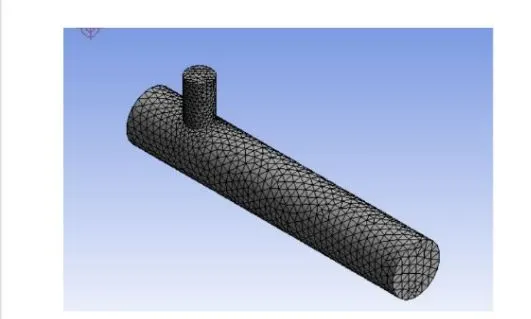
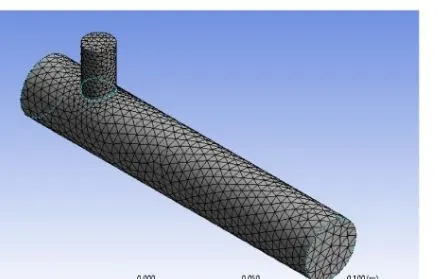
result mesh study
k- epsion model (mixing tee short step)
mesh element size default size 0.005 0.003 0.0002
moment rato 2 2 2 2
no of cell 12692 14249 39792 106544
avg temp outlt 30.266 30.24 30.27 30.29
stand devitio 1.15 1.41 1.61 1.84
no of ittreatio 50 60 70 75