Week 1- Mixing Tee
Aim:
In this challenge, we have two versions of the mixing tee. One of them is longer than the other. Our job is to set up steady-state simulations to compare the mixing effectiveness when hot inlet temperature is 360C & the Cold inlet is at 190C.
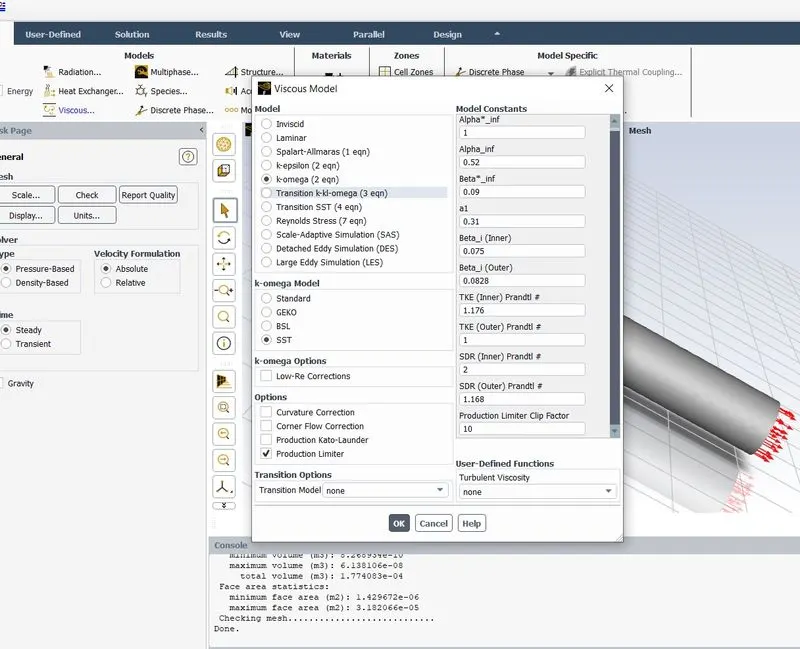
Use the k-epsilon and k-omega SST model for the first case and based on your judgment use the more suitable model for further cases. Giving the reason for choosing a suitable model is compulsory.
Case 1
- Short mixing tee with a hot inlet velocity of 3m/s.
- Momentum ratio of 2, 4.
Case 2
- Long mixing tee with a hot inlet velocity of 3m/s.
- Momentum ratio of 2, 4.
Momentum ratio = velocity at cold inlet / velocity at hot inlet.
MEDIUM : AIR
Introduction :
Mixing tee:
Mixing tee is a flow control device, in which it contain two inputs and one output, the main function of this mixing tee is mixing the two different flows with each other.
Steps in the mixing tee shown below:
- Geometry
- Meshing
- Setup
- Solution
- Result
SOLUTION :
Procedure to Analysis the short Mixing Tee -
Geometry -
First, to make a simulation setup, select Fluid Flow(Fluent) from the left side window of the workbench.
Next, select the first step which is to import geometry.
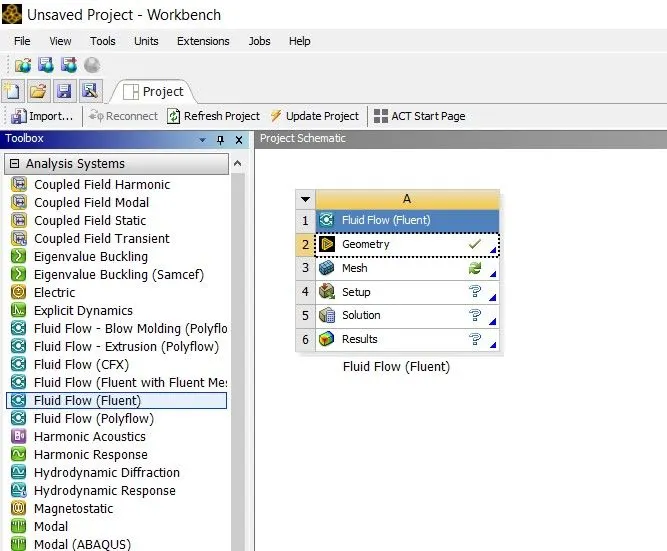
After opening the geometry, Select File ---> Open ---> and click the file that you wanted to open. Here, in this case, I have selected 'mixing_Tee_long.STEP'. OR
You can right click on Geometry and easily import in and open the spaceclaim in it.
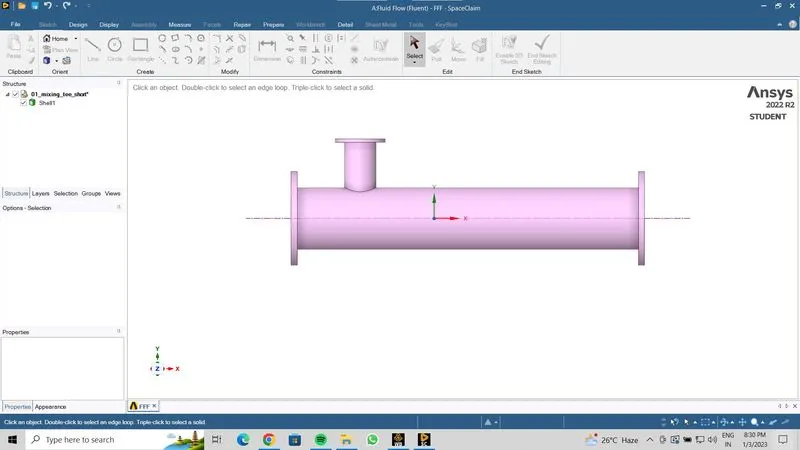
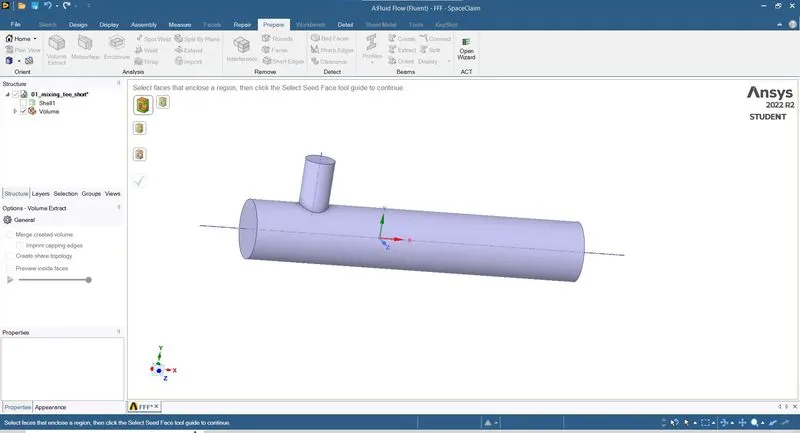
The next step is to extract the volume by command extract volume in prepare option.
Select the edges of the Mixing tee and suppress the physics of solid part of model.
Once the geometry is complete, it shows tick mark in workbench geometry. After importing geometry, close the window and double click the MESH in the workbench. The window for mesh will open with imported geometry.
MESH -
Click on the Geometry faces and press 'N' as a shortcut key to name the surface.
For example name the topmost inlet as inlet y.
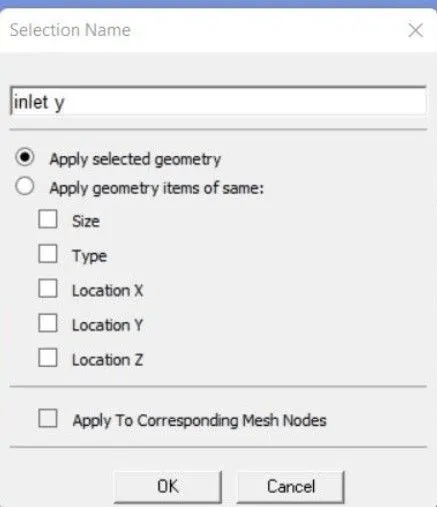
For inlet and outlet of the surface, give name as 'inlet (axis of the flow)' so that ansys can read the name and give the flow direction according to it during setup. example: 'inlet-x, inlet-y, outlet-x. Then select other surfaces and give name as 'walls'. Then close it before opening the next step 'SETUP'.
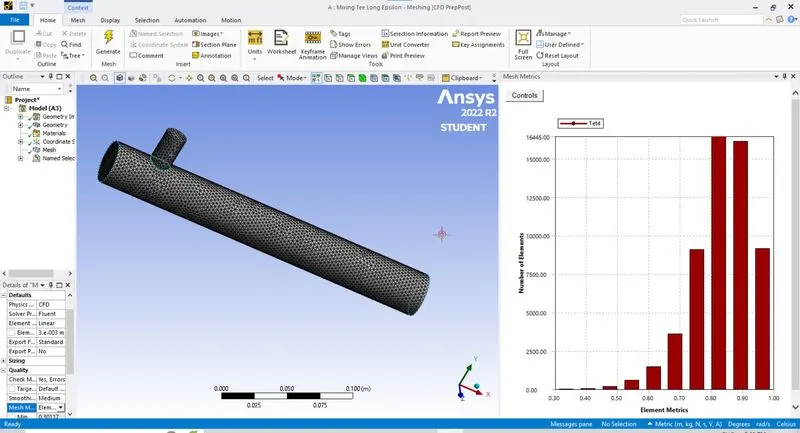
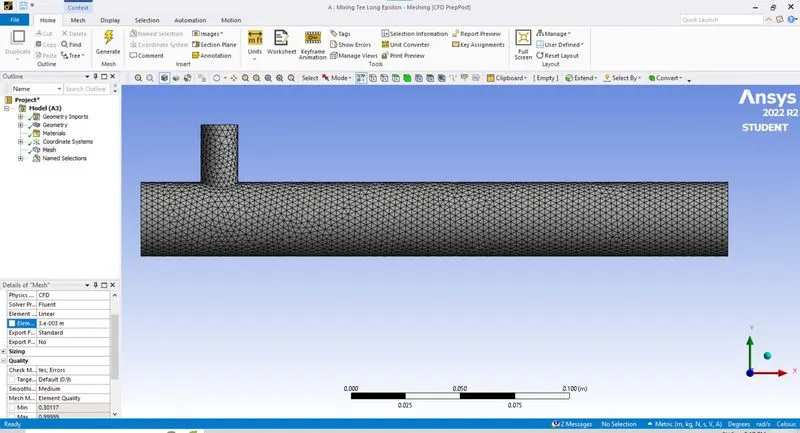
Element Quantity and Mesh Mixing Tee
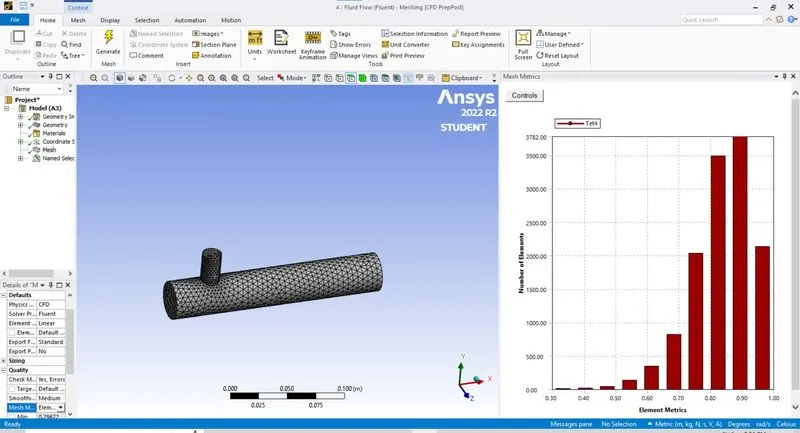
Then right click the 'mesh' and select update.
SETUP :
Now double click the 'Setup' and open it. Tick the 'Double precision' check box and start the setup.
To change the units of the measurements, click units in the top left of the menu bar and select the units for the respective measurements.
For checking mesh, click 'mesh' --> 'Perform mesh check'.
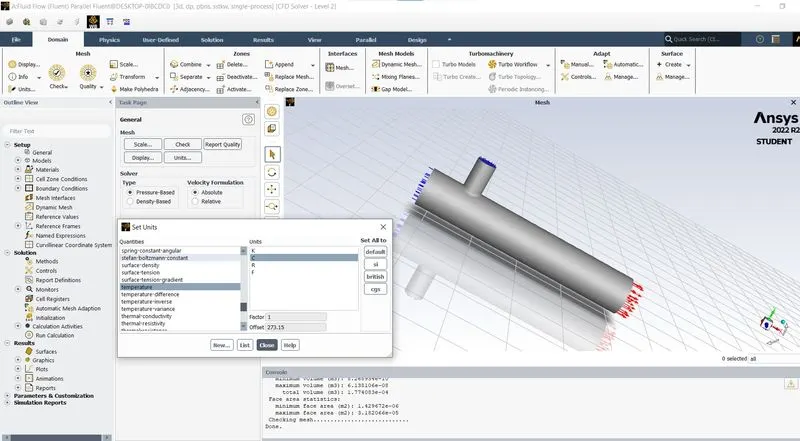
Now, for selecting the type of model, select viscous in tool bar and select the model required and it's classification and its types.
Then click the tick mark in 'Energy' check box since the temperature parameter is involved in simulation.
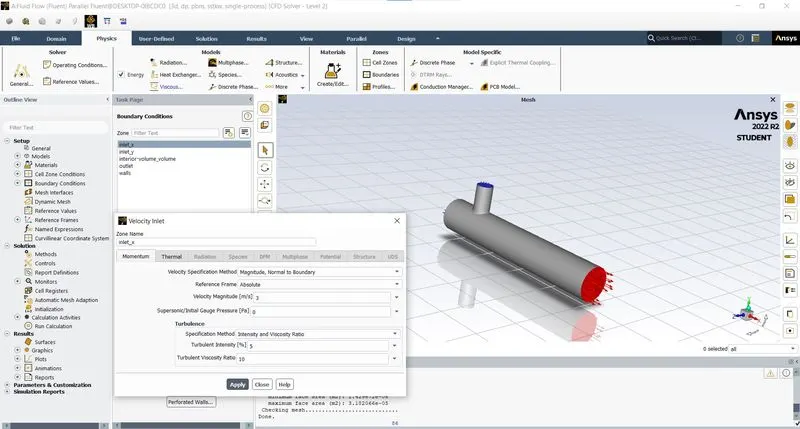
Now select 'boundary' in toolbar and select the surface where you have to setup the boundary conditions. The boundary conditions for temperature and velocity are inserted and apply ok. Likewise type 3 m/s and temperature 25 degree celsius for inlet x and type 10 m/s and temperature 10 degree celsius for inlet y.
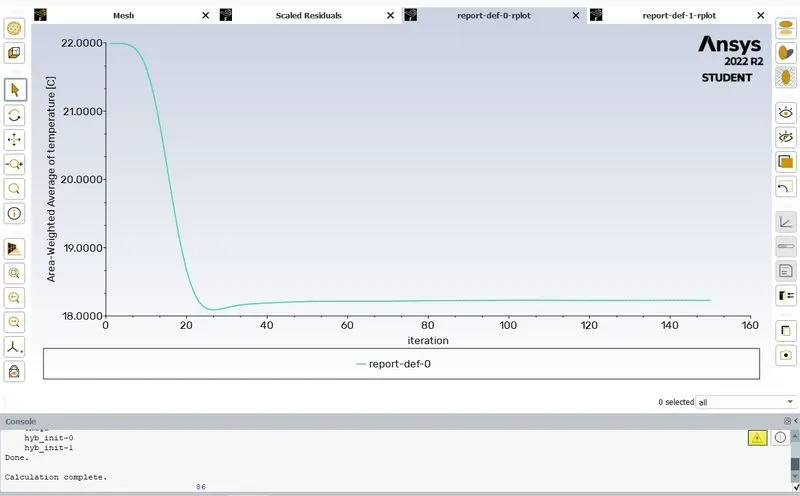
Now click 'Defnitions' ---> New ---> Surface Report ---> Area-Weighted Average
and
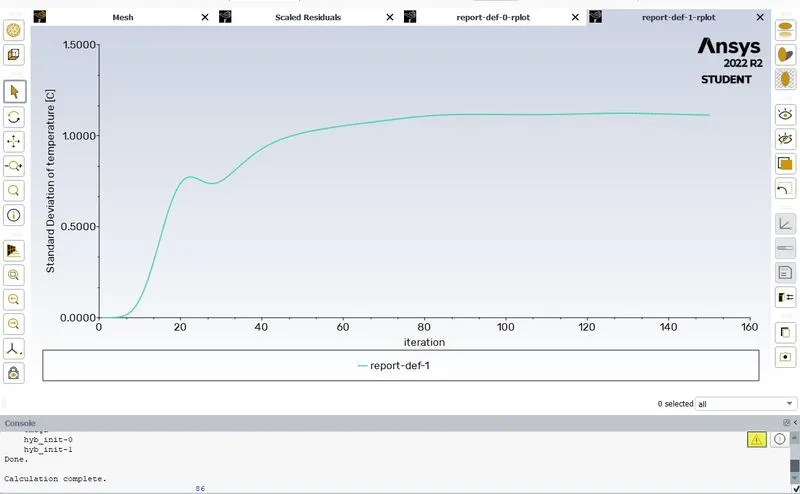
'Defnitions' ---> New ---> Surface Report ---> Standard Deviation.
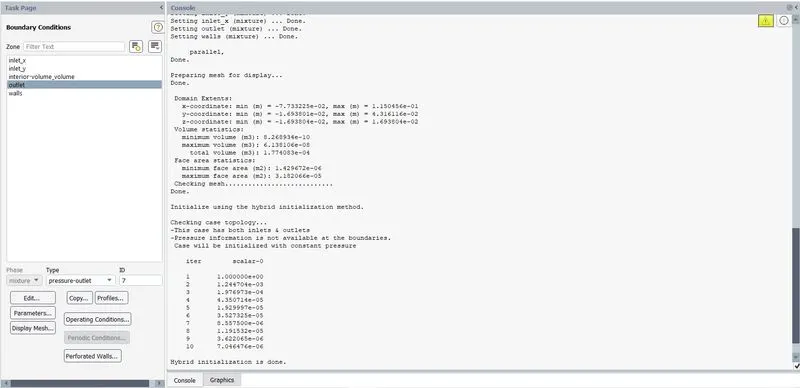
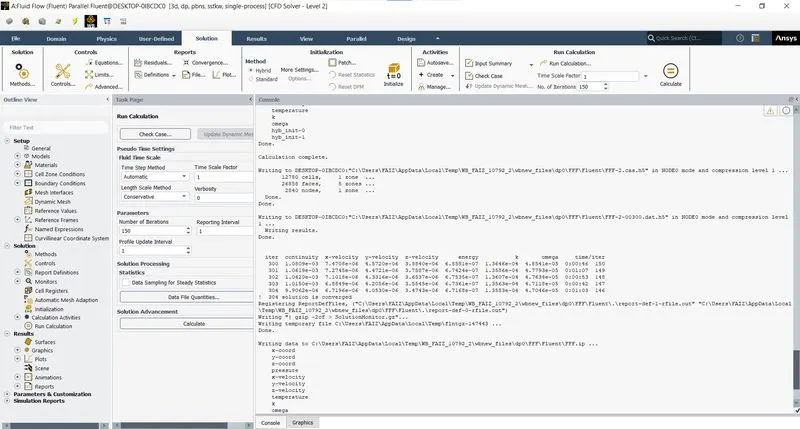
Then, click on initialize to initialze the data and click 'calculate' to perform iteration. Give the iteration number as 150 approx.
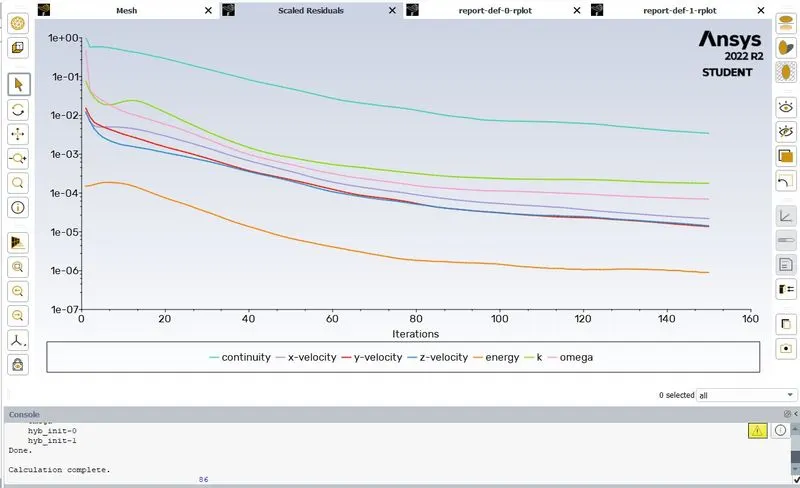
The following output are
RESULTS :
After setup, close the window and click results to check and analyse the results of simulation.
The result window will open and the walls of the mesh will appear on screen after clicking the tick mark of walls.
Now click render icon and increase the value of transparancy to make the walls more transparant so that contour images of the flow can be viewed easily.
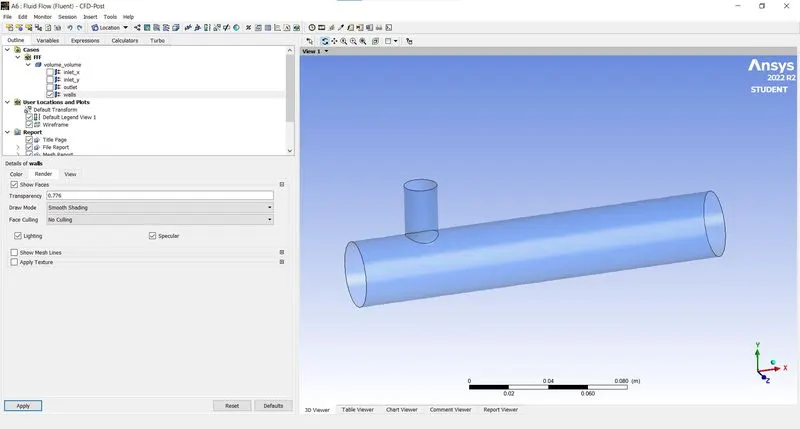
Now click 'Insert' icon in the menu bar ---> location ---> plane.
Now click in which plane the contour plot needs to be displayed in geometry section.
In the color section, change the mode to 'variable' and in the 'variable' portion, select the required variable such as temperature, pressure etc, in which the plot to be displayed. Then select 'Apply'.
Then the required plot will be displayed on the screen in the entered plane of axis.
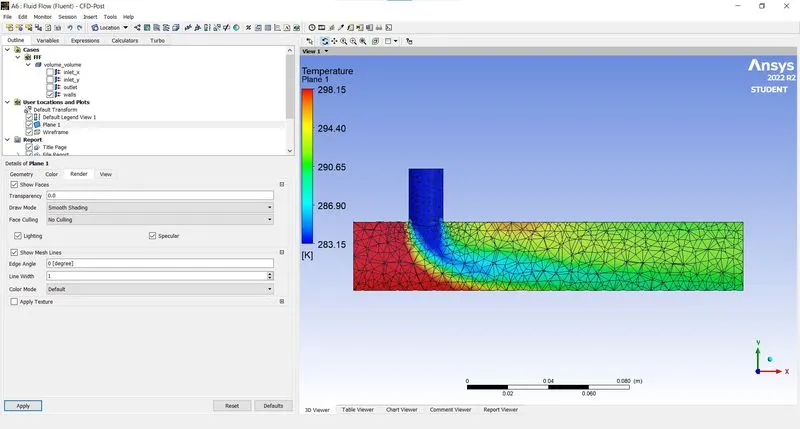
k OMEGA MODEL SHORT MIXING TEE (3 M/S INLET VELOCITY)
k EPSILON MODEL LONG MIXING TEE(3M/S INLET VELOCITY)
The methods are same as of short mixing tee Further are the images of Long mixing tee with k epsilon model with a mesh element size of 0.003 :
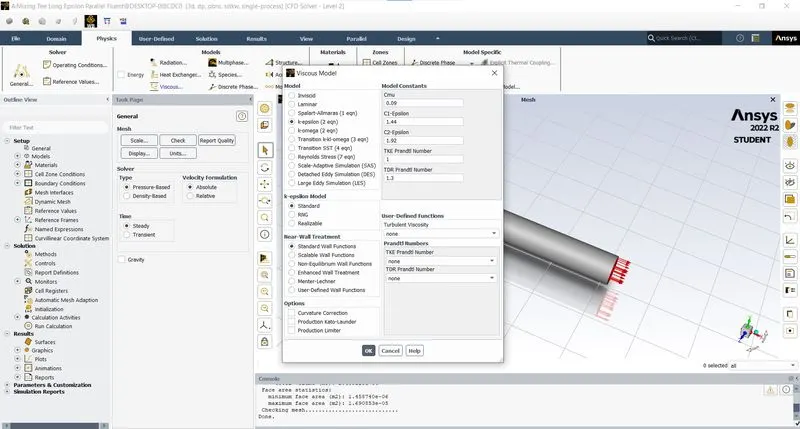
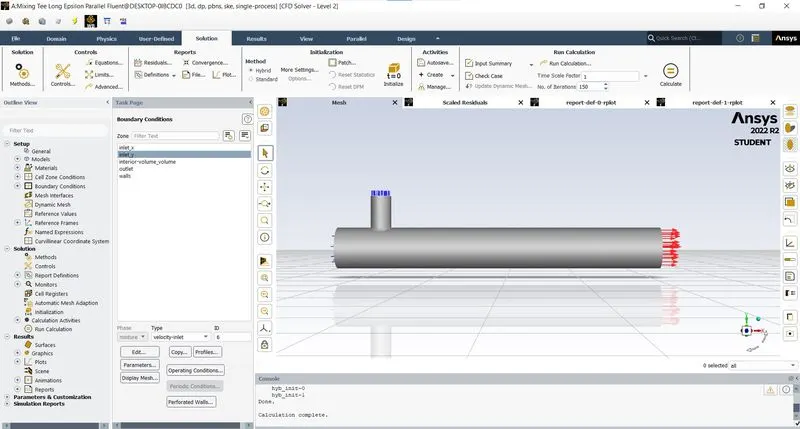
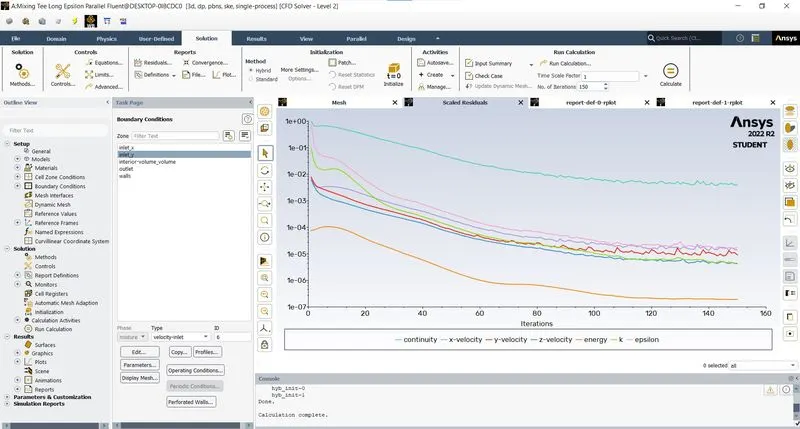
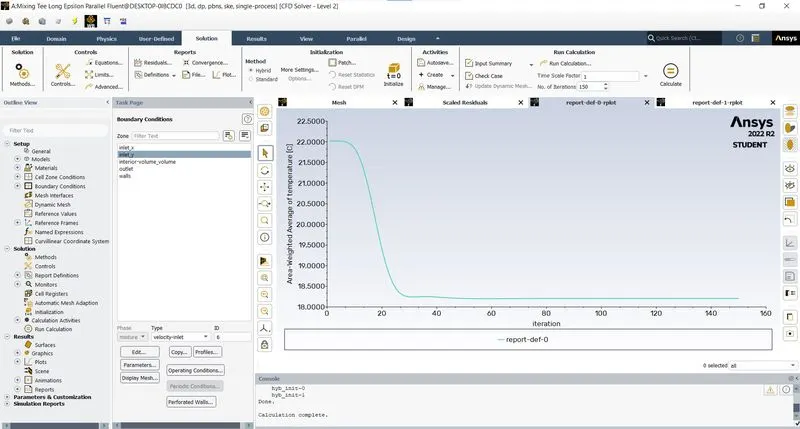
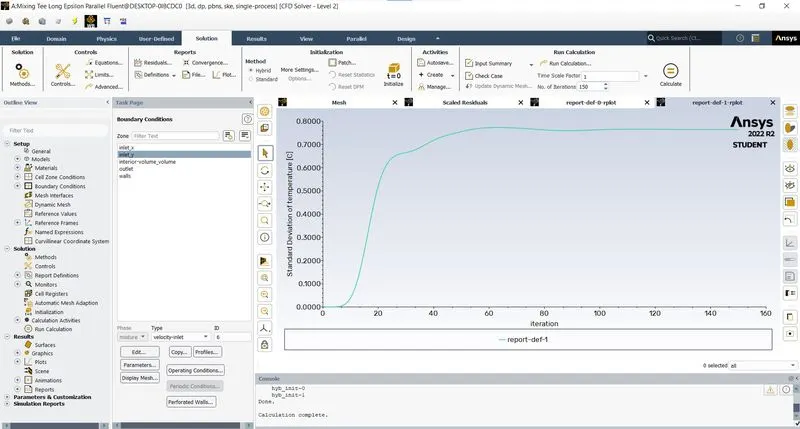
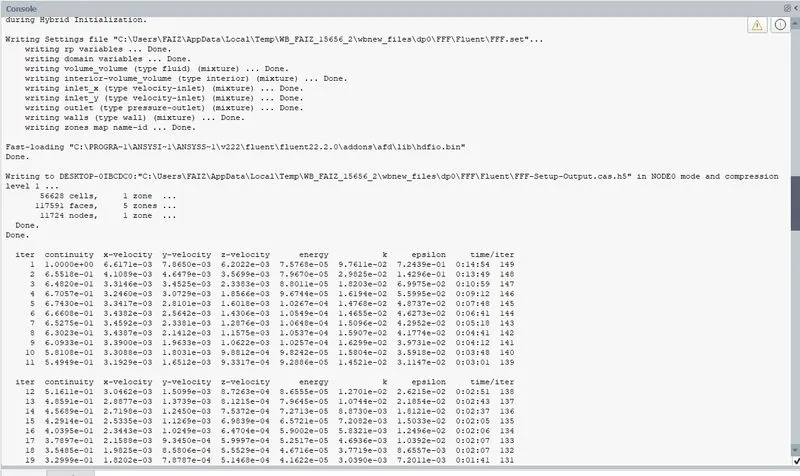
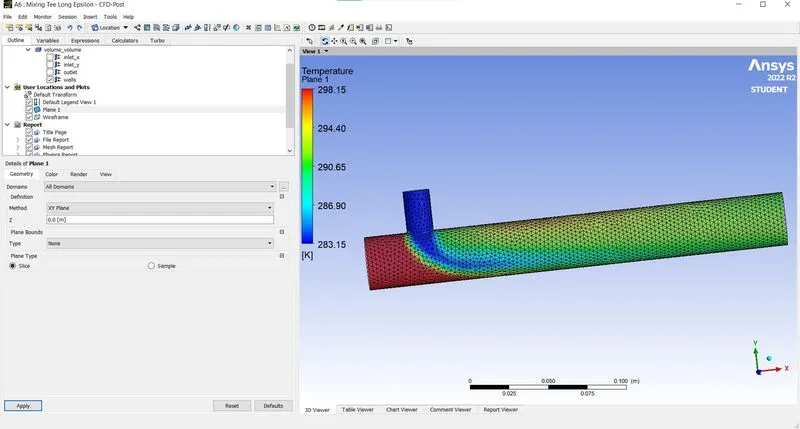
The above procedure is repeated for each case that is asked in question for both k-ε and k-ω model. So totally 8 simulations is carried on and the results are shown below.
|
k-ε model |
k-ω model |
|||||||
|
Short mixing tee (3 m/s inlet velocity) |
Long mixing tee (3 m/s inlet velocity) |
Short mixing tee (3 m/s inlet velocity) |
Long mixing tee (3 m/s inlet velocity) |
|||||
|
|
Momentum ratio=2 |
Momentum ratio=4 |
Momentum ratio=2 |
Momentum ratio=4 |
Momentum ratio=2 |
Momentum ratio=4 |
Momentum ratio=2 |
Momentum ratio=4 |
|
Cell Count |
12692 |
12780 |
15727 |
15709 |
12780 |
12780 |
15727 |
15727 |
|
Avg.Temperature outlet |
30.2668 |
27.50 |
30.2613 |
25 |
30.262 |
25 |
30.306 |
27.494 |
|
No of iterations |
50 |
40 |
60 |
150 |
60 |
150 |
80 |
40 |
VELOCITY AND TEMPERATURE CONTOUR PLOTS :
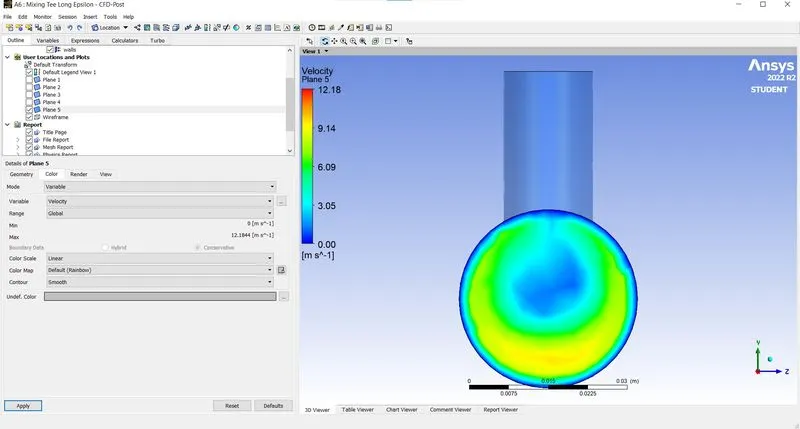
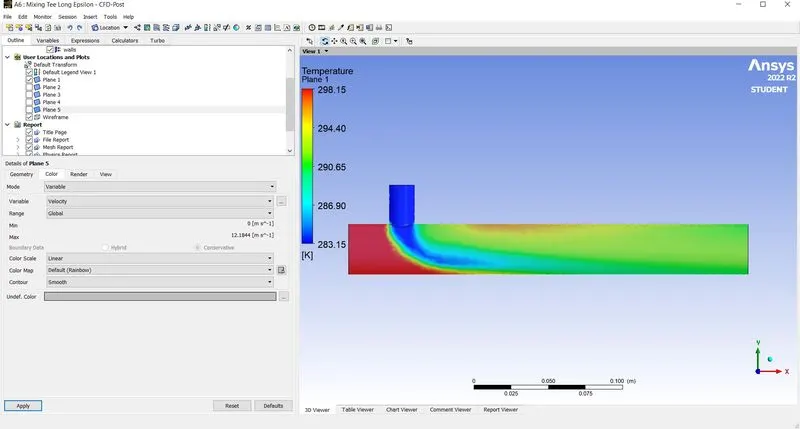
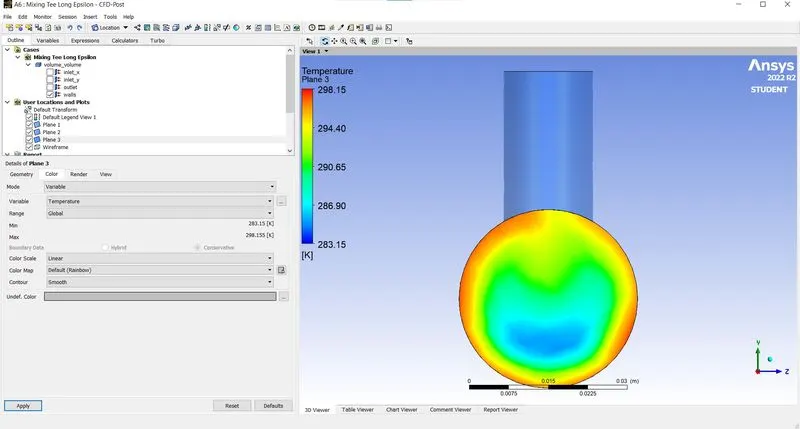
K EPSILON LONG MIXING TEE WITH 3 M/S INLET VELOCITY and with 150 iterations -
VELOCITY CONTOUR PLOT ALONG THE PIPE -
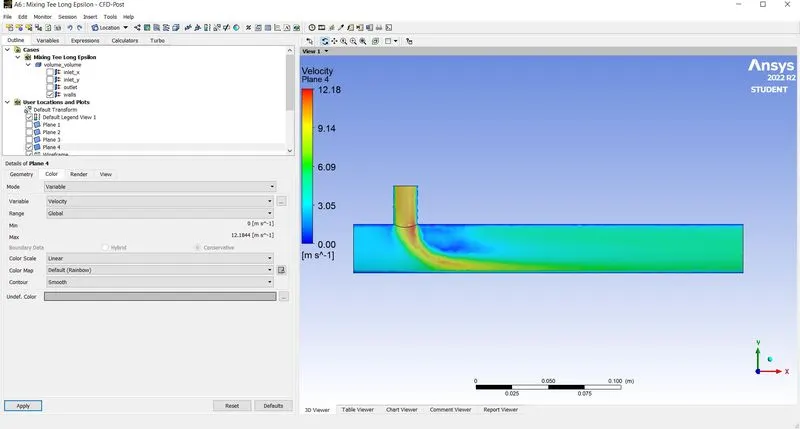
VELOCITY CONTOUR PLOT ACROSS THE PIPE -
TEMPERATURE CONTOUR PLOT ALONG THE PIPE -
TEMPERATURE CONTOUR PLOT ACROSS THE PIPE -
MESH GEOMETRY WITH DIFFERENT ELEMENT SIZE :
MESH GEOMETRY WITH ELEMENT SIZE 0.003 -
MESH GEOMETRY WITH ELEMENT SIZE 0.002 -
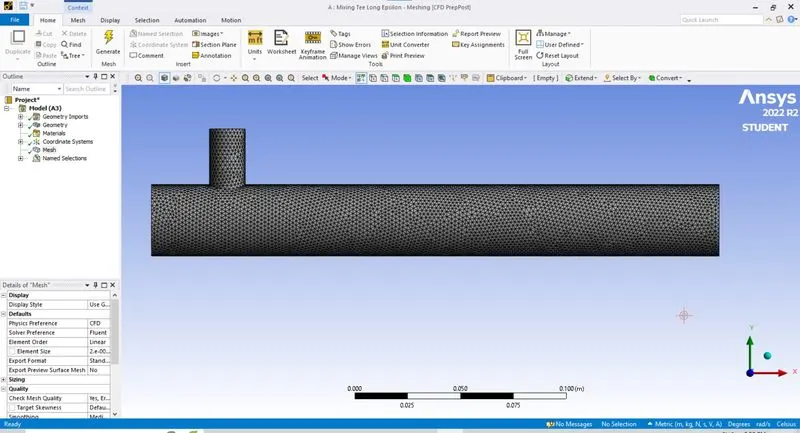
MESH GEOMETRY WITH ELEMENT SIZE 0.001 -
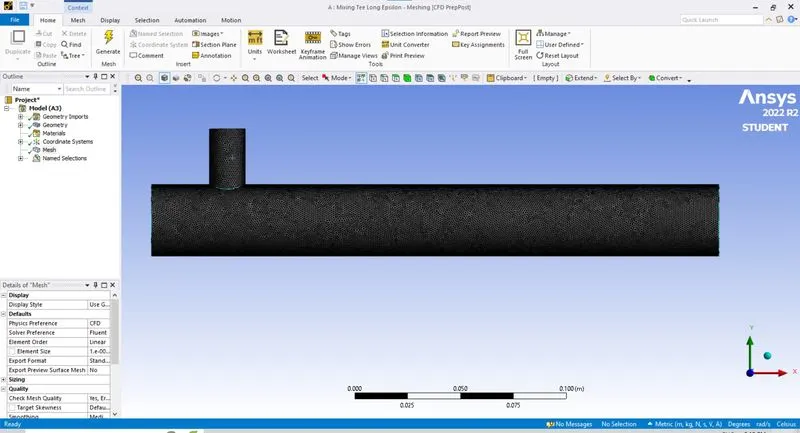
ERROR FACED -
1) BASIC MISTAKES LIKE WRONG SELECTION OF PLANE , EDGE ETC
2) BASIC LICENSE ERROR ETC
CONCLUSION :
- To get better mixing at outlet, high velocity is preferred so momentum ratio of 4 has better mixing results at outlet.
- As the length of the mixing tee increases, the mixing time is more before it exits from the outlet. Thus the long mixing tee has better mixing characteristics.
- As the mesh size is coarser, the number of iterations required to converge to final result is less. But as the mesh size gets finer, the number of iterations for convergence increases since there are more number of cells to perform simulation.
- In both cases of K-epsilon snd k-omega, k-epsilon has better results as we see in the residual plot these converge faster compared to k-omega
- From the above results, the meshing has to be improved. Which may give better results