Week 1- Mixing Tee
AIM- By using ANSYS we simulate Mixing Tee for momentum Ratio 2 & 4 . Where the velocity at inlet is given 3 m/s . Then create graphs and contours for mixing tee and compare results.
INTRODUCTION
Mixing tee is a device which uses sspecificially engenieered internal geometry to mix two fluid streams in this case its hot and cold .Here we are goin to study effects of mixing two fluid by using ANSYS and comparing analytical solution and computational solution and determine effects of length on mixing.
According to input data mentioned
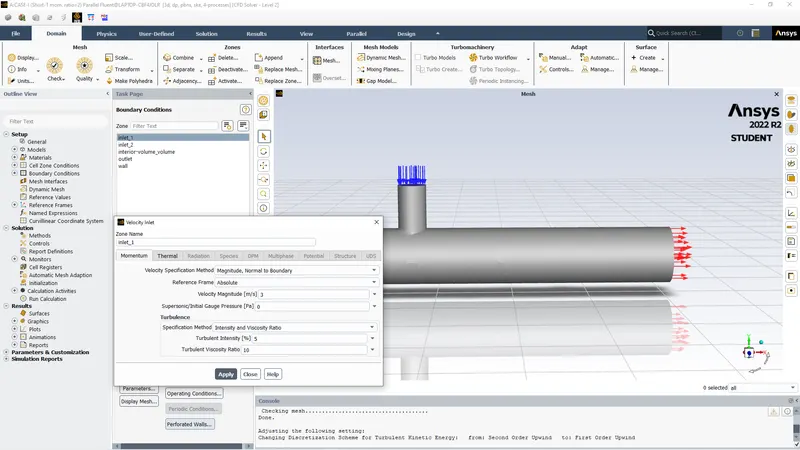
velocity at inlet =3m/s for Momentum ratio =2, Velocity at inlet 2= 6m/s
velocity at inlet =3m/s for momentum ratio =4 ,Velocity at inlet 2= 12m/s.
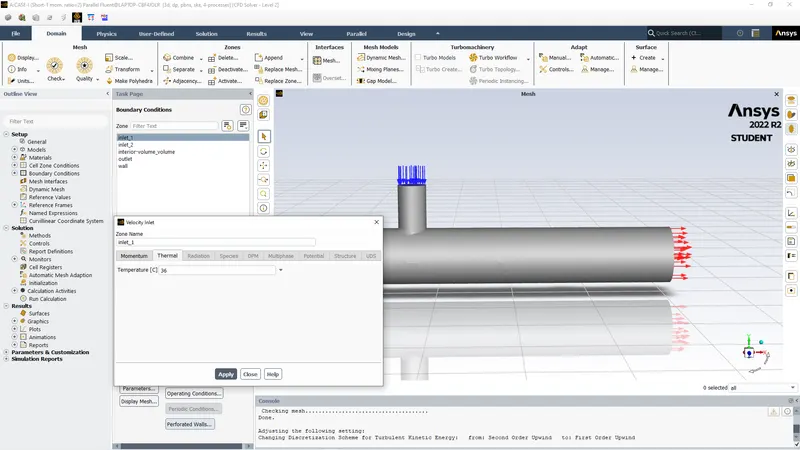
Temperature at inlet 1= 36 C.
Temperature at inlet 2 = 19 C.
PROCEDURE
(1) First we open fluid flow(Fluent )in ansys workbench.

(2) Then we open geometry where the spacclaim will open and import mixing tree geomtery there.
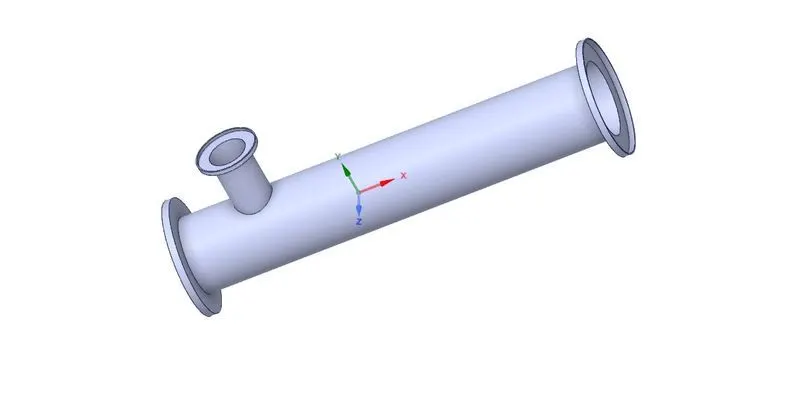
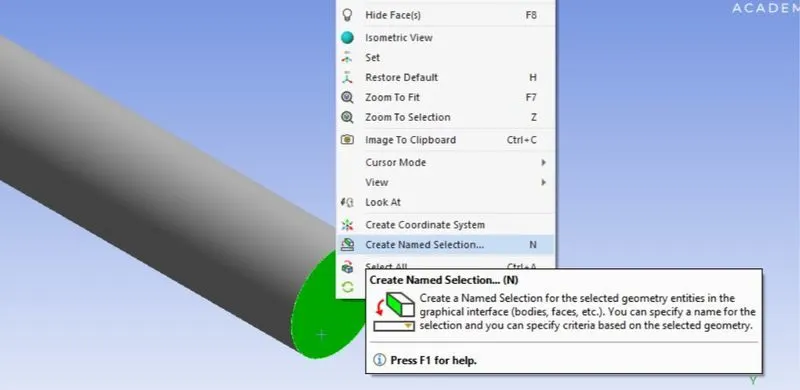
(3) We need to analyse mixing of two fluids. So, we need to extract volume of assign volume by clicking at prepare and select volume we need to analyse.then we assign name for sections so we can assign boundary conditions later.
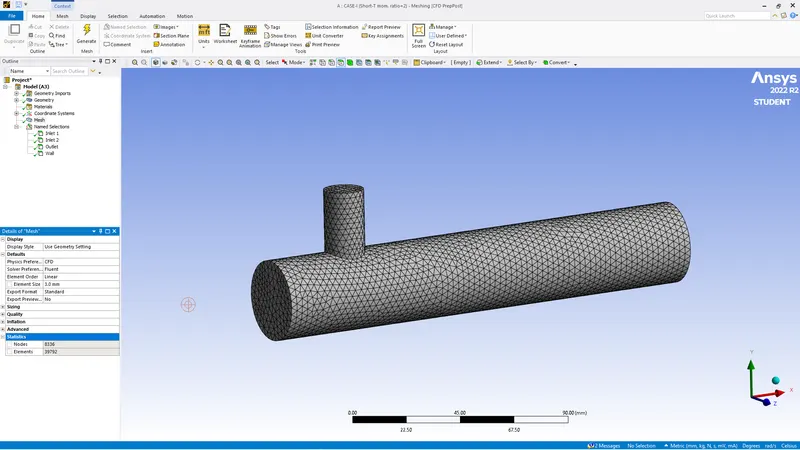
(4) We exit geometry and open mesh where we genrate mesh and assign any element length in this case its 3 mm.
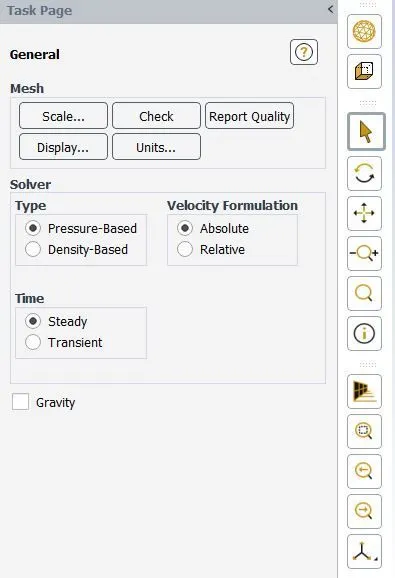
(5) We exit the mesh and open setup after the green tick mark is shown after geometry and mesh which means there is no error. Then we are going to select pressure based options and go to physics for furthur process.
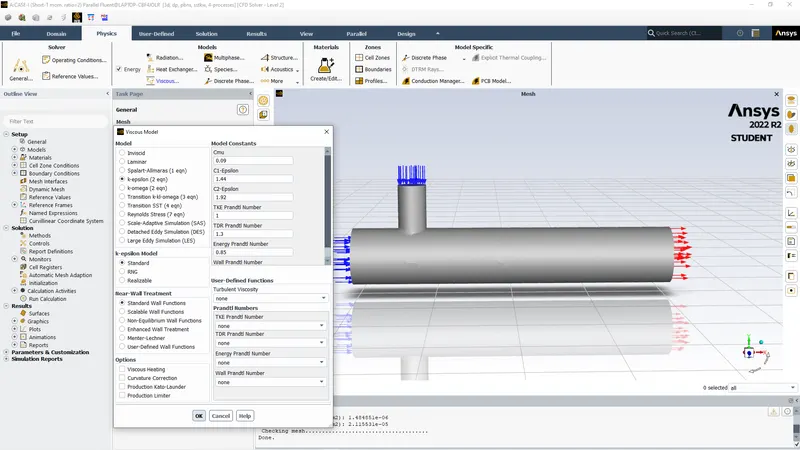
(6) After going to physics menu we select energy model and then choose k -epsillon model and close it.
(7). Then we open the boundary conditions where we assign boundary conditions for inlets (give input temperature and velocity accordingly as mentioned at top).
(8) We want to generate the report for residual , standard deviation and avg temperature for model we go to solution and select defination and select area weighted average. In opened menu select temperature as field variable,similarly for standard deviation.
(9) Then we click at initialize to calculate approximate values of velocity and temperature.
(10) We change no. of iterations to 300 and and calculate iterations will run untill solution is converged .which means there is no deviations for n & n+1 term so nno errors are found.
(11) We exit setup and open results where we insert plane , line to create contours , plot graphs for required data comaprision and study .
Results
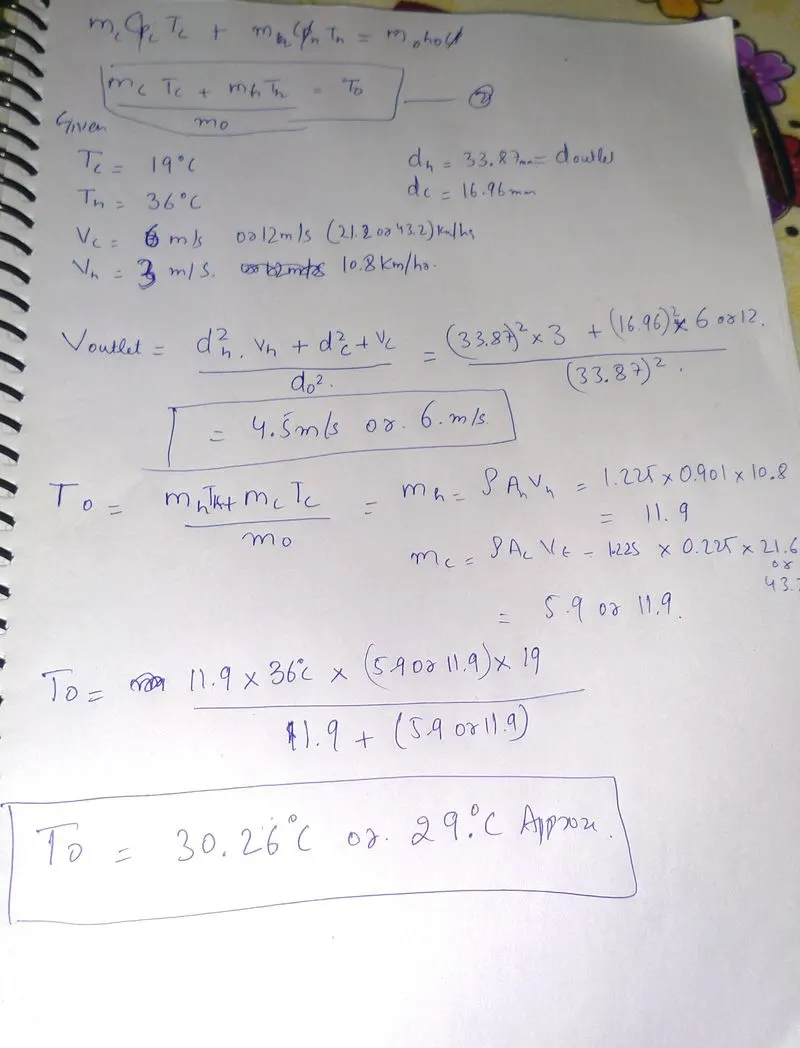
ANALYTICAL RESULTS
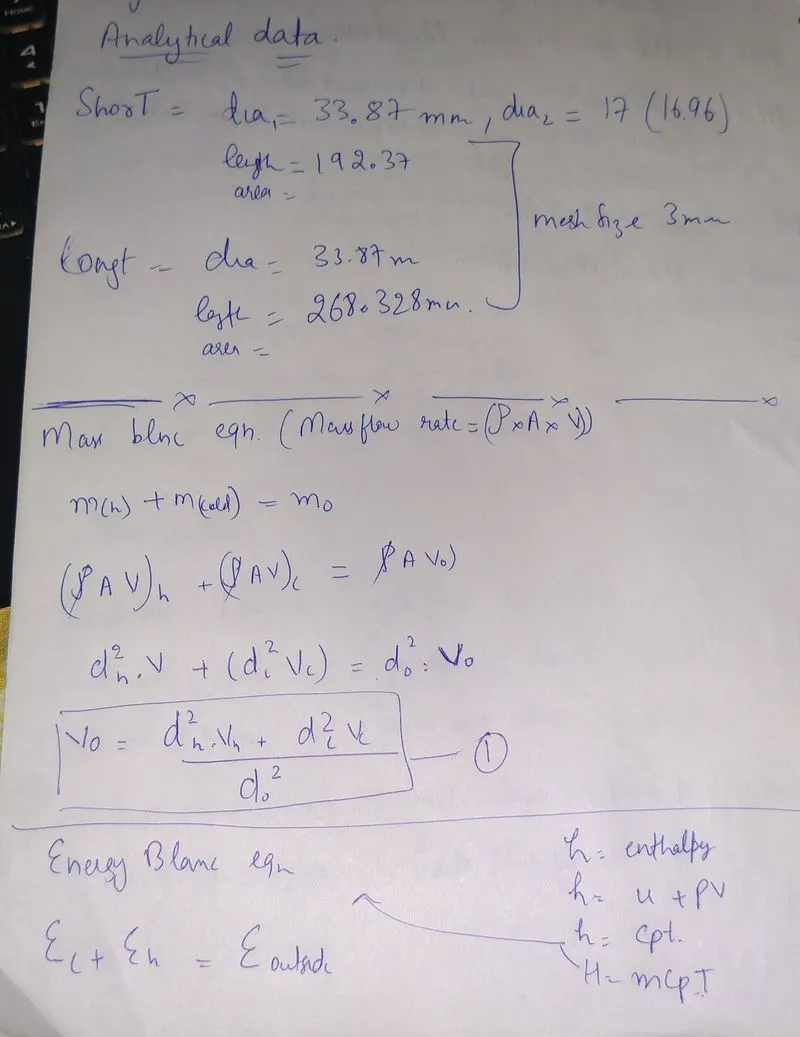
CASE-I
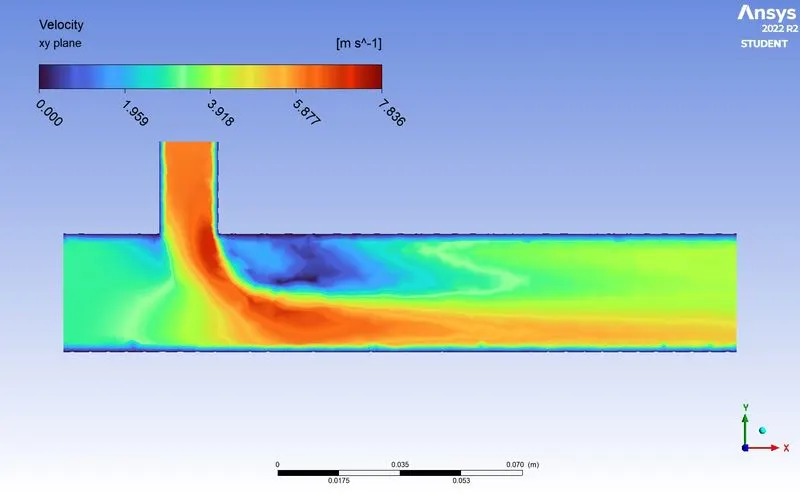
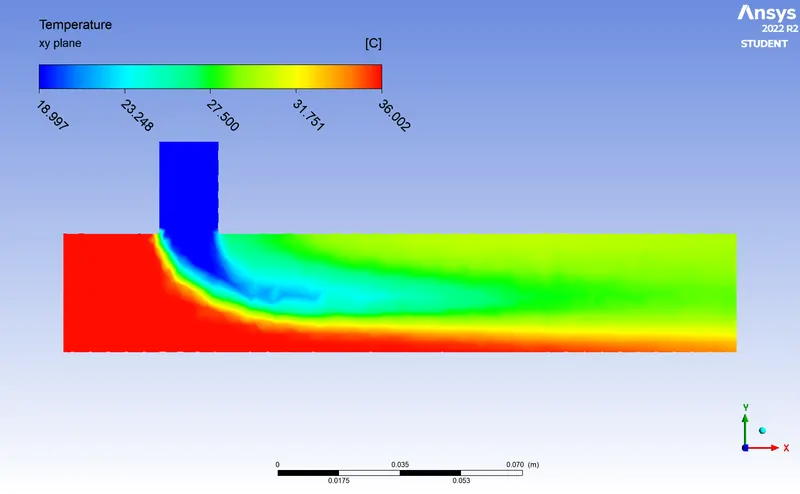
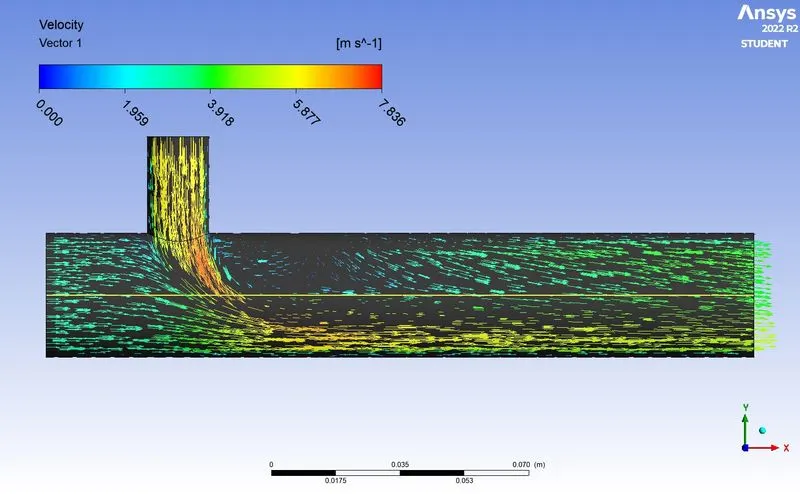
There are 2 inlets with temperature 36C and 19C with velocity 3m/s and 6m/s respectively.length of pipe is 192mm
We proceed with procedure mentioned above and result obtained is as shown
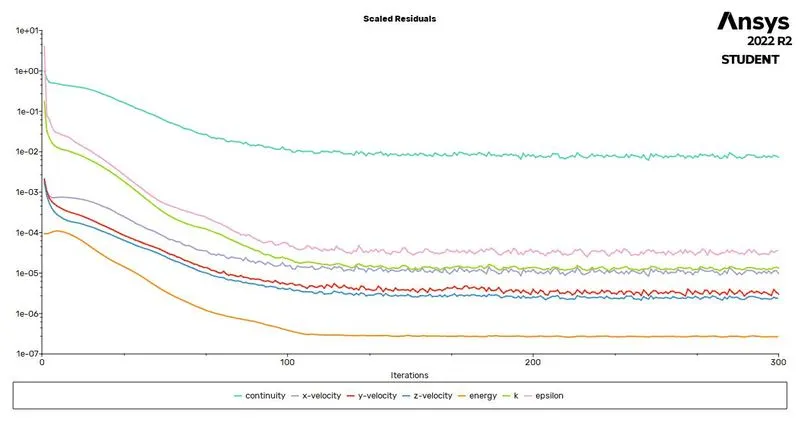
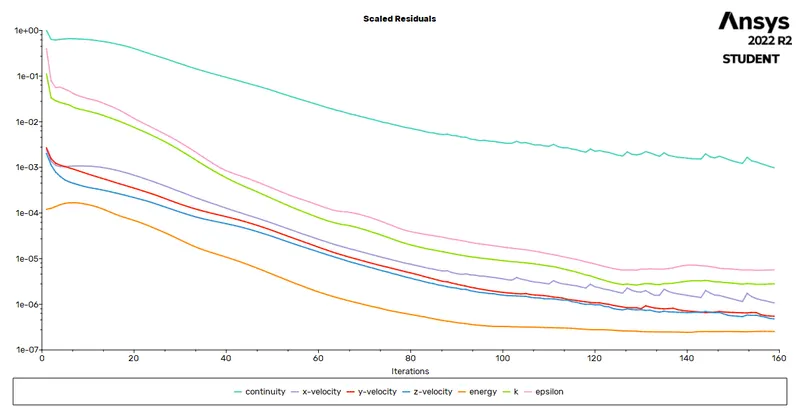
As graph is becoming constant toward end or shown same pattern it means its converged solution.
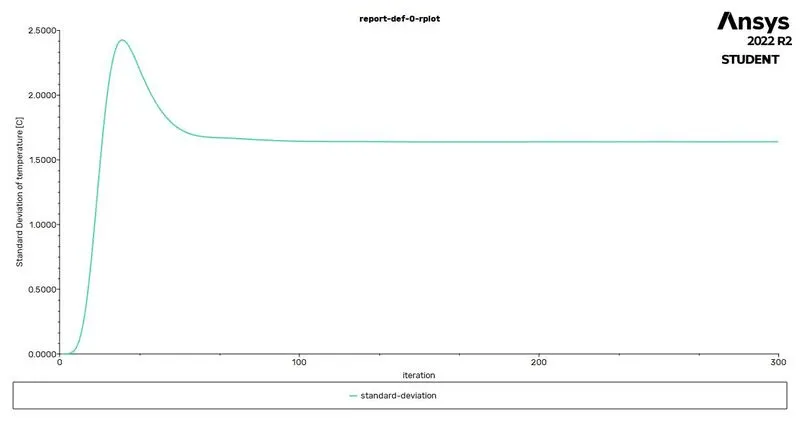
AS we can see the deviation becomes constant after iterations below 100 thats when it got converged.
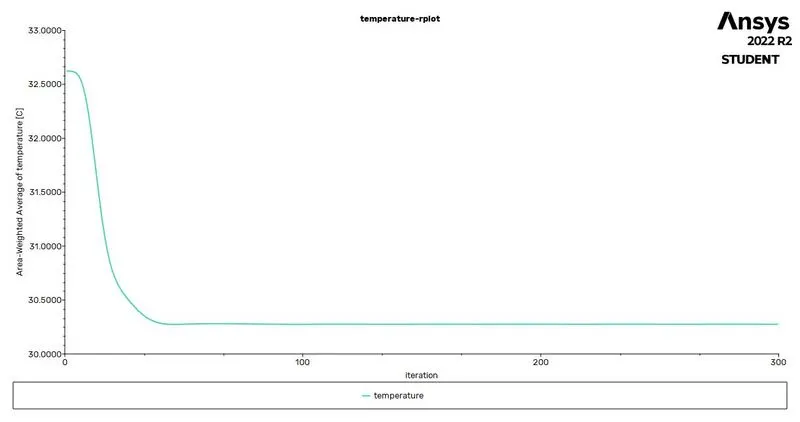
After solution is converged the avg temperature is approx 30 C which is seimilar to what anlalytical result.
CASE-II
There are 2 inlets with temperature 36C and 19C with velocity 3m/s and 12m/s respectively.length of pipe is 192mm
We proceed with procedure mentioned above and result obtained is as shown
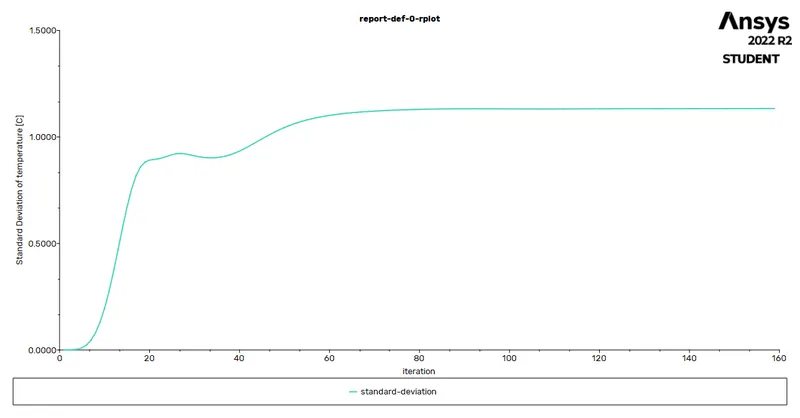
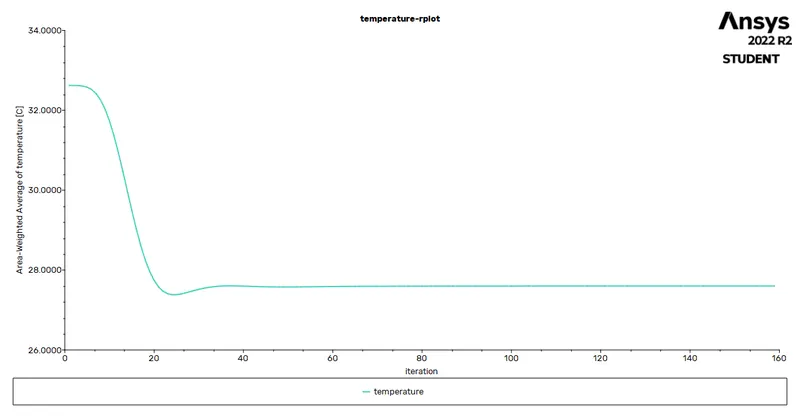
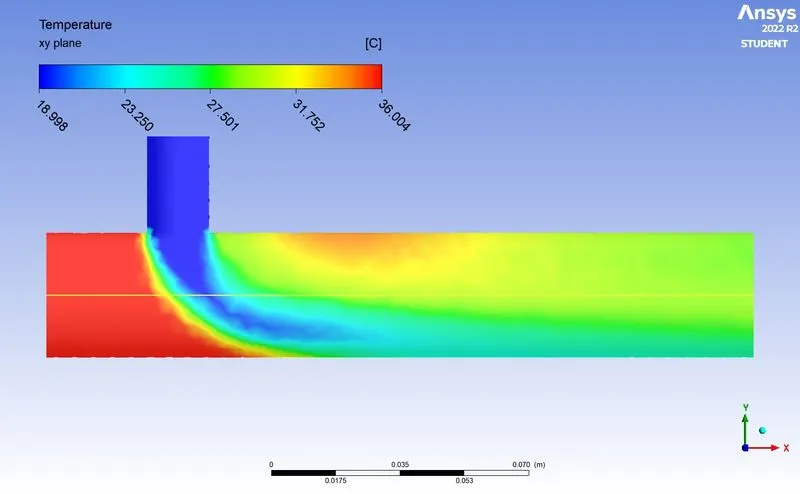
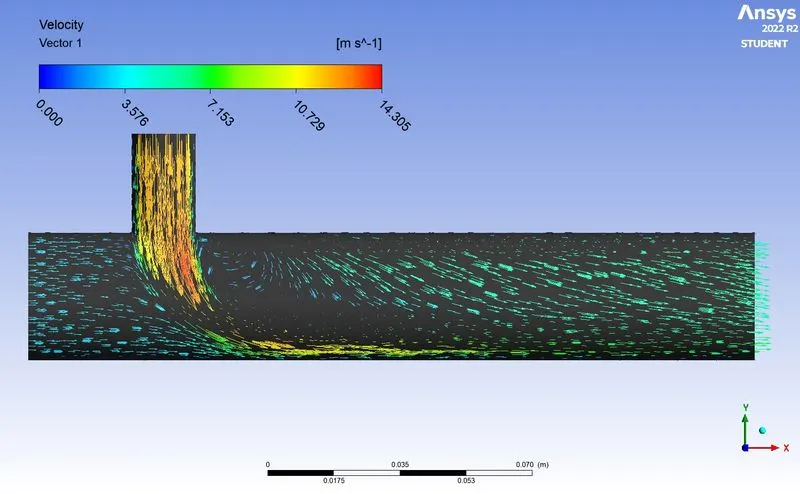
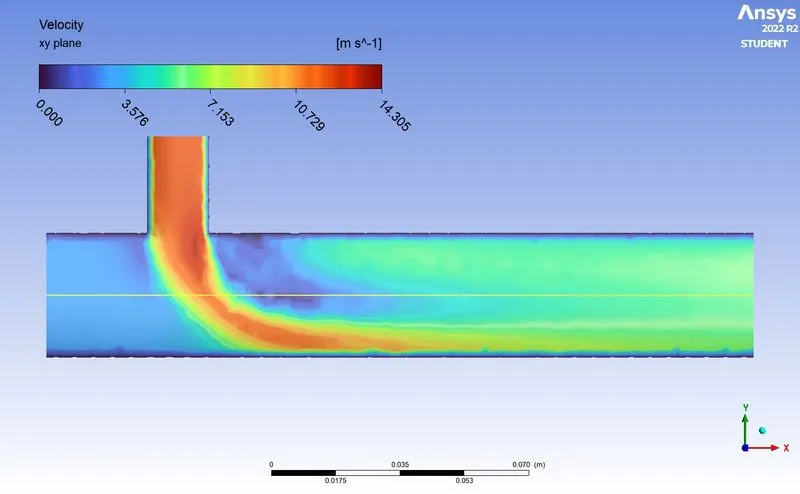
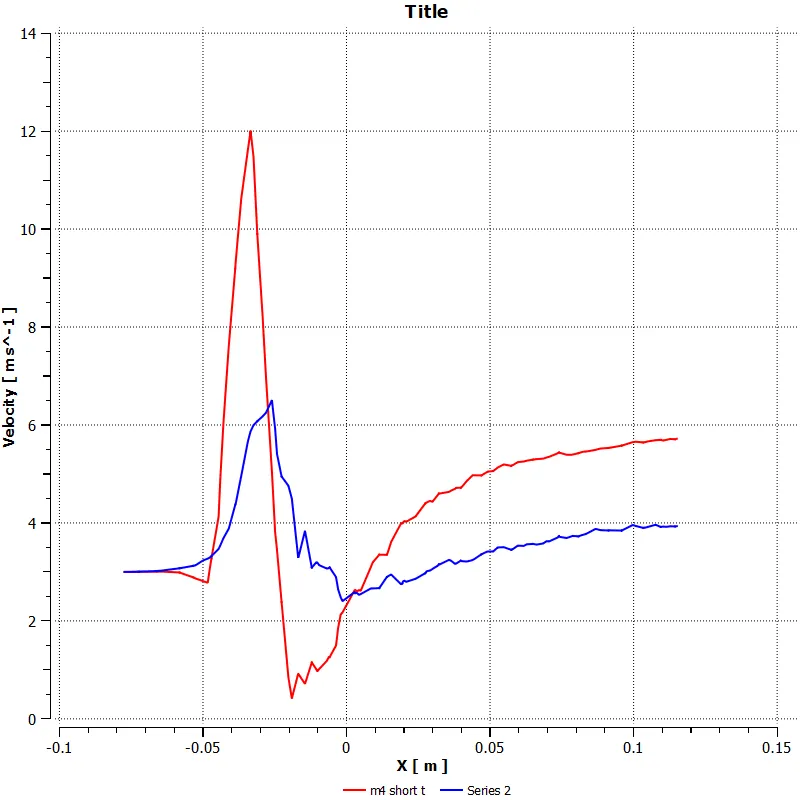
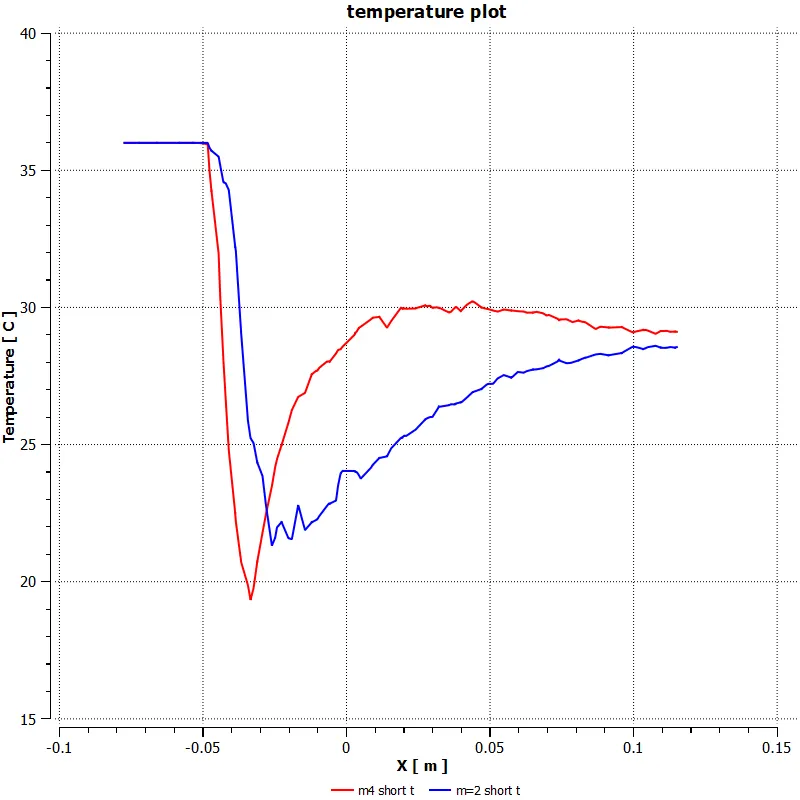
As we can clearly see the deviation at case 2 where velocity is 12 m/s is lesser because due to more higher velocity causing to mix water and temperature and velocity drop suddenly ,then as flow proceed it reaches its avg. temperature and velocity .
CASE-I TAKES 300 ITERATIONS TO CONVERGE & CASE-II TAKES 159 ITERATIONS TO CONVERGE & NO OF ELEMENTS WERE 39000 APROXX.
CASE-III
There are 2 inlets with temperature 36C and 19C with velocity 3m/s and 6m/s respectively. but the length of pipe is 262mm
We proceed with procedure mentioned above and result obtained is as shown.
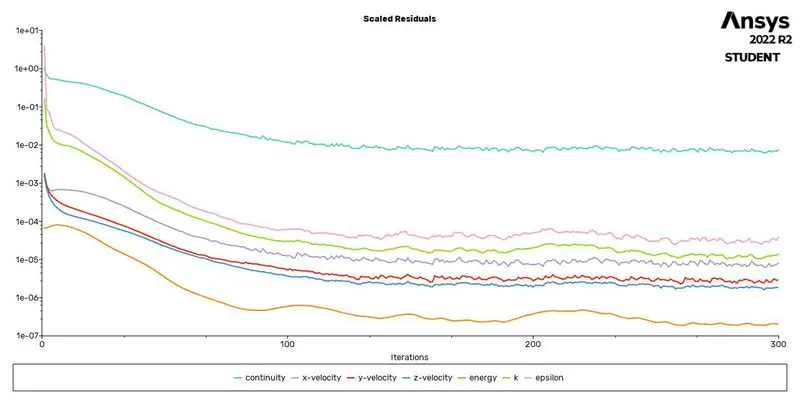
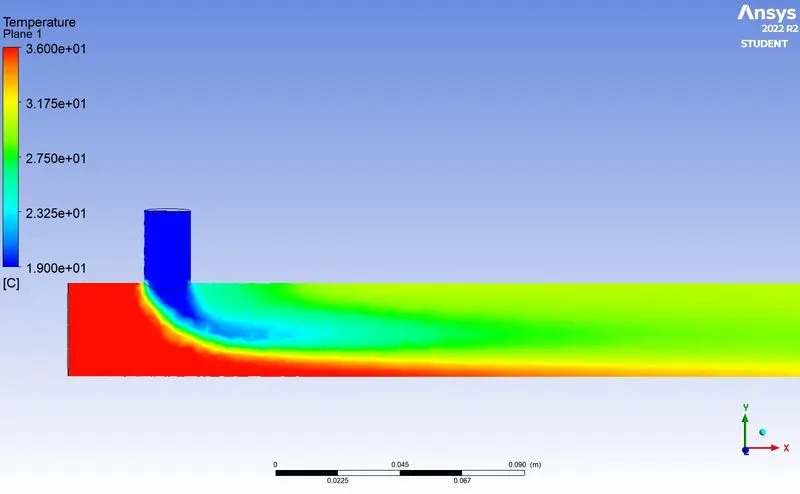
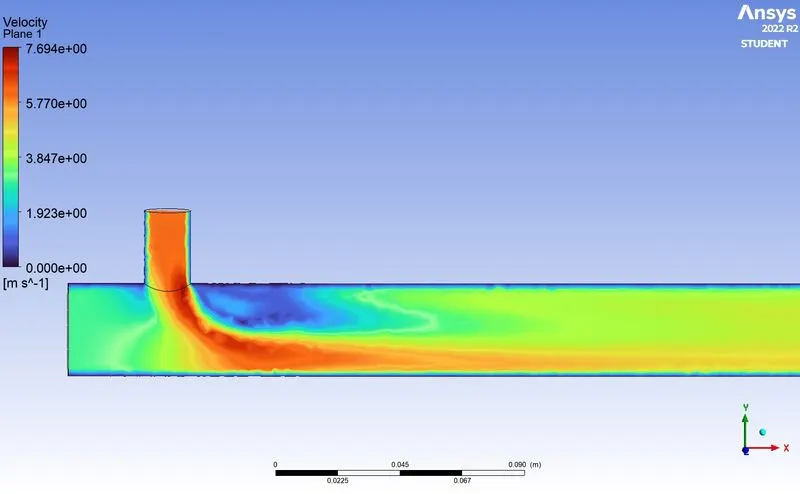
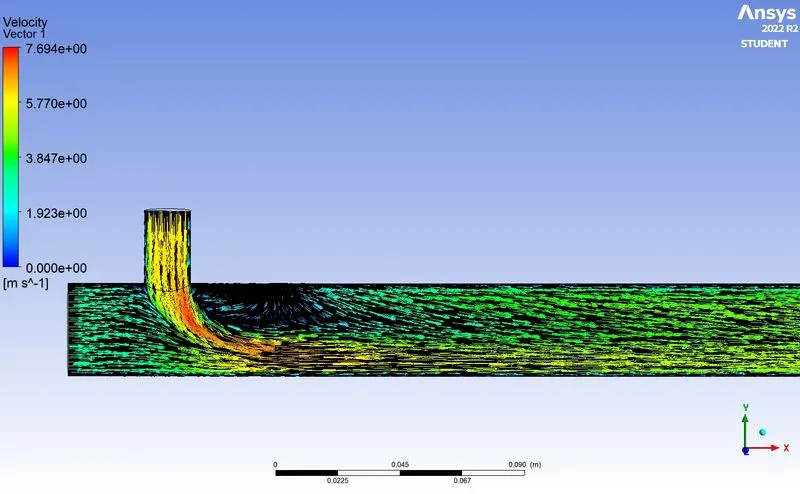
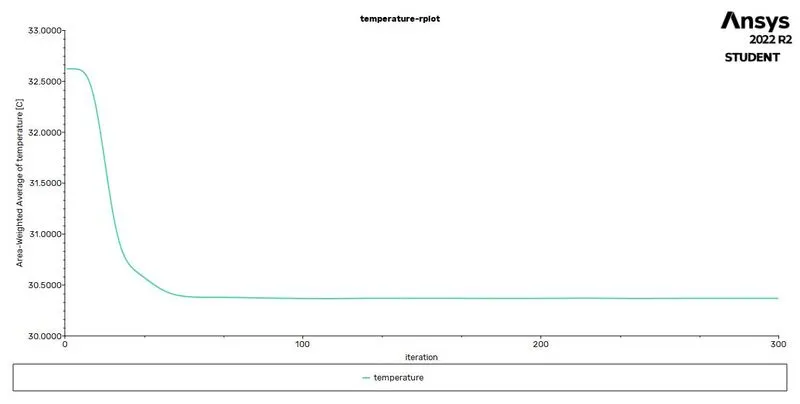
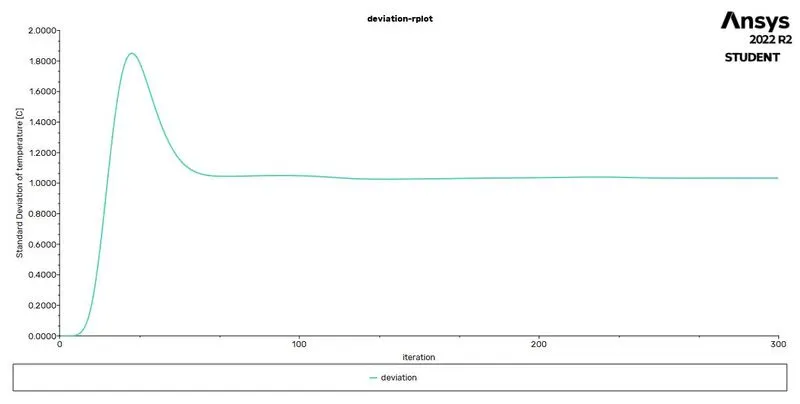
As graph shows no deviation means solution is converged.
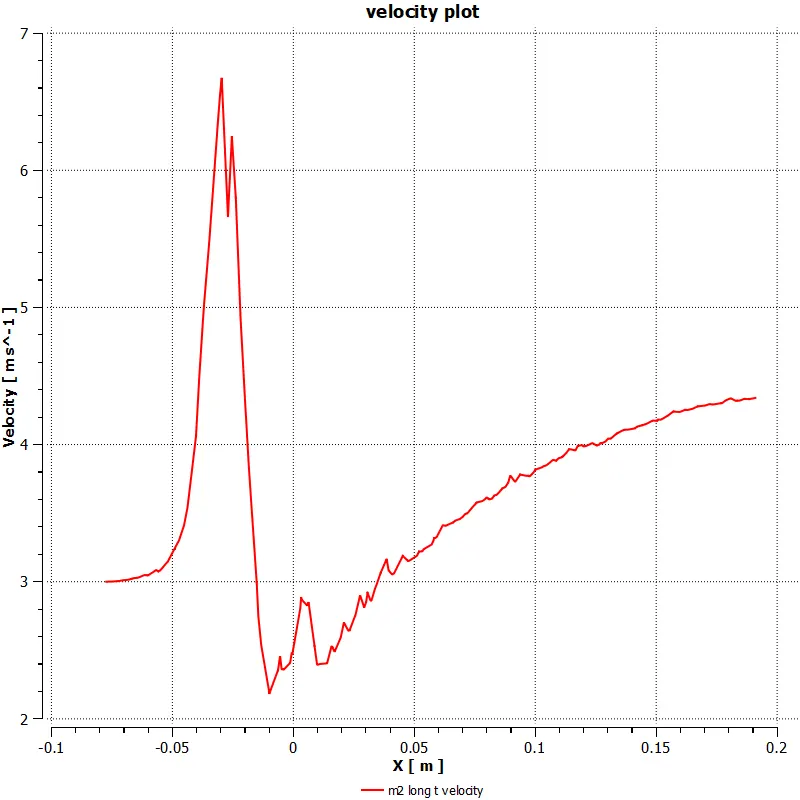
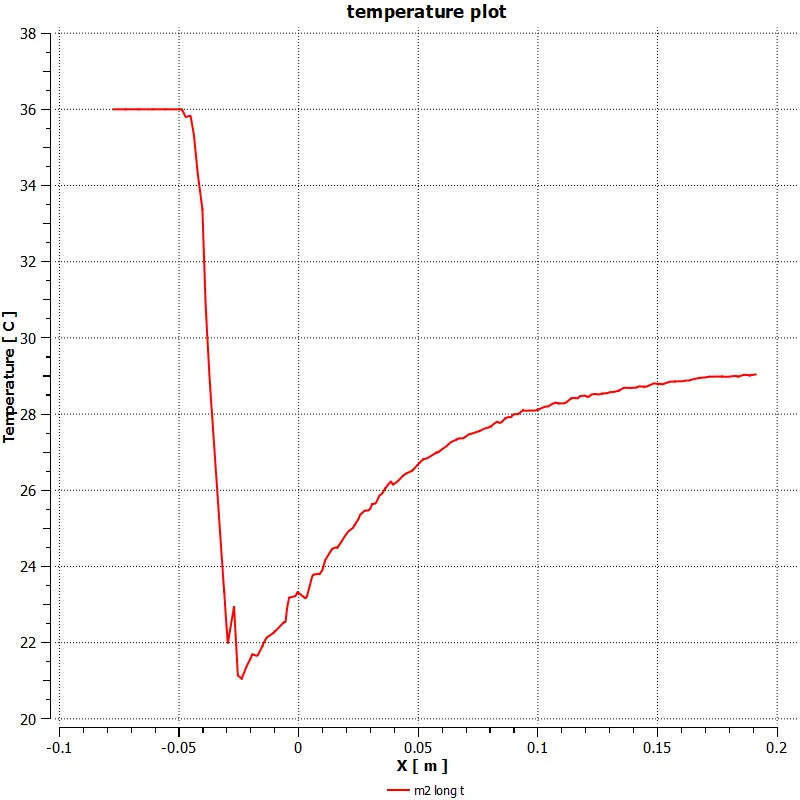
CASE-IV
There are 2 inlets with temperature 36C and 19C with velocity 3m/s and 12m/s respectively. but the length of pipe is 262mm
We proceed with procedure mentioned above and result obtained is as shown
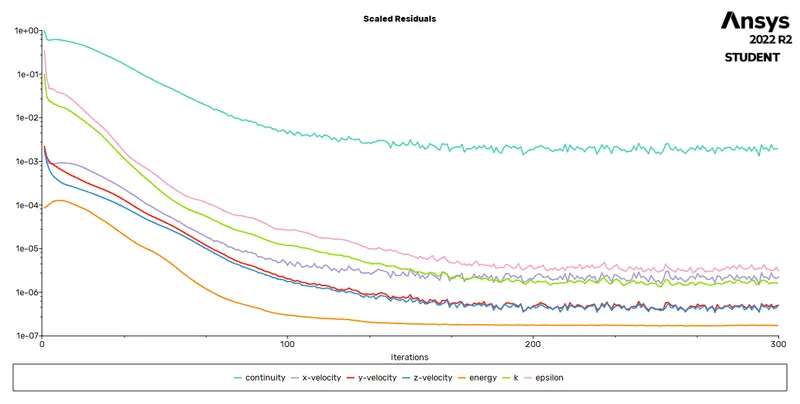
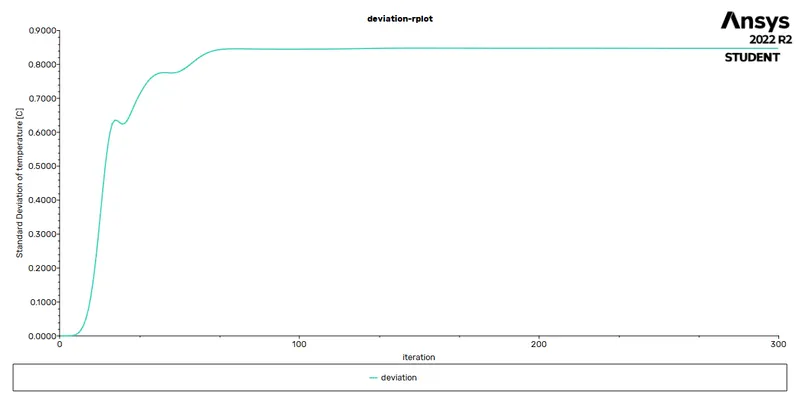
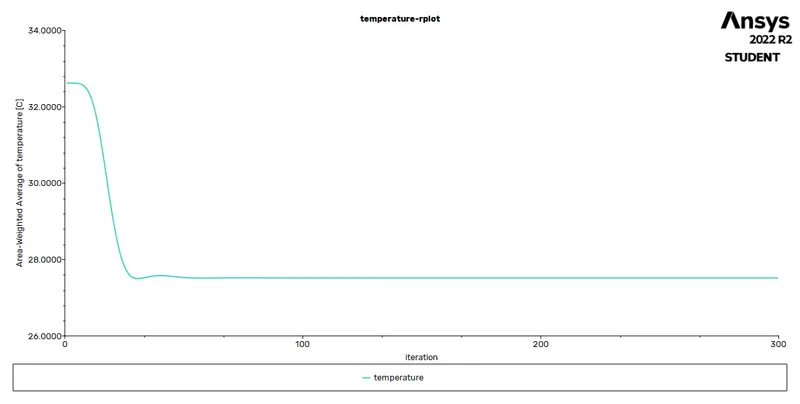
As the data is simlar to analytical data formed above and also the similar pattern in residual means solution is converged.
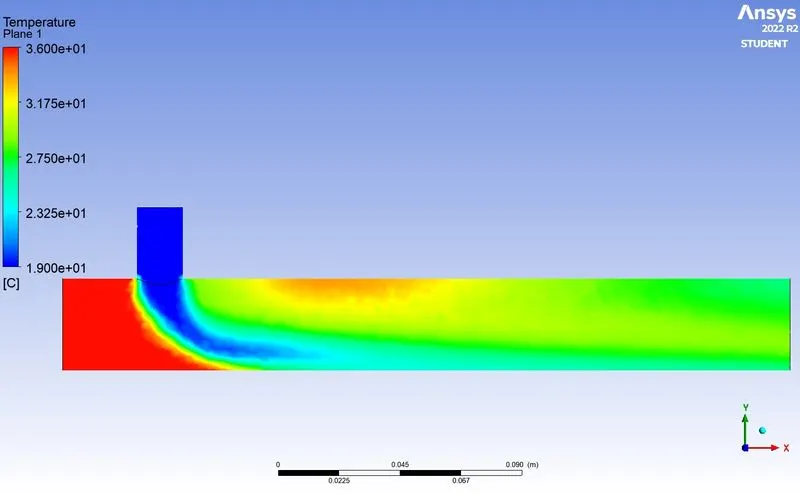
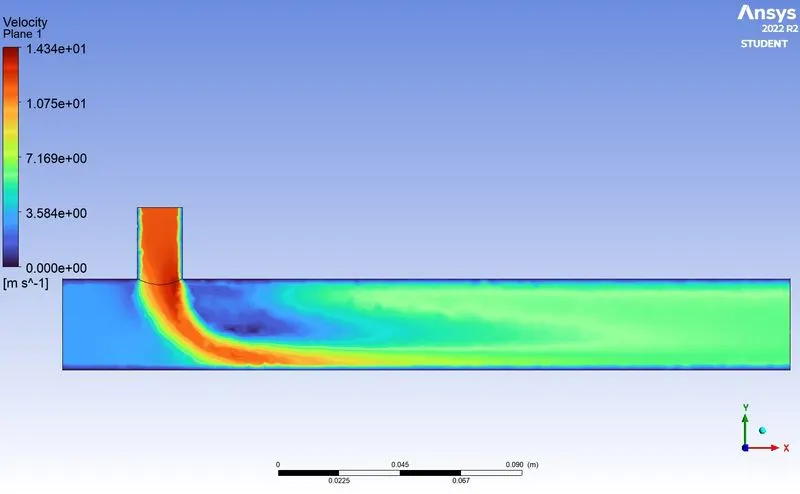
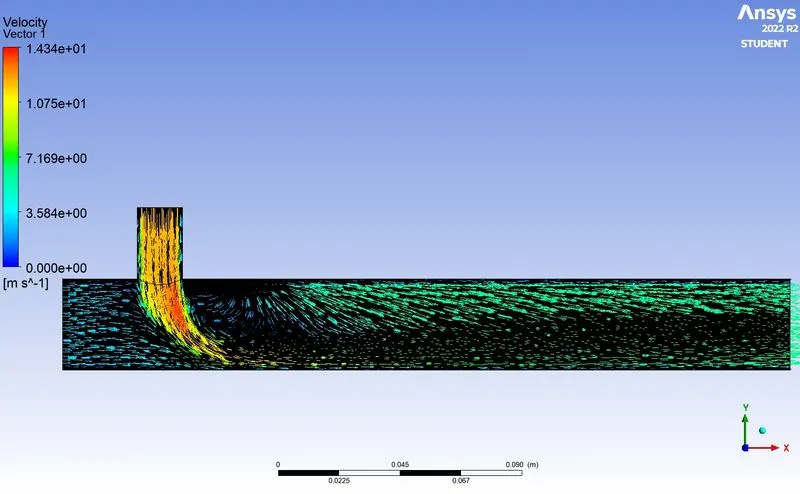
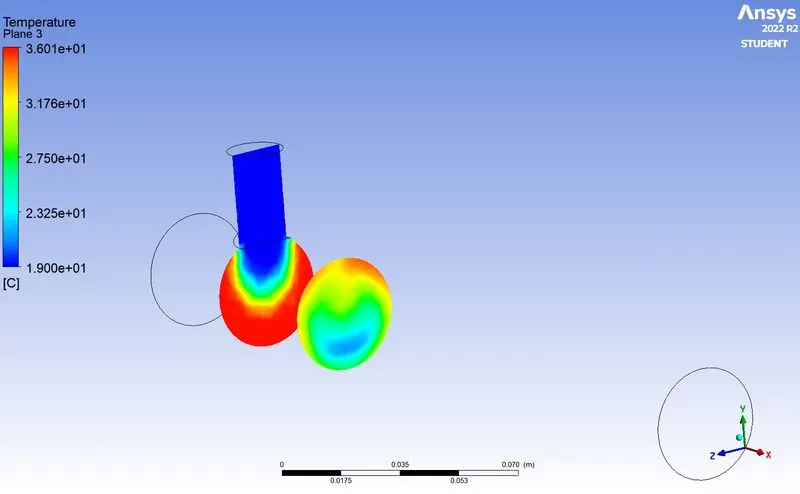
Comparission between Case -3 and case -4 Temperature
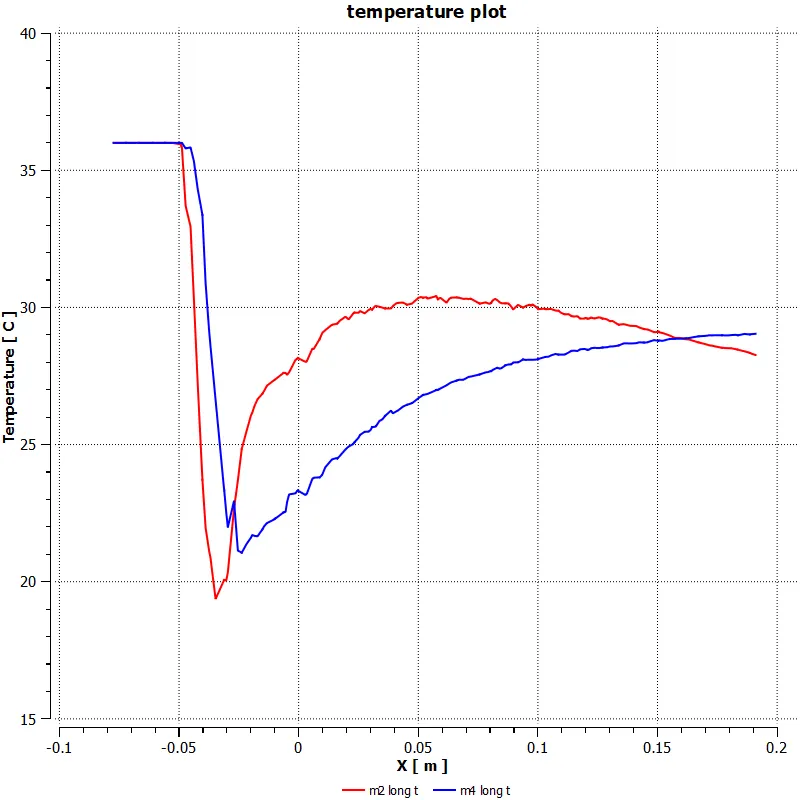
As we can see the outlet temperature is lesses for case 4 this happens due to lagre length of pipe . As larger the pipe the Water will mix and temperture will drop .
CASE 3 AND CASE 4 BOTH CONVERGE AT BETWEEN 250-300 BUT CONVERGENCE CAN BE SEEN OCCURING AT JUST BELOW 100 ITERATIONS.
COMPARISSION BETWEEN SHORT TEE & LONG TEE
for inlet velocity = 3m/s and 6m/s
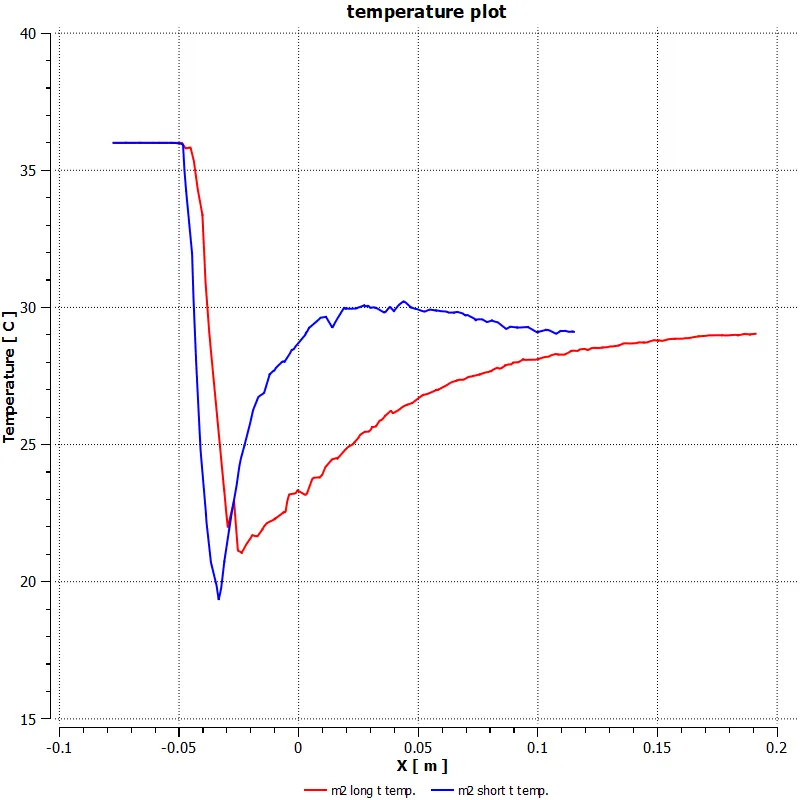
As we can see the drop in temperature for long Tee is steep but the average temperature is almost same .
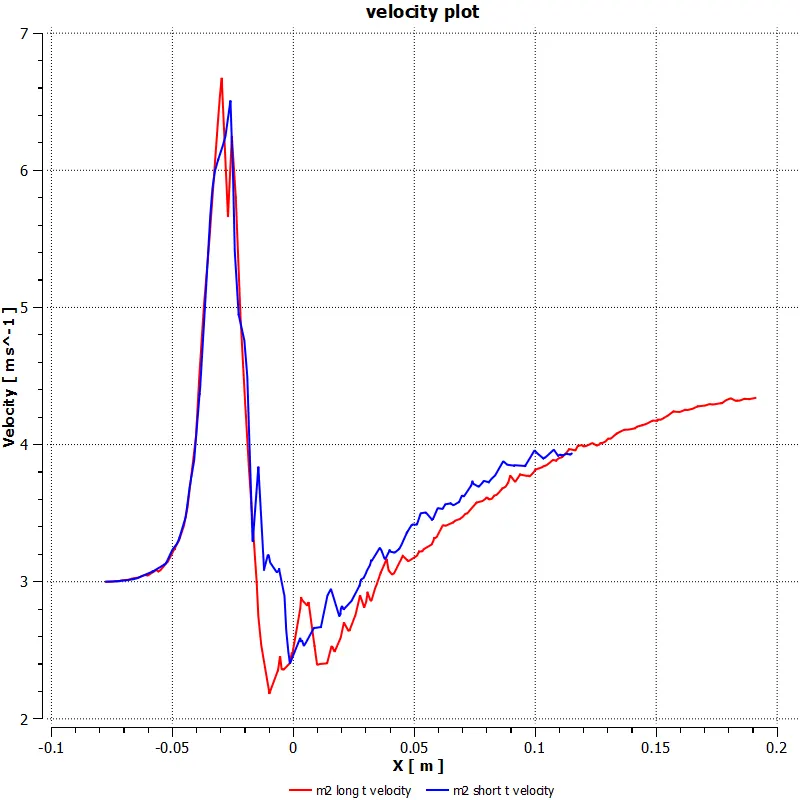
Due to increse in length the velocity at output varies as the mixing area is same due to which no significant changes avn be seen in intial stages only differnece will be at outlet due differnce in pipe length.
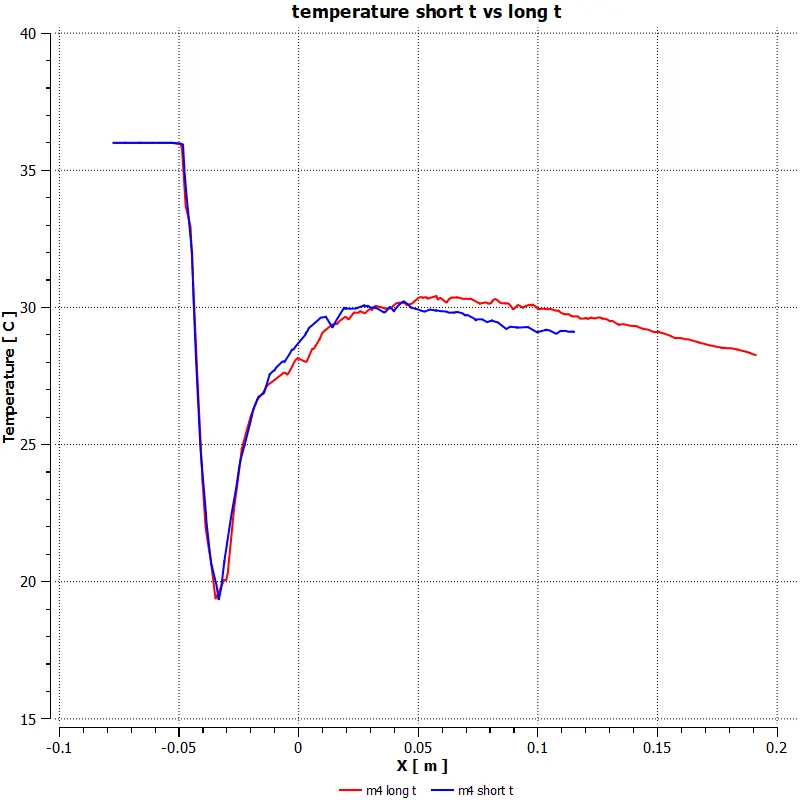
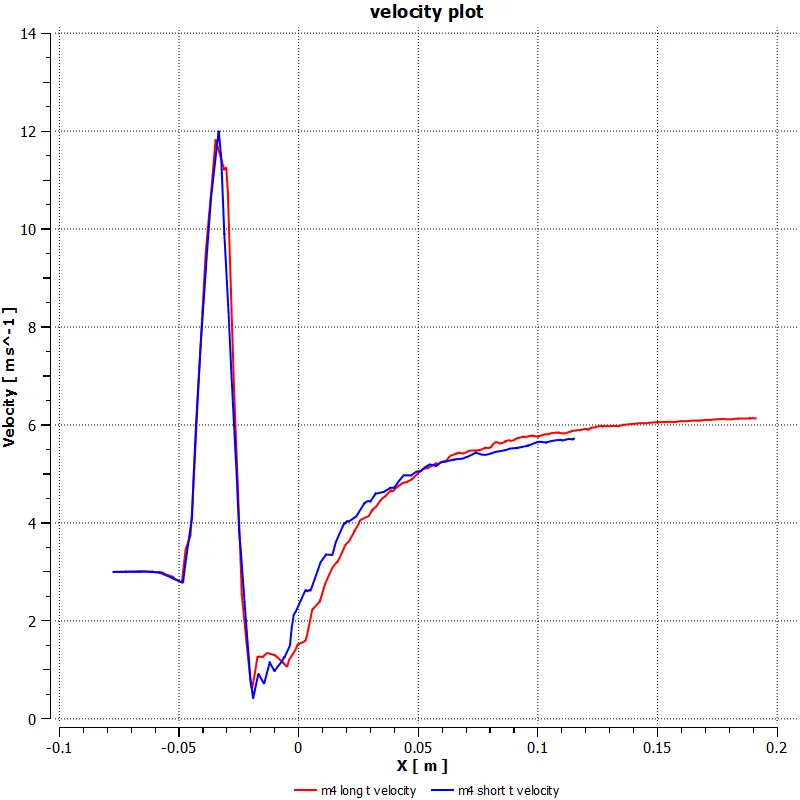
for inlet velocity= 3m/s and 12 m/s
CONCLUSION
- After comparision we can see that the mixing area size remains same so not much differ in that section for long tee & short tee.
- Where as at end due to difference in length pipe the mixing of fluids occur more properly in longer pipe so the velocity is higher at longer pipe and avg. temperature drops just fraction for longer pipe case.
- When velocity at inlet 2 in higher (12m/s) The mixing is more proper and avg tempertaure is lesses than other case.
- Velocity is higher for case where inlet 2 velocity is 12m/s.
Effect of length and momentum ratio on results
- When length of pipe is bigger the avg temperature decreases as fluid mix more properly in longer pipe and velocity inccreases not by larger means just by few fractions due to biger length of pipe.
- Bigger momentum Ratio means higher velocity which causes water to either cooldown or heat up immidieately.Also with higher velocity the avg. velocity at outlet is bound to increase than other case.
Link -https://drive.google.com/file/d/1vuWZU_ujuiiNzuI8fH4FZR5BCi9XV28E/view?usp=sharing