Week 1: Channel flow simulation using CONVERGE CFD
Objective of the project : Objective of this project is to setup case for multiple simulations using varying mesh sizes and plot various pressure, velocity and mass flow rate graphs. For this three different mesh sizes are given, accordingly we have to run the simulations for each mesh size and plot the respective graphs.
Mesh sizes given:
1] first case:
dx = 1e-4 m ; dy = 1e-4 m ; dz = 1e-4 m
2] second case:
dx = 1.5e-4 m; dy = 1.5e-4 m; dz = 1.5e-4 m
3] third case:
dx = 2.0e-4 m; dy = 2.0e-4 m; dz = 2.e-4m
Geometry used for simulation:
a geometry depicting rectangular channel is created and is used for simulation; shown below-
dimension of channel geometry:
in x-direction :- 0.1 metres
in Y-direction :- 0.01 metres
in Z-direction :- 0.01 metres
Case Setup:
1] Type of application:
-General flow
2] Type of materials:
- AIR
3] Solver type:
- Steady flow solver
4] Pressures: a) initial- 100001 Pa
b) final -100000 Pa
5] Number of cycles:
15000
6] Boundary Conditions:
at inlet- P=100001 Pa; T=300K
at outlet- P=100000 Pa; T=300K
Top and Bottom- No slip condition
Front and Back- 2D 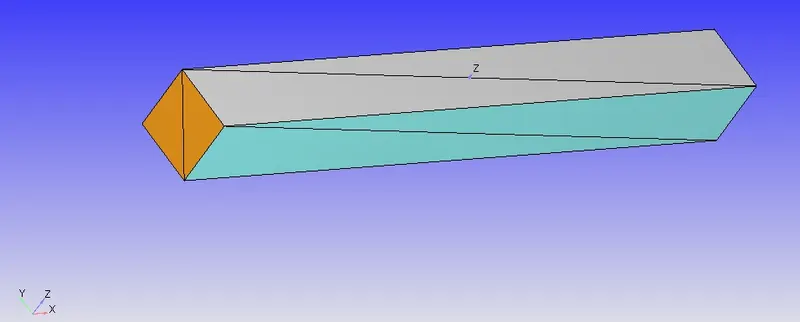
CASE1: dx=1e-4 ; dy=1e-4 ; dz=1e-4
mesh formed:
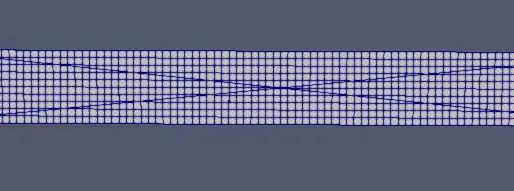
total cell count: 1,00,000
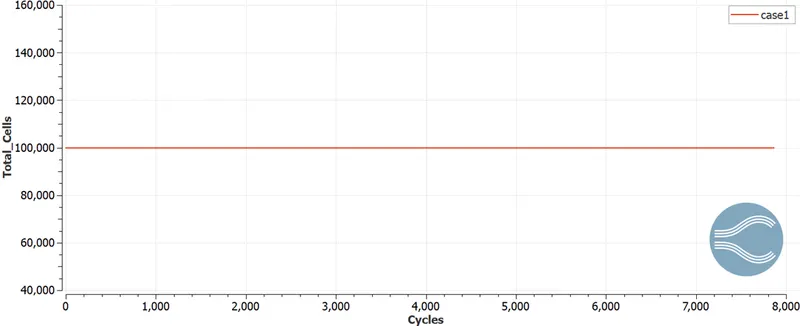
From the about plot it can be observed that as the base grid is decreased total cell count increases.
Pressure at inlet:
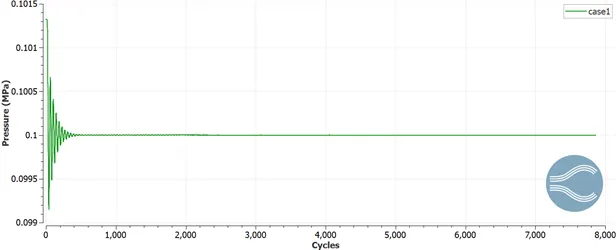
Total Pressure at inlet and outlet:
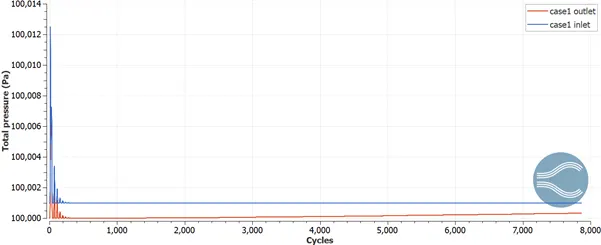
Initially with some fluctuations, after some cycles total pressure curve remained constant.
Average velocity at inlet and outlet:
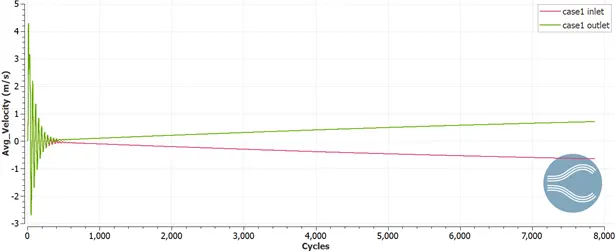
Velocity is observed to be fluctuating initially, with later on the intensity of fluctuations being reduced. After some time the velocity is observed to be increasing or decreasing constantly.
Mean temperature at :
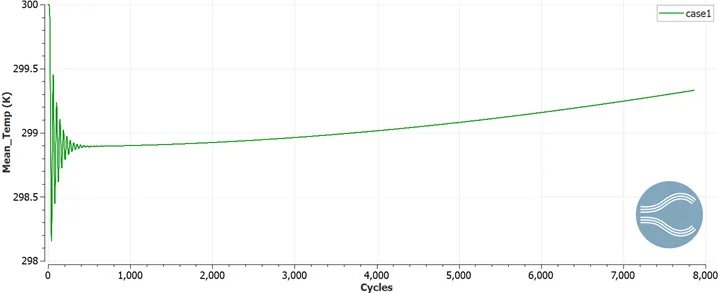
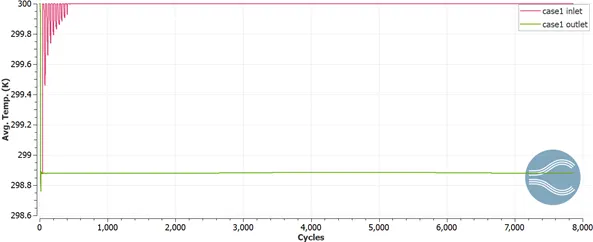
Avg. temperature at inlet and outlet:
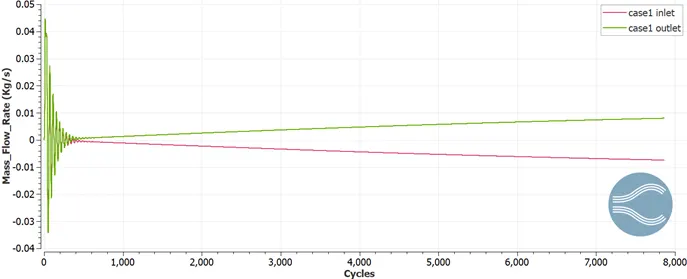
Mass flow rate at inlet and outlet:
CASE 2: dx=1.5e-4 ; dy=1.5e-4 ; dz=1.5e-4
Mesh Formed:
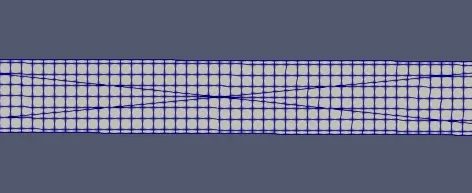
Total cell count: 46,000
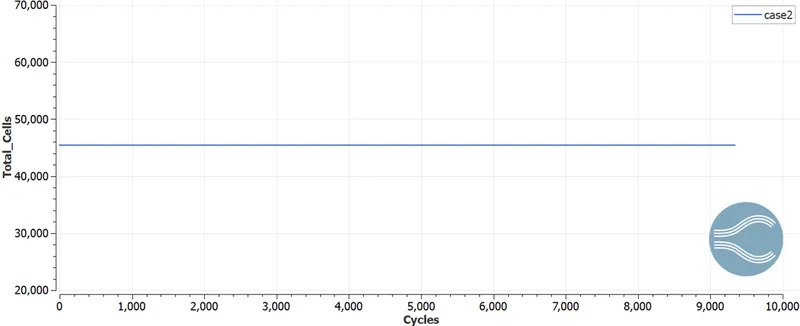
From the about plot it can be observed that as the base grid is decreased total cell count increases.
Pressure at inlet:
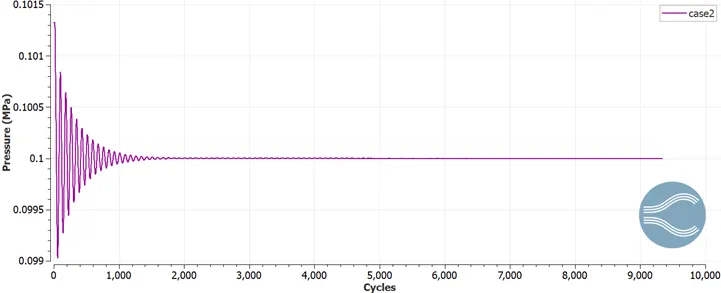
Total pressure at inlet and oulet:
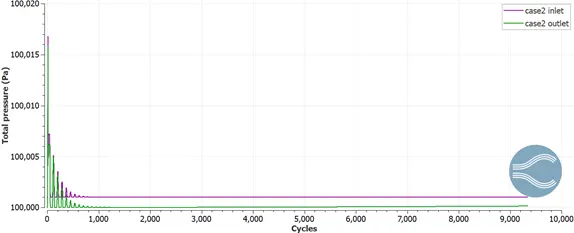
Initially with some fluctuations, after some cycles total pressure curve remained constant.
Average velocity at inlet and outlet:
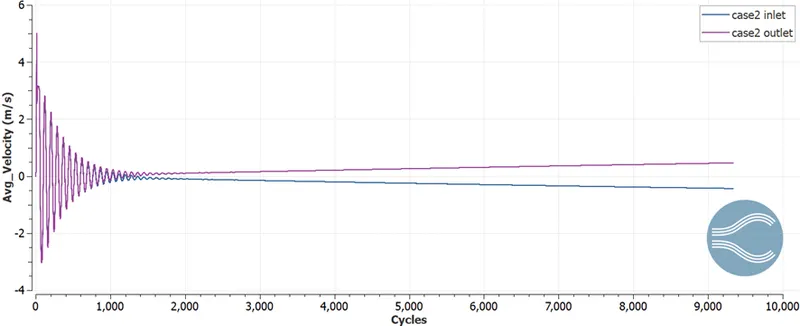 Velocity is observed to be fluctuating initially, with later on the intensity of fluctuations being reduced. After some time the velocity is observed to be increasing or decreasing constantly.
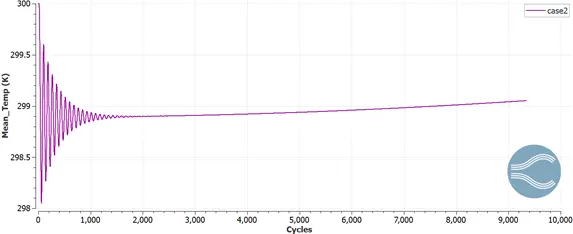
Mean temperature:
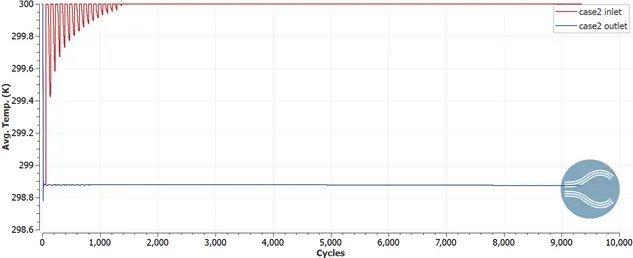
Average temperature at inlet and outlet:
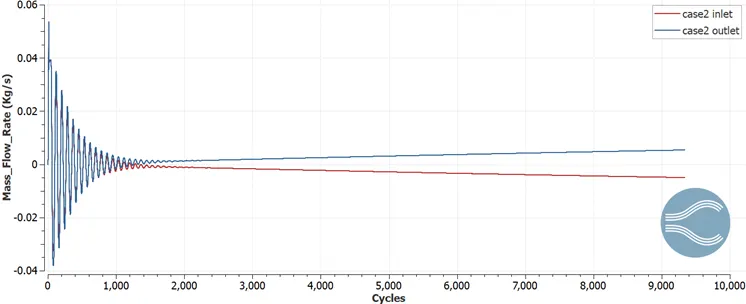
Mass flow rate at inlet and outlet:
CASE 3: dx=2e-4 ; dy=2e-4 ; dz=2e-4
Mesh formed:
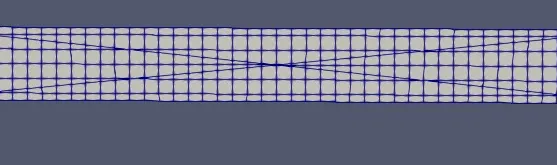
Total cell count:25,000
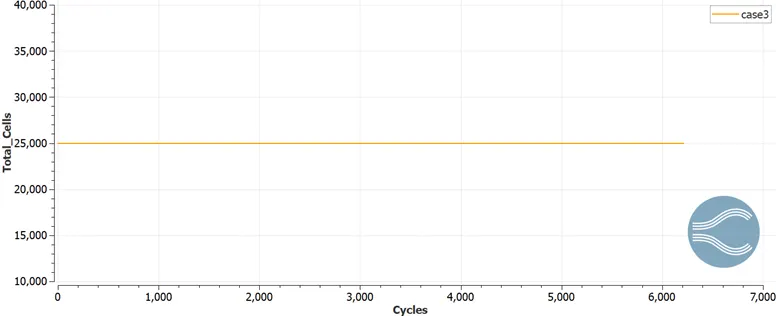
From the about plot it can be observed that as the base grid is decreased total cell count increases.
Pressure:
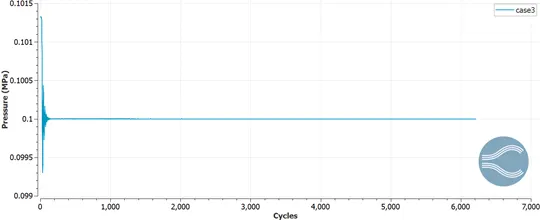
Total Pressure at inlet and outlet:
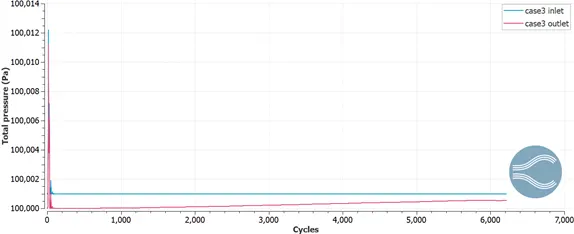
Initially with some fluctuations, after some cycles total pressure curve remained constant.
Average velocity at inlet and outlet:
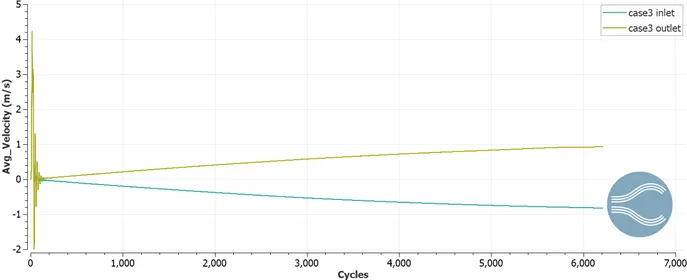
Velocity is observed to be fluctuating initially, with later on the intensity of fluctuations being reduced. After some time the velocity is observed to be increasing or decreasing constantly.
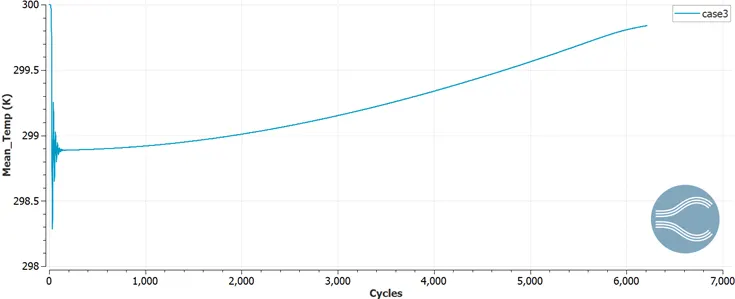
Mean temperature:
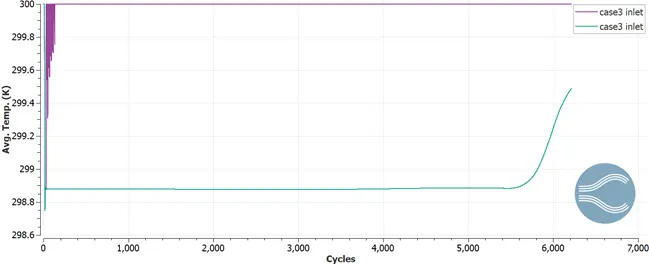
Avg. temperature at inlet and outlet:
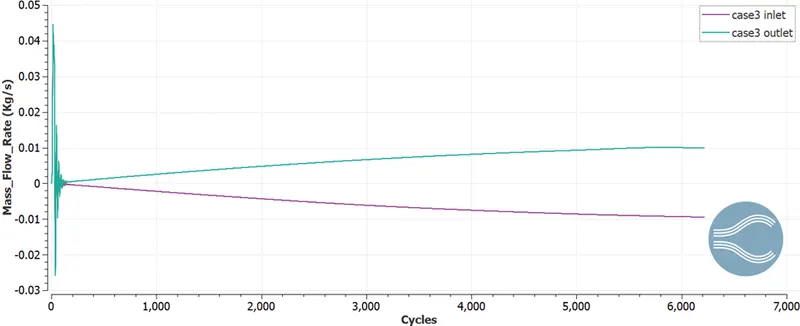
Mass flow rate at inlet and outlet:
CONCLUSIONS:
The channel flow simulation is performed using convergecfd. Different cases with different grid sizes were run and results were analyzed. Various plots and profiles were generated to have a clear understanding of the physics captured.