WashingMachine & Gear Shift using Stateflow Simulink
AIM:
- To implement control logic of a “washing machine” using Stateflow as per given sequence
- If the power supply is available the system gets activated
- If the water supply is not available, stop the process & indicate through LED
- Soaking time should be 200s followed by Washing time of 100s
- Then rinsing happens for the next 20s & dryer runs for 50s
- After all the processes have completed turn on the finished LED
- Make Simulink chart for the “Gear Shift” logic as per the below conditions
Speed Range(kmph) Gear
0 to 15 1
16 to 25 2
26 to 40 3
41 to 60 4
Above 61 5
Speed input should be given while the simulation is running & display the gear number.
Description of Washing Machine Stateflow model:
Stateflow: Stateflow is an interactive graphical design tool that works with the Simulink model and simulates event-driven systems. These Event-driven systems will have a transition from one operating mode to another with the given events and conditions. They can be modeled as finite state machines whose operating modes are represented as states.
To build a state machine model we need to create a Simulink model. The state flow chart is created using the Simulink browser by selecting Stateflow and chart.
According to Mathworks, developing a Stateflow chart can be divided into seven steps
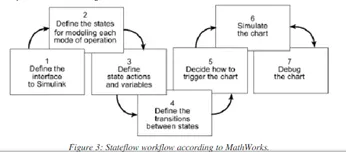
Step1: Defining the interface to Simulink:
First, we should define the Stateflow chart which is connected to the other parts of the Simulink model. We need to define the inputs required from Simulink and the outputs that the chart should produce. We then connect these inputs and outputs to the signals in the Simulink model. Here, power supply, p and water supply, s are taken as inputs and the outputs are Power, Water, Soak, Washing, Rinse, Dryer and Finish.
Step2: Defining the states, types if states and structuring.: Stateflow allows defining hierarchical states which is a powerful technique in which certains states are grouped together and where events “common” to all the group states only have to be defined.
Step3: Defining state actions and variables. We need to define the action to be taken by the state while entering and also exiting or while a state is active i.e., during a state. Variables can be defined for transition just as in programming, they can be temporary and persistent.
Step4: Defining transitions between states. Transitions create paths for the logic flow of a system from one state to another. When a transition is taken from state A to state B, state A becomes inactive and state B becomes active. Transitions have direction and are represented in Stateflow charts by lines with arrowheads. There must add a transition for each of between two states.
Step5: Triggering a Stateflow chart. Simulink can wake up a Stateflow chart by sampling the chart at a specified or inherited rate, by using a signal as a trigger, or by using one Stateflow chart to drive the activity of another.
Step6: simulating the chart. Stateflow can also do simulation as in Simulink but the difference is that here we use Stateflow debugger which is a very useful tool. This debugger allows setting breakpoints to step through the execution of the Stateflow chart.
Simulink Stateflow Model for a Washing machine:
Stateflow Objects Used :
- Chart
- Slider Switch
- Lamp
- Display
- Constant block
Stateflow Chart:
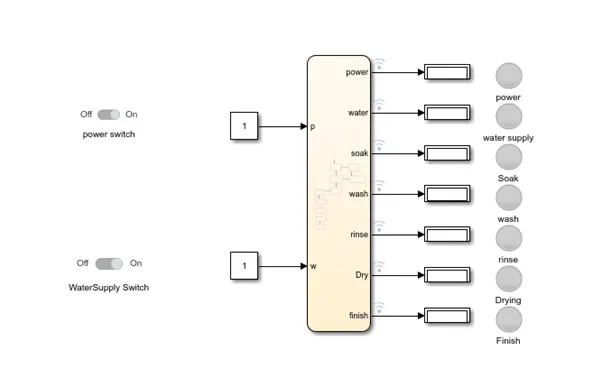
The Stateflow chart exists as a block in a Simulink model. It receives and sends data via ports, just like other Simulink blocks. We can connect the output of a Stateflow chart to a scope block to visualize the output signals.
Drag and drop chart block which will be available in Simulink library browser takes to Stateflow environment. Like Simulink, Stateflow also a graphical programming language that allows to quickly create a runnable model of the system.
From the object palette, drag and drop the state icon to add a new state to the chart where states have valid names. State icons are named with the event name. The events we have taken for washing machines are power, supply, soaking, washing1, rinsing, drying, and finish, and states are named with event names. All the required event-driven states are available in the chart.
We take input variables as p, power, and w, water, and output variables as power, water, soak, wash, rinse, dry, and finish. These variables are seen in the symbols pane are used in the chart are referred as chart data and they must have a specified scope. This data scope creates ports on the Stateflow block.
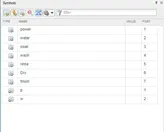
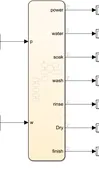
Symbols pane Input and Output ports
State Actions: State action defines what Stateflow does when a particular state is active.
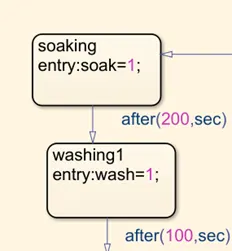
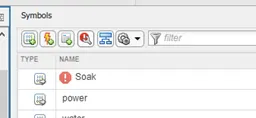
In order to execute the event soaking, washing and so on we need to write a Matlab code under the keyword ‘entry’ in each state like entry: soak=1; and to end the event in that particular state we should specify exit: soak=0; under the keyword exit. Then transition transfers the operating mode to next state. We need to click on Resolve undefined symbols to accept the suggestion to scope this as Local data. The three most common state actions are entry, during and exit. The behavior of these state actions are entering a state, when remaining in a state and when leaving a state respectively.
Resolve undefined symbols
Condition Action: It defines what Stateflow does when the transition condition is true.
Stateflow performs actions associated with transition conditions.
Now we should give the transition conditions between the states. Stateflow automatically adds a default transition when a state is added to the chart which specifies the initial state. Stateflow supports temporal logic conditions, after(N, sec) that are based on elapsed time. Elapsed time given for soaking is 200s followed by washing time of 100s then rinsing for next 20s and dryer for 50 s.

Default transition
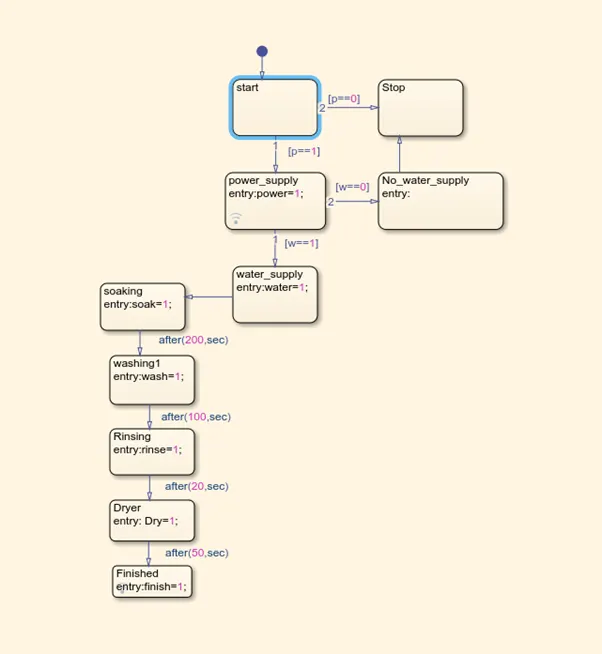
Simulink Model Description:
The Stateflow model exists as a block in the Simulink window. Input ports and output ports are added automatically from the Stateflow program. Two constant blocks are connected to the input ports power and water supply. The input values are generated by connecting a slider switch that has ON and OFF conditions. ON condition provides value=1 and OFF condition provides value=0. Display blocks are connected to each output port to display values. Run the model. If the event is executed means display block shows value one and LED is connected to the signals displays GREEN color. If the display block shows value zero reflects RED color in the corresponding LED Lamp.
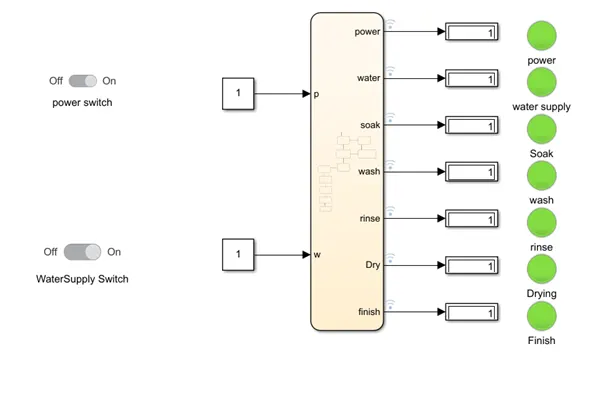
Stateflow chart showing all processes have completed reflects the LED lamp changing to GREEN color.
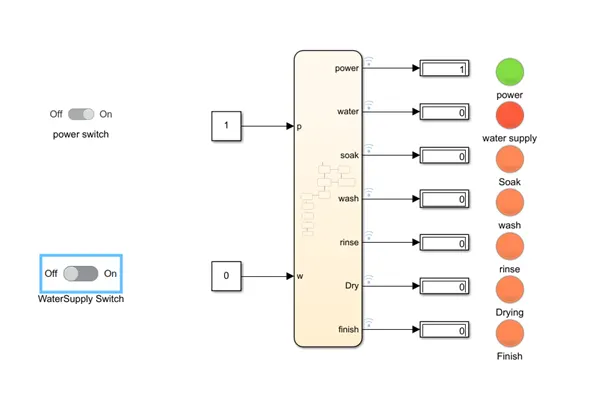
Stateflow chart showing that no water supply by changing LED lamp turn On RED.
Description of Gear Shift in Stateflow model:
Stateflow Objects used are
- Chart block
- Slider block
- Lamp
- Display
- Constant block
Stateflow chart for GearShift:
Input data is speed and output data are Gear1, Gear2, Gear3, Gear4, Gear5 are taken. Both the scope data generate ports on the Simulink model. State actions are entered in each state under the keywords entry and exit. The execution of Matlab code given in-state speed1, entry: Gear1 =1 will be displayed in Simulink display block via signal port after the event passes the transition condition action speed >0 and speed<15 before it enters the state and exits by the execution of Matlab code exit: Gear1=0. The state event moves to the next state when the next transition condition action is true given by the signal port. The chart transition conditions included different speed limits such as
Speed Range(kmph) Gear
0 to 15 1
16 to 25 2
26 to 40 3
41 to 60 4
Above 61 5
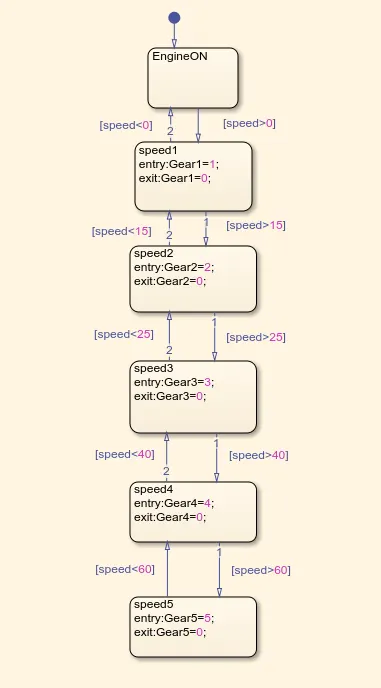
Simulink Model for Gear Shift:
The slider block is dropped onto the Simulink model from the library browser to input the data for the speed input port. When the value of speed is selected in the slider block, the value is taken by constant block. The connection is built between the slider and the constant block. By taking the input value, the Stateflow chart is executed and the output value is shown in the display block. When the output value which indicates the gear number is displayed as 1 in the display block reflects the LED lamp. The lamp color will remain GREY when value =1 and PINK when the value=0.
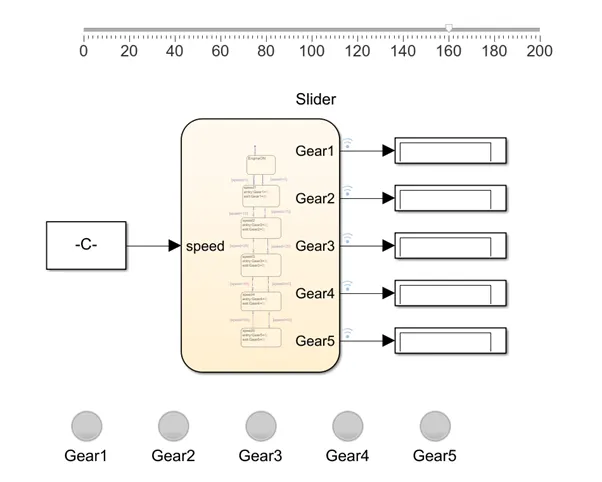
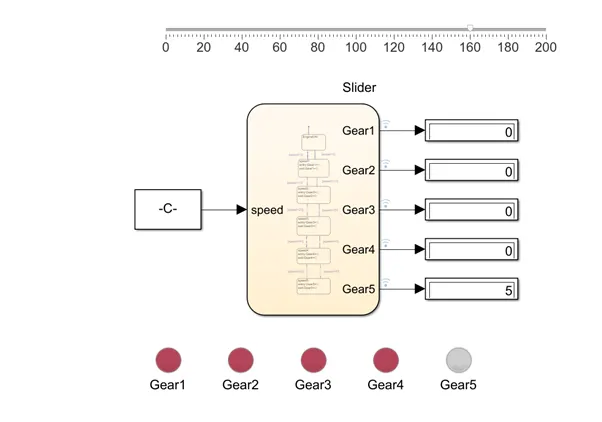
Here the input speed value is 160, after executing the Stateflow block displays output by passing transition conditions. Since the value is more than 60, Gear5 is shown in the display block and the corresponding LED remained in GREY color. The RED LED lamp indicates the failed state transitions.
Conclusion: Stateflow Machine charts have become a powerful tool that reduces the programming codes and improved the accuracy results of running conditions of systems.