Thermal modeling of battery pack with Panasonic UR18650A cell.
Aim :-
Thermal modeling of battery pack using MATLAB and Simulink.
Object :-
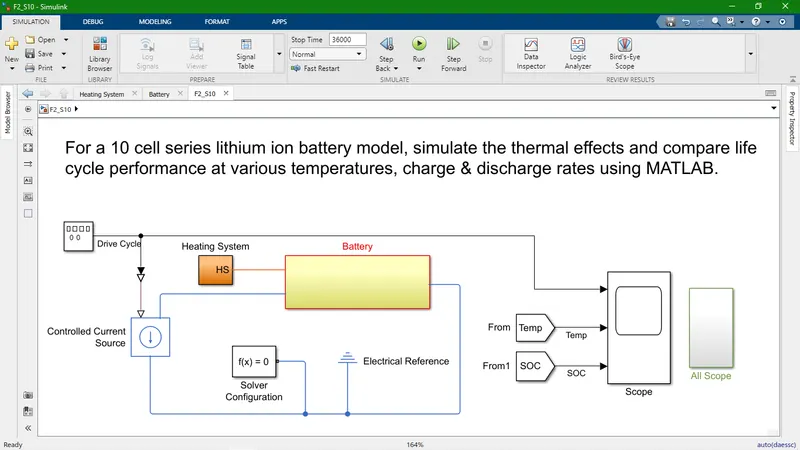
To make a 10 cell series lithium ion battery model, simulate the thermal effects and compare life cycle performance at various temperatures, charge & discharge rates using MATLAB and Simulink.
- This first look of my Simulink model.
- Here, main components are listed down.
- Battery
- Heating System
- Drive Cycle
- Controlled Current Source
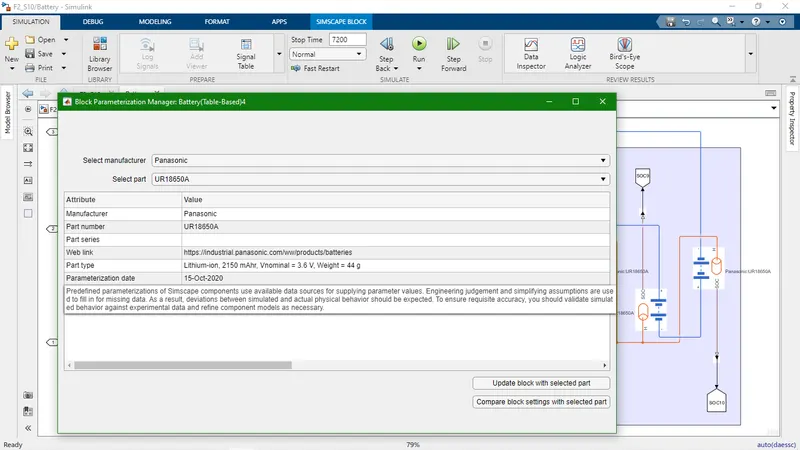
- In this model I have use Panasonic UR18650A.
- This is Lithium-Ion type battery,Now a day, which is mostly preferable by OEM (in automotive sector).
- It's nominal voltage is 3.6V and current is 2150mAhr.
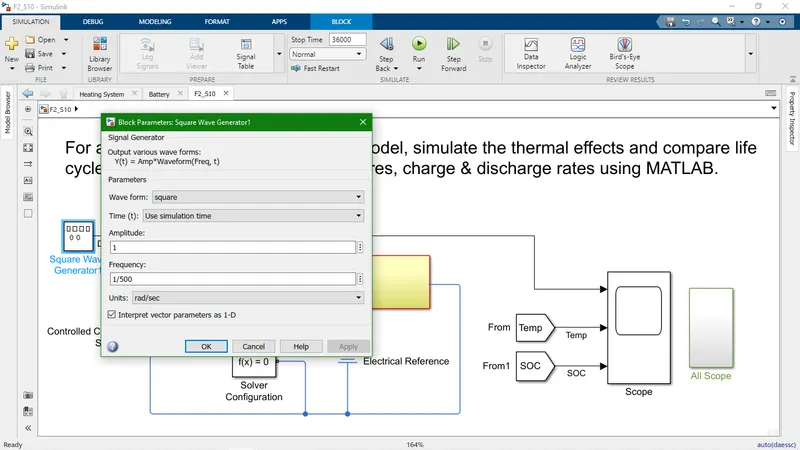
- This is a square wave generator which is wave in square form.
- Here, if you increase amplitude(the maximum extent of a vibration or oscillation) height of the wave is increase and if you decreased it visa versa.
- Frequency is totally dependent on time. It's Equation f = (1/T) and its unit is Hz or rad/sec.
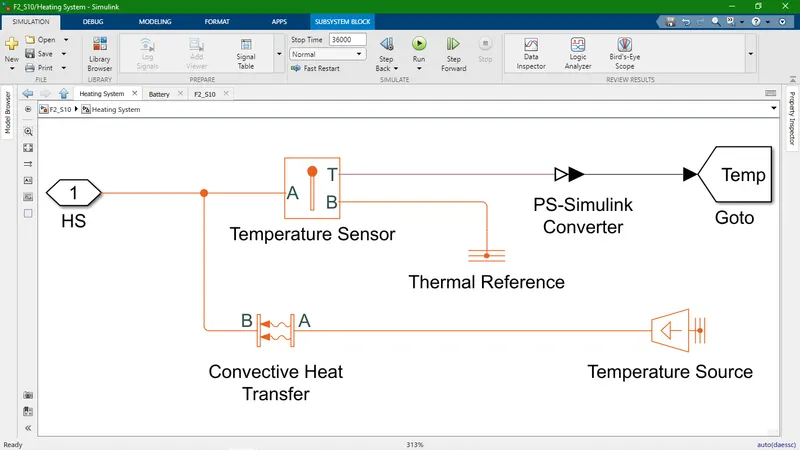
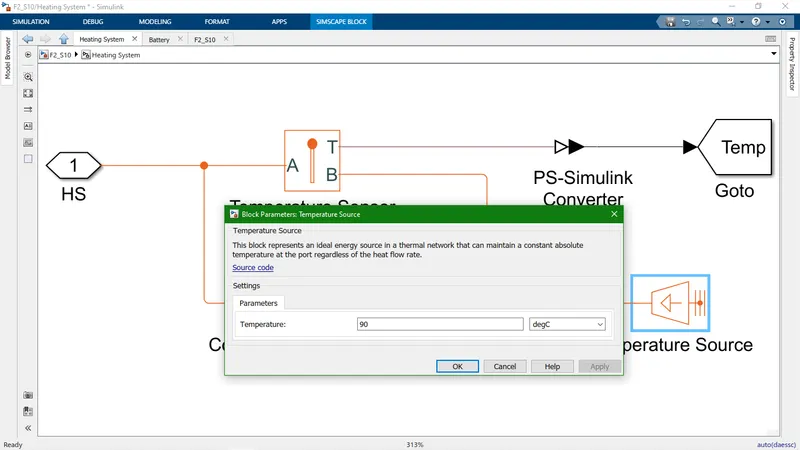
- This is a subsystem of heating System.
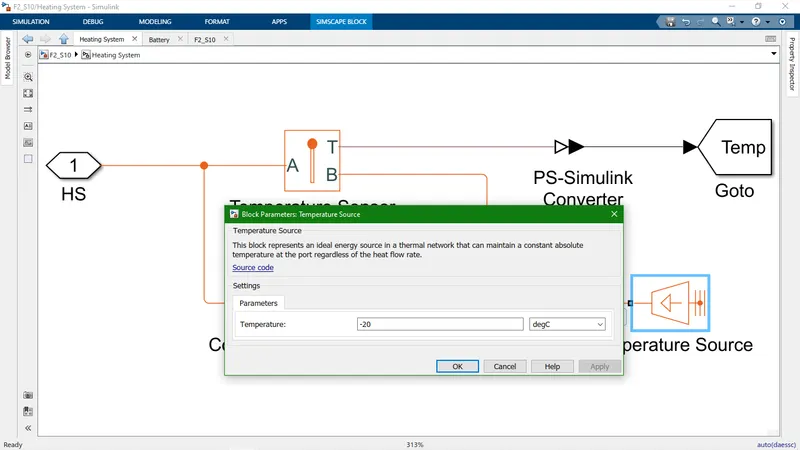
- Here, Temperature source give heat and which is provided to convective heat transfer system.
- HS input is come out from battery thermal port which show case battery inside temperature.
- Temperature sensor sense and that temperature gave it in output.
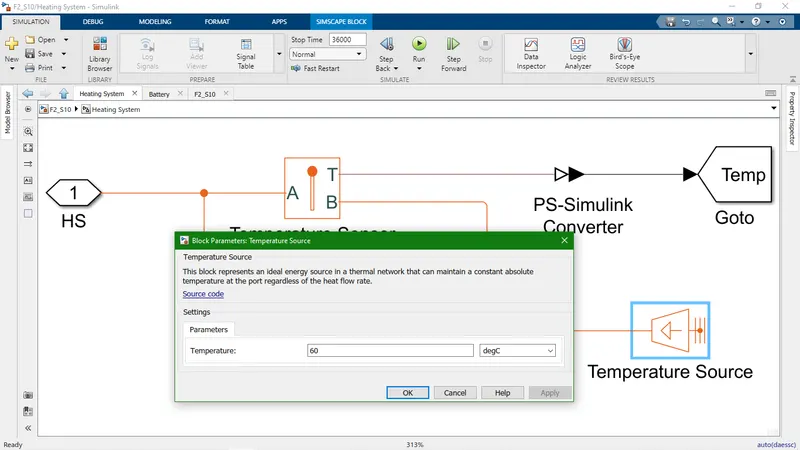
- Temperature sourc : It's provid constant absoiute temperature.
- Case 1 : Here, Max temperature (60 degC) apply as source temperature.
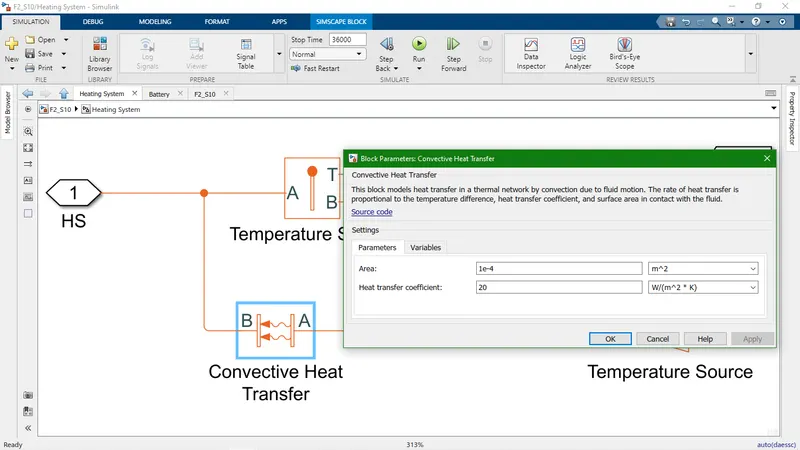
- Convective heat transfer block which mounted around the battery cell.
- It have two main parameters one is contact area and another is heat transfer coefficient.
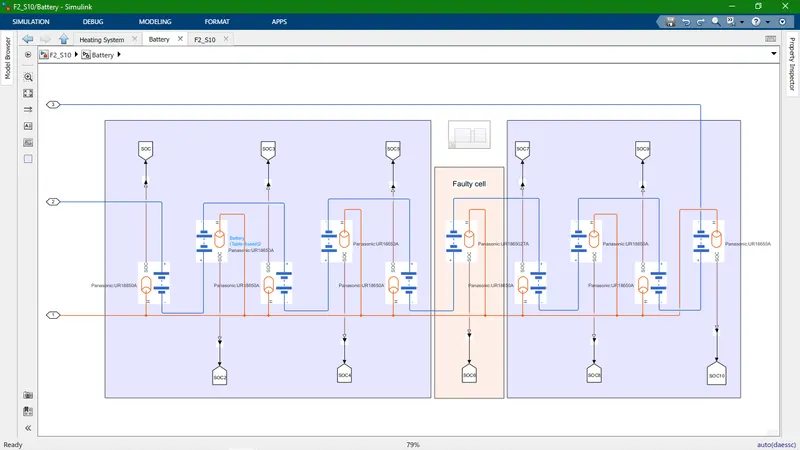
- In subsystem of battery there is 10 cells which connected in series.
- This battery cell get supply from Controlled Current Source.
- This cell give heat and SOC (State of charge) as an output.
- This is Panasonic UR18650A cell.
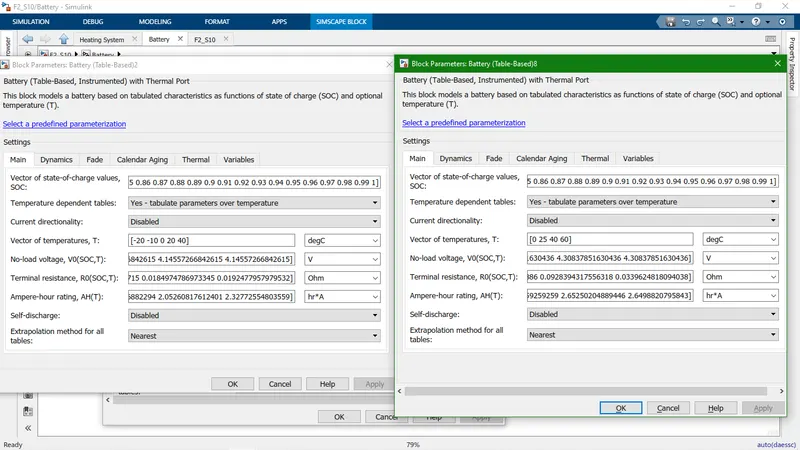
- There are 10 cells in connected in series in which one cell (cell no. 6) is faulty.
- All parameters are taken same in 9 cells.
- Here, main change in another one cell is vector of temperature.
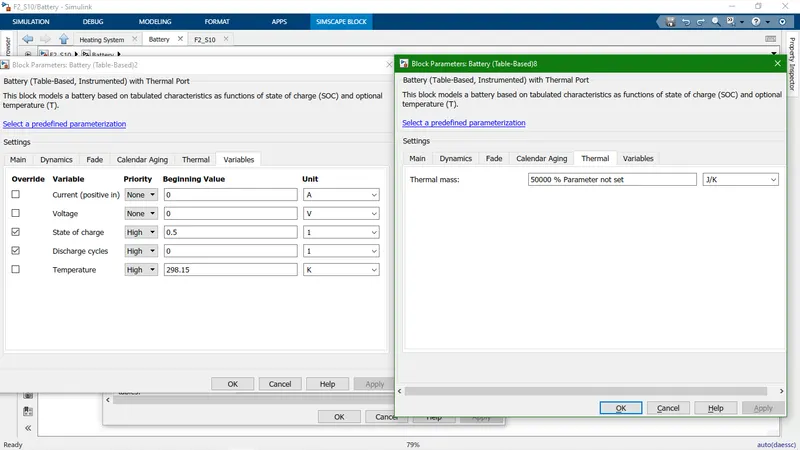
- Other parameter of battery are thermal mass, Discharge cycle and SOC.
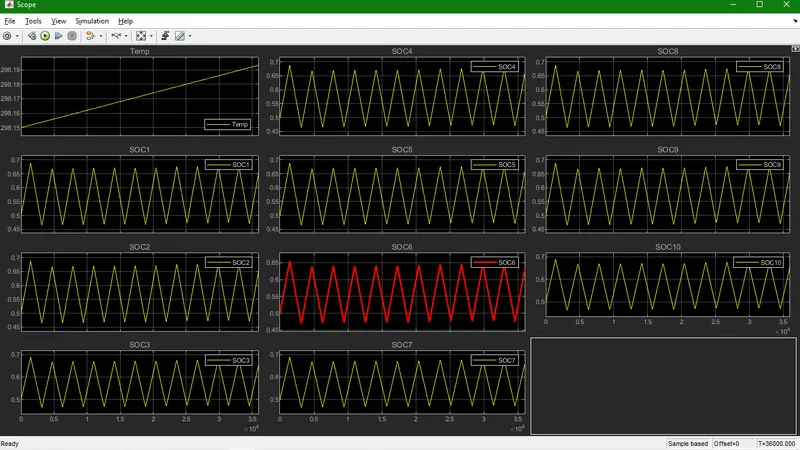
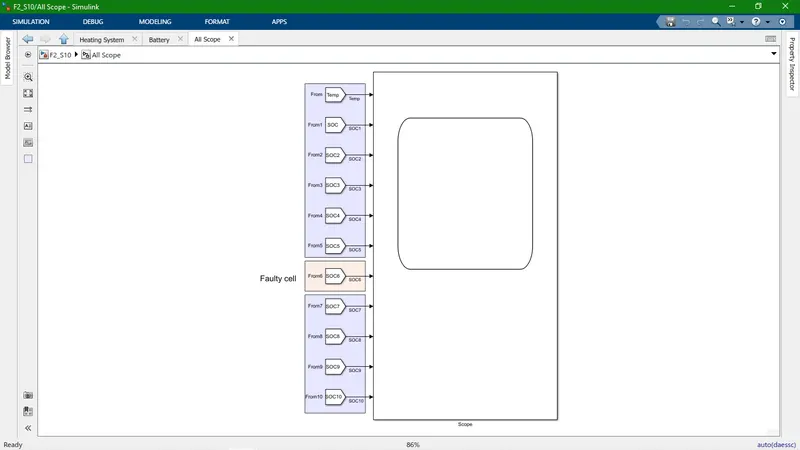
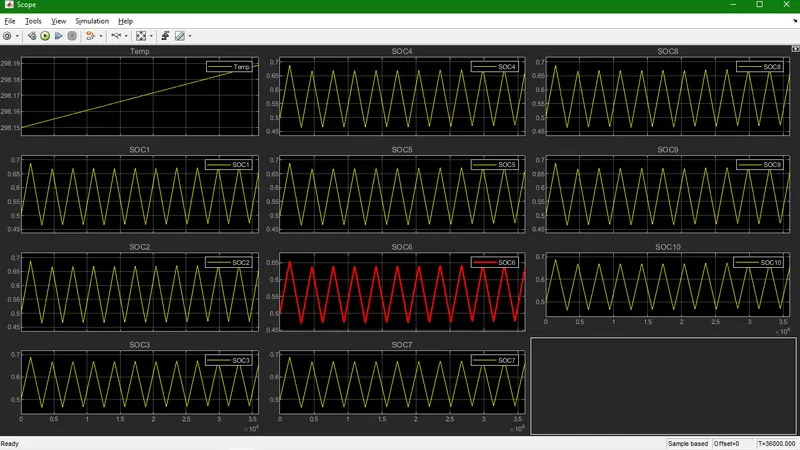
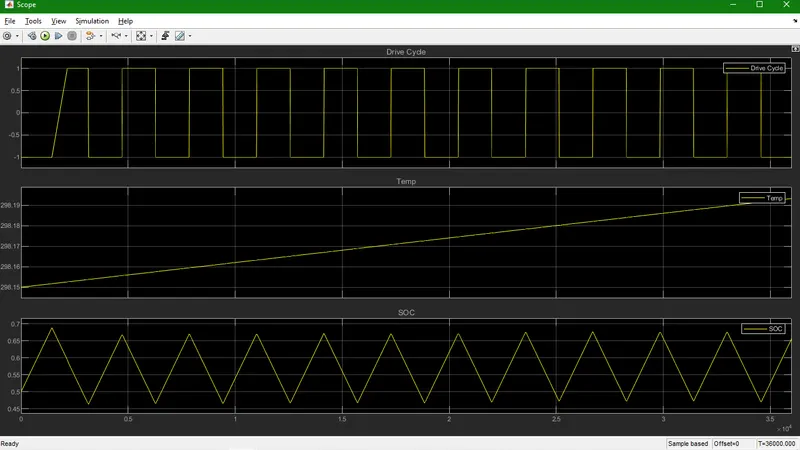
- This scope gives information of SOC and cell temperature.
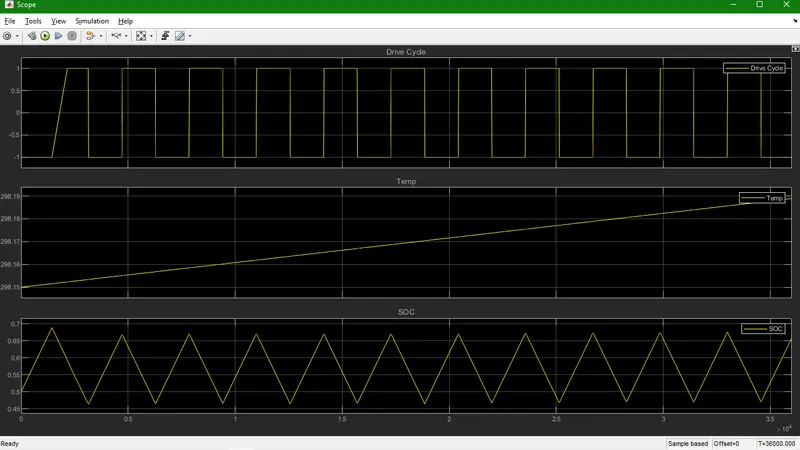
Result of the simulation
- In scope first one is output of Drive Cycle source
- Second is show rise in temperature which is minimal and it's rang is 298.15degC to 298.19degC.
- Here, SOC value is start from 0.5 (means 50%) and after time its has rise and fall. It's limite is nearly 0.45 to 0.7.
- Here, SOC 6 (Red) which is a faulty cell and it's SOC limit is nearly 0.475 to 0.655.
- Case 2 : Min temperature (-20 degC) applied to the source temperature.
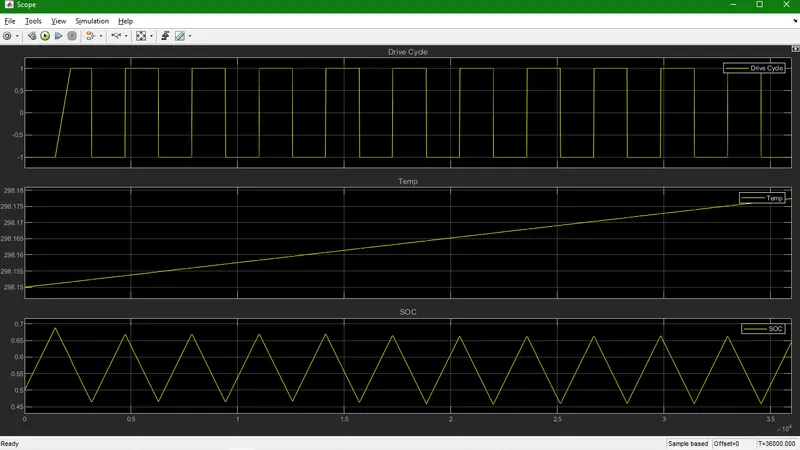
- In scope first one is output of Drive Cycle source.
- Second is show rise in temperature which is minimal and it's rang is 298.15degC to 298.18degC. (you can see 0.1degC difference compared to above)
- Here, SOC value is start from 0.5 (means 50%) and after time its has rise and fall. It's limite is nearly 0.45 to 0.7.
- Here, SOC 6 (Red) which is a faulty cell and it's SOC limit is nearly 0.475 to 0.655.
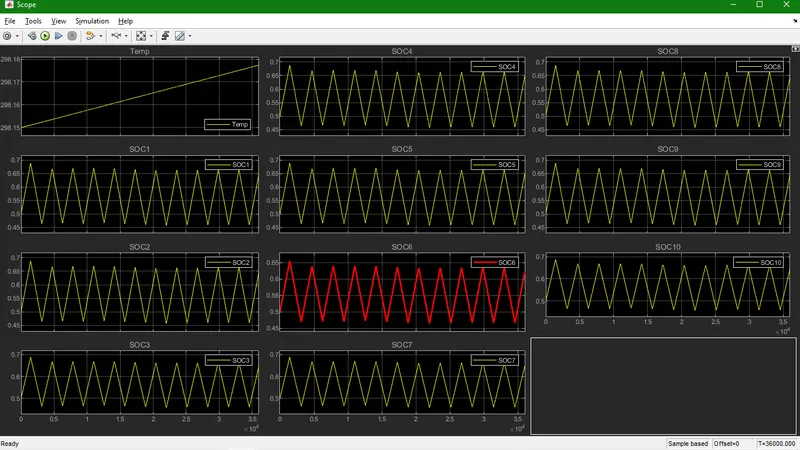
- Case 2 : Random temperature (100 degC) apply in source temperature.
- In scope first one is output of Drive Cycle source.
- Second is show rise in temperature which is minimal and it's rang is 298.15 degC to 298.18degC.
- Here, SOC value is start from 0.5 (means 50%) and after time its has rise and fall. It's limite is nearly 0.45 to 0.7.
- Here, SOC 6 (Red) which is a faulty cell and it's SOC limit is nearly 0.475 to 0.655.