Study of the optimization by using geometric algorithm in matlab.
Aim: To study the optimization by using geometric algorithm in matlab.
Formulae:
`f(x,y) = f1,xf2,xf1,yf2,y`
01. `f1.x = [sin(5.1pix + 0.5)]^6`
02. `f1,y = [sin(5.1piy + 0.5)]^6`
03. `f2.x = exp[-4ln(2)frac{(x-0.0667)^2}{0.64}]`
04. `f2.y = exp[-4ln(2)frac{(y-0.0667)^2}{0.64}]`
Objectives:
01. To study the code for optimization of the stalagmite and find global maxima.
02. Explanation of Geometric Algorithm and syntax used for it.
03. Code must give the same output, even if it is made to run several times.
04. Graph of all three studies must have labels and titles.
05. Mention the errors committed during programming and steps taken to correct them.
01.Introduction:
What is Optimization?
Mathematical optimization (alternatively spelled optimisation) or mathematical programming is the selection of a best element (with regard to some criterion) from some set of available alternatives. Optimization problems of sorts arise in all quantitative disciplines from computer science and engineering to operations research and economics, and the development of solution methods has been of interest in mathematics for centuries.
In the field of engineering and research we need to find the maximum and minimum values of specific parameters to evaluate the systems for better performance. In such situations it becomes very important to find the minimum and maximum values of the given parameters within the specific range of operation.
This whole process of calculating the required minimum or maximum values (optimum values of parameter for optimum results of the system.) of the specific parameter for the evaluation of the system is called as optimization.
Optimization includes finding "best available" values of some objective function given a defined domain (or input), including a variety of different types of objective functions and different types of domains.
What is Geometric Algorithm in matlab?
A genetic algorithm is a search heuristic that is inspired by Charles Darwin's theory of natural evolution. This algorithm reflects the process of natural selection where the fittest individuals are selected for reproduction in order to produce offspring of the next generation.
Same is done in the field of technical research and developement. To dvelope or evaluate the performance of the system we need to select the optimum values of the specific parameters. For determining the optimum values, optimization is done in the matlab using Geometric Algorithm (ga).
These algorithms are designed to solve Geometric Problems. They requires in-depth knowledge of different mathematical subjects like combinatorics, topology, algebra, differential geometry etc.
A genetic algorithm (GA) is a method for solving both constrained and unconstrained optimization problems based on a natural selection process that mimics biological evolution. The algorithm repeatedly modifies a population of individual solutions. At each step, the genetic algorithm randomly selects individuals from the current population and uses them as parents to produce the children for the next generation. Over successive generations, the population "evolves" toward an optimal solution.
You can apply the genetic algorithm to solve problems that are not well suited for standard optimization algorithms, including problems in which the objective function is discontinuous, non-differentiable, stochastic, or highly nonlinear.
For Example: Comparing the slopes of two lines, Finding equation of the plane, etc.
Now let us understand the genetic algorithm in Detail:
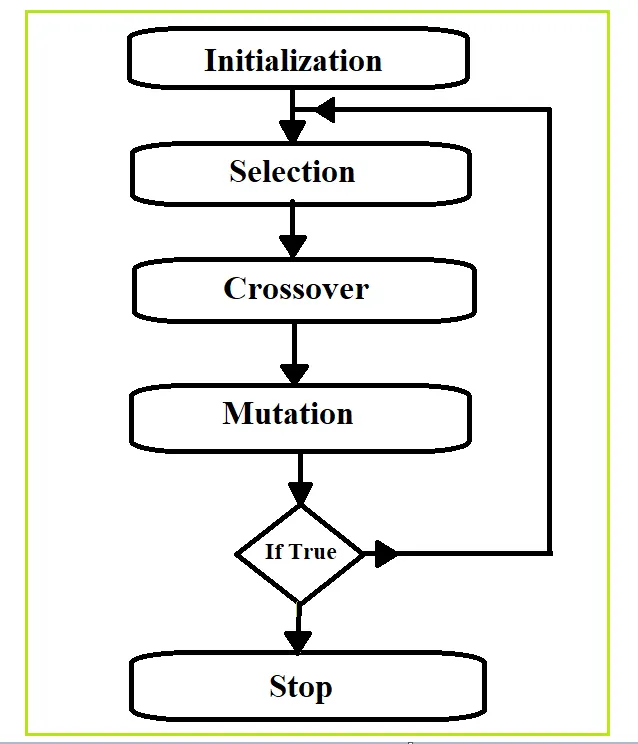
Diagram01: Steps involved in the process of Geometric algorithm.
Initialization:
In this stage we need to start the process by dividing or sorting the population we have into the diggerent categories so that we can use the best of the data available for the optimization.
Selection:
In this stage we have to select the different variables of the data under consideration so that we can use it for the process of the optimization. Selection is based onthe fitness function. We call this selected set of data or variables as chromozones. We perform some operations on the selected chromozones
Crossover:
While performing the actions after selction of chromozones we exchange the characteristics of both the chromozones with one another to obtain the best of the new set of chromozones which is always a better alternative when compared to the best of the old set of chromozones, this process is called as crossover.
Mutation:
Addition of the new characteristics to the new set of chromoxones in order to level up the fitness of the chromozoens
so they can survive and sustain against the worst of the situations, this process is called as mutation.
Same cycle is repeated unless and until true condition of the 'stop' is attempted.
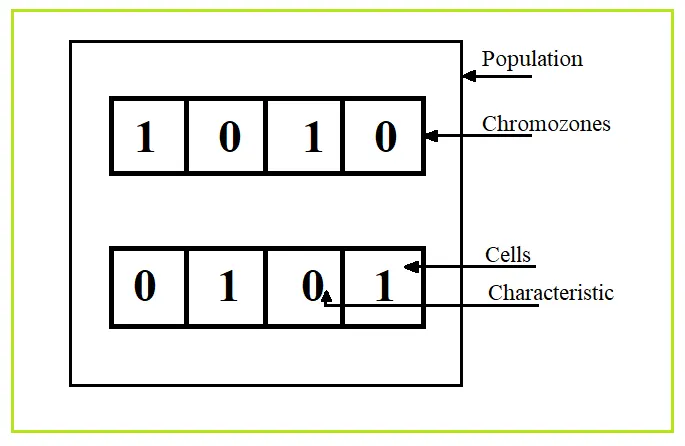
Figure02: Basics of the Genetic Algorithm.
Let,s take an example to understand the GA:
Let,s take a example of Maxone.
What is meant by Maxone?
Consider we have coin and we are tossing that coin for ten times. Altough we will get both head and tails as a result but we need tails. Let's say we got five heads and five tails as follows.
1 0 1 0 0 0 1 0 1 0
Now tails is what we need so whenever we got tails as a result we wrote 1 and for heads we wrote 0.
In Maxone what we do, we maximize the ones, in other words we can say that we maximize the output we need as a result that is one (1).
Example:
We tossed a coin six times for each time we took six results as follows.
S1: 0 1 0 1 0 1
S2: 1 0 1 0 1 0
S3: 0 0 0 1 1 1
S4: 1 0 1 0 0 1
S5: 0 0 1 0 0 1
S6: 1 0 1 1 1 0
Solution:
Step-01:
Calculating fitness for each set i. e. counting number of ones.
Fitness for each cell is as follows:
f(S1): 3
f(S2): 3
f(S3): 3
f(S4): 3
f(S5): 2
f(S6): 4
Therefore;
Overall fitness = Summation of f(Si) = F = 18
Length of the sample or Number of times coin is tossed for each sample = L = 06
Total number of times coin is tossed = n = 36
Step-02:
Selection.
For selection let's create a roulet wheel by representing the percentage values of the fitness function for each set.
S1: (3/18)*100 = 16.67 %
S2: (3/18)*100 = 16.67 %
S3: (3/18)*100 = 16.67 %
S4: (3/18)*100 = 16.67 %
S5: (2/18)*100 = 11.11 %
S6: (4/18)*100 = 22.22 %
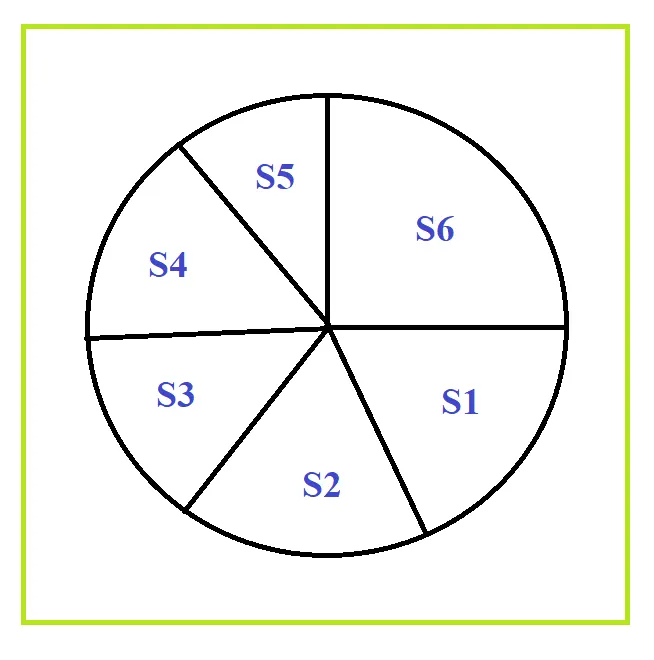
Figure03: Roulet wheel for given sets.
Now arrange the sets in the ascending order according to their percentage values of fitness function as shown in roulet wheel and simultaneously giving them new names as follows:
S5 = S1' = 0 0 1 0 0 1
S2 = S2' = 1 0 1 0 1 0
S3 = S3' = 0 0 0 1 1 1
S4 = S4' = 1 0 1 0 0 1
S1 = S5' = 0 1 0 1 0 1
S6 = S6' = 1 0 1 1 1 0
Step-03:
Crossover.
Crossover simply means exchanging the the characteristics of selected chromozones to obtain the best chromozones as a result.
Now we will select total four sets S1', S2', S5' and S6' for crossover.
We can perform crossover for any number of cells in a chromozones.
In this case we are performng the crossover from cell 3 to cell 6.
For S1' and S2' :
Before Crossover:
S1' = 0 0 1 0 0 1
S2' = 1 0 1 0 1 0
After crossover:
S1" = 0 0 1 0 1 0
S2" = 1 0 1 0 0 1
For S5' and S6' :
Before Crossover:
S5' = 0 1 0 1 0 1
S6' = 1 0 1 1 1 0
After crossover:
S5" = 0 1 1 1 1 0
S6" = 1 0 0 1 0 1
For S3' and S4' :
Before Crossover:
S3' = 0 0 0 1 1 1
S4' = 1 0 1 0 0 1
After crossover:
S3" = 0 0 1 0 0 1
S4" = 1 0 0 1 1 1
Step-04:
Mutation
S1" = 0 0 1 0 1 0
S2" = 1 0 1 0 0 1
S3" = 0 0 1 0 0 1
S4" = 1 0 0 1 1 1
S5" = 0 1 1 1 1 0
S6" = 1 0 0 1 0 1
Following cells are considered for mutation respective of cell numbers:
Cell 6 for S1"
Cell 2 for S2"
Cell 4 for S3"
Cell 3 for S4"
Cell 1 for S5"
Cell 5 for S6"
After Mutation:
S1" = 0 0 1 0 1 1
S2" = 1 1 1 0 0 1
S3" = 0 0 1 1 0 1
S4" = 1 0 1 1 1 1
S5" = 1 1 1 1 1 0
S6" = 1 0 0 1 1 1
Now calculating the fitness function for all the mutuated cesets:
f(S1") : 3
f(S2") : 4
f(S3") : 3
f(S4") : 5
f(S5") : 5
f(S6") : 4
Step-05:
Evaluation of fitness function.
Overall fitness = Summation of f(Si") = F = 24
Since f(Si") > f(Si), therefore we maximized the ones.
Syntax of 'ga':
Now let's take an example to study and understand the syntax of the Geometric algorithm in matlab:
In our program we are implementing the syntax of 'ga' for minimizing a nonlinear function with integer constraints.
Example:
We have following data available for the minimization.
01. min fun(x) i.e. F = (f1*f2*f3*f4)
Assume for f1,f2,f3 and f4 equations e1,e2,e3 and e4 are given respectively defined by the variables such as'x' and 'y'.
[We have function f(x) and we have to determine the minima of it. For minima we have to multiply the function by-ve. Therefore we programmed the function program for the objective function named as F_stalagmite.]
02. s.t. Ax <= b i.e. Linear or Non-linear inequality constraints.
    A = [];
    b = [];
[While solving example we need to convert the inequality constraints into equality constraints.]
03. Aeqx = beq i. e. Linear or Non-linear equality constraints.
    Aeq = [];
    beq = [];
[While solving remember that equality constraints are always subjected to (s.t.) inequality constraints.]
04. LB <= X <= UB i. e. there are lower and upper bounds on the x.
[Lower bounds = (0:0) and Upper bounds = (0.1:0.1).]
05. As given in the data we have two variables x and y.
Therefore number of variables are 2.
06. ga is the inbuilt command in the matlab for solver.
Syntax:
x = ga(fun,2,A,b,Aeq,beq,lb,ub,nonlcon,IntCon)
nonlcon = [];
IntCon = 1;
Application of syntax:
[inputs, fopt(i)] = ga(@F_stalagmite,2,[],[],[],[],[0:0],[0.1:0.1]);
02. Problem Statement:
To understand the concept of genetic algorithm, optimize the stalagmite function and find
the global maxima of the function. By using Geometric algorithm optimize the stalagmite function.
Solution:
Program-01:
Program for the optimization using geometric algorithm showing maxima values:

01.	 Optimization by using Genetic Algorithm
02.
03.	clear all
04.	close all
05.	clc
06.
07.	 Defining our research space.
08.	x = linspace(0,0.6,50);
09.	y = linspace(0,0.6,50);
10.
11.	Creating a 2D mesh
12.	[xx yy] = meshgrid(x,y);
13.
14.	Evaluating the stalagmite function
15.	for i = 1:length(xx);
16.	for j = 1:length(yy);
17.	input_vec(1) = xx(i,j);
18.	input_vec(2) = yy(i,j);
19.	f(i,j) = F_stalagmite(input_vec);
20.
21.	end
22.	end
23.
24.	% surfc (xx,yy,f)
25.
26.	% shading interp
27.
28.	[inputs,fval] = ga(@F_stalagmite,2);
29.	figure(1)
30.	surfc(x,y,f)
Detailed explanation of Program-01:
01. Name of Program, “Optimization by using Genetic Algorithm.”
02.
03.Clears your workspace.
04. Closes all the figures.
05. Clears Command window.
06.
07. Defining our research space.
08. x = linspace(0,0.6,50);
Defining the elements of the data of the space in which we will have to carry out our optimization so we are firstly defining the x-coordinates of the 2D space.
09. y = linspace(0,0.6,50);
Secondly we are defining the y-coordinates of the 2D space.
10. Creating a 2D mesh
Since we defined the x and y coordinates of the data as the row vectors, it is necessary to convert these vectors into 2D mesh which will give us the 2D space for the operation. This is done by using the ‘meshgrid’ command in matlab.
11. [xx yy] = meshgrid(x,y);
12. Evaluating the stalagmite function
Stalagmite is the mathematical model which helps us to determine the 2D and 3D meshing of the data for the given set of equations.
15. for i = 1:length(xx);
Starting of ‘for loop’ selecting the values of x-axis of the 2D mesh.
16. for j = 1:length(yy);
Starting of second ‘for loop’ selecting the values of y-axis of the 2D mesh.
17. input_vec(1) = xx(i,j);
Saving the values of the x-axis of the 2D mesh under the variable input_vec(1), which is used to give input values of the variable x of the governing equations of the optimization.
18. input_vec(2) = yy(i,j);
Saving the values of the y-axis of the 2D mesh under the variable input_vec(2), which is used to give input values of the variable y of the governing equations of the optimization.
19. f(i,j) = F_stalagmite(input_vec);
Entering the stalagmite function for the governing equations of the optimization, under the variable ‘f’ defined by the coordinates (i,j) values.
20.
21. end
End of first ‘for loop’.
22. end
End of second ‘for loop’.
23.
24. % surfc (xx,yy,f)
25.
26. % shading interp
27.
28. [inputs,fval] = ga(@F_stalagmite,2);
‘ga’ is the inbuilt command in the matlab that defines the geometric algorithm and by using it we can find out the maxima values for the given data, helping the optimization of the given problem. The ‘2’ denotes the total number of variables used in the stalagmite function for the optimization.
29. figure(1)
30. surfc(x,y,f)
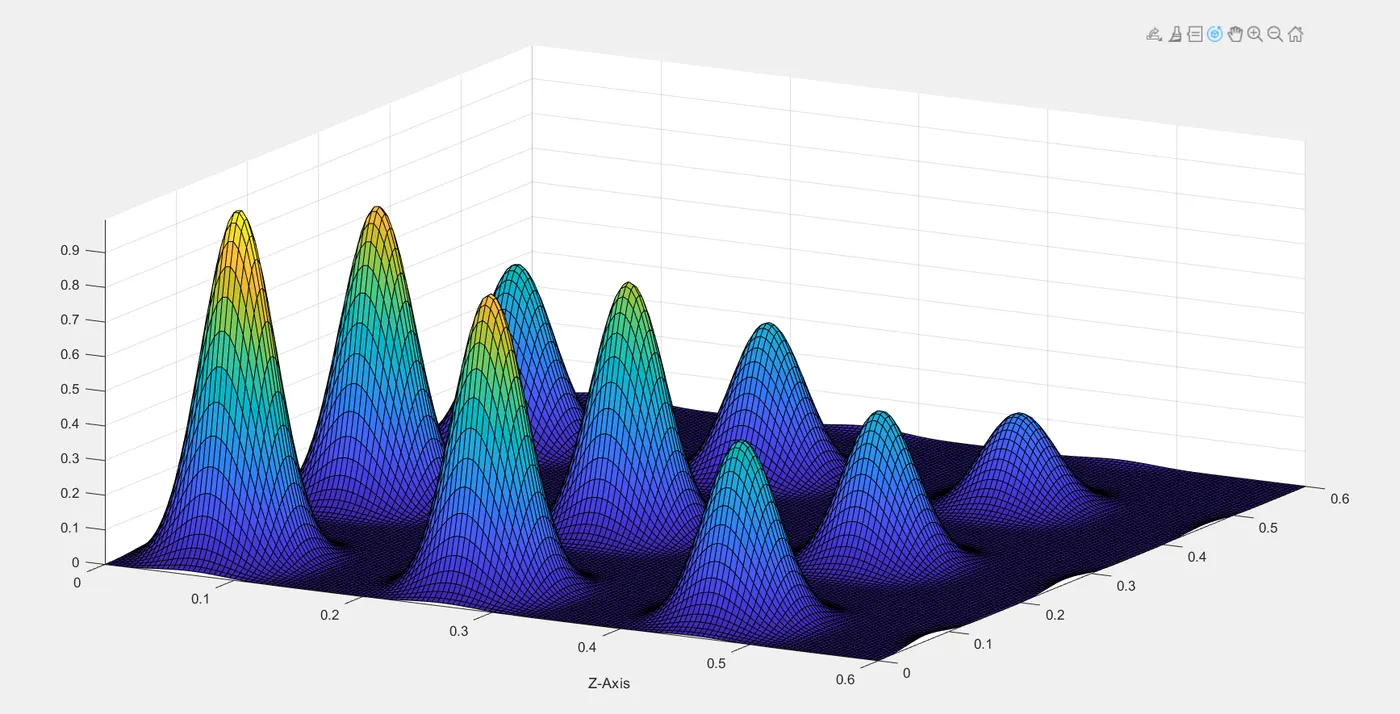
Figure04: Maxima for the function F_stalagmite.
Program-02:
Program for the optimization using geometric algorithm showing minima values:
01.	% Name of Program, “Optimization by using Genetic Algorithm for minima values.”
02.
03.	clear all
04.	close all
05.	clc
06.
07.	%  Study-03: Increasing GA iterations.
08.
09.	options = optimoptions('ga');
10.	x = linspace(0,0.6,150);
11.	y = linspace(0,0.6,150);
12.	num_cases = 80
13.
14.	% Creating a 2D mesh
15.
16.	[xx yy] = meshgrid(x,y);
17.
18.	%  Evaluating the stalagmite function
19.
20.	for i = 1:length(xx);
21.	for j = 1:length(yy);
22.	    input_vec(1) = xx(i,j);
23.	    input_vec(2) = yy(i,j);
24.	    f(i,j) = F_stalagmite(input_vec);
25.
26.	end
27.	end
28.
29.	tic
30.
31.	%  Study-01: Statistical Behavior
32.
33.	for i = 1;num_cases
34.	   [inputs, fopt(i)] = ga(@F_stalagmite,2);
35.	   xopt(i) = inputs(1);
36.	   yopt(i) = inputs(2);
37.	end
38.
39.	figure(1)
40.	subplot(2,1,1)
41.	xlabel('X-Axis')
42.	ylabel('Y-Axis')
43.	zlabel('Z-Axis')
44.	hold on
45.	surfc(x,y,f)
46.	shading interp
47.	plot3(xopt,yopt,-fopt,'marker','o','markersize',5,'markerfacecolor','r')
48.	title('unbounded inputs')
49.	subplot(2,1,2)
50.	plot(-fopt)
51.	xlabel('Iterations')
52.	ylabel('Function minimum')
53.
54.	study01_time = toc
55.
56.	tic
57.
58.	%  Study-02: Statistical Behavior with upper and lower bounds.
59.
60.	for i = 1:num_cases
61.	    [inputs, fopt(i)] = ga(@F_stalagmite,2,[],[],[],[],[0:0],[0.1:0.1]);
62.	   xopt(i) = inputs(1);
63.	   yopt(i) = inputs(2);
64.	end
65.
66.	study02_time = toc
67.
68.	figure(2)
69.	subplot(2,1,1)
70.	xlabel('X-Axis')
71.	ylabel('Y-Axis')
72.	zlabel('Z-Axis')
73.	hold on
74.	surfc(x,y,f)
75.	shading interp
76.	plot3(xopt,yopt,-fopt,'marker','o','markersize',5,'markerfacecolor','r')
77.	title('Bounded inputs')
78.	subplot(2,1,2)
79.	plot(-fopt)
80.	xlabel('Iterations')
81.	ylabel('Function minimum')
82.
83.	options = optimoptions(options,'populationsize',180)
84.
85.	tic
86.
87.	% Title of Study-03 ‘Bounded inputs with modified population size’.
88.
89.	for i = 1:num_cases;
90.	    [inputs,fopt(i)] = ga(@F_stalagmite,2,[],[],[],[],[0:0],[0.1:0.1],[],[],options);
91.	    xopt(i) = inputs(1);
92.	    yopt(i) = inputs(2);
93.	end
94.
95.	study3_time = toc
96.
97.	figure(3)
98.	subplot(2,1,1)
99.	xlabel('X-Axis')
100.	ylabel('Y-Axis')
101.	zlabel('Z-Axis')
102.	hold on
103.	surfc(x,y,f);
104.	shading interp
105.	plot3(xopt,yopt,-fopt,'marker','o','markersize',5,'markerfacecolor','r')
106.	title('bounded inputs with modified population size')
107.	subplot(2,1,2)
108.	plot(-fopt)
109.	xlabel('Iterations')
110.	ylabel('Function Minimum')
Detailed explanation of Program-02:
01. % Name of Program, “Optimization by using Genetic Algorithm for minima values.”
02. Clears your workspace.
03. Closes all the figures.
04. Clears Command window.
05. % Study-03: Increasing GA iterations.
06.
07. options = optimoptions('ga');
Startup options instruct matlab to perform certain operations when you start the program. Startup options also are called command flags or command-line switches. When you start at the operating system prompt, specify the options as arguments to the matlab command.
10. x = linspace(0,0.6,150);
Linspace command is used to select the 150 values of x between 0 to 0.6.This generates the row vector for the values of x.
11. y = linspace(0,0.6,150);
Linspace command is used to select the 150 values of y between 0 to 0.6. This generates the row vector for the values of y.
12. num_cases = 80
num_cases denotes the number of times we using or repeating the values of x and y i. e. 80.
13.
14. % Creating a 2D mesh.
15.
16. [xx yy] = meshgrid(x,y);
Meshgrid command is used to create the input matrix of the 2D surface grid from vector values of x and y.
17.
18. % Evaluating the stalagmite function
19.
20. for i = 1:length(xx);
Starting a ‘for loop’ which will take the values of x coordinates of input matrix [xx,yy] from start to end, which will be saved in the ‘i’.
21. for j = 1:length(yy);
Starting a ‘for loop’ which will take the values of y coordinates of input matrix [xx,yy] from start to end, which will be saved in the ‘j’.
22. input_vec(1) = xx(i,j);
The input variable ‘input_vec(1)’ holds the values of x,y coordinates of input matrix [xx,yy] of meshgrid 2D surface to plot the 3D surface along the x-axis.
23. input_vec(2) = yy(i,j);
The input variable ‘input_vec(2)’ holds the values of x,y coordinates of input matrix [xx,yy] of meshgrid 2D surface to plot the 3D surface along the y-axis.
24. f(i,j) = F_stalagmite(input_vec);
The input variable f(i,j) holds the values of the stalagmite function which is used to create the 3D surface by using a mathematical model.
25.
26. end
End of ‘for loop’ one.
27. end
End of ‘for loop’ two.
28.
29. tic
30.
To study the time required for the execution of the of Study-01 we are assigning the ‘tic’ command for starting the timer which will evaluate the time required for Study-01.
31. % Study-01: Statistical Behaviour
Here we are evaluating the stalagmite function and finding the values of the minima for it.
32.
33. for i = 1;num_cases
Starting ‘for loop’ which will take values from 1 to 80 (num_cases)
34. [inputs, fopt(i)] = ga(@F_stalagmite,2);
Entering the syntax of ‘ga’, under input variable [inputs, fopt(i)] ‘ga’ will evaluate the function ‘F_stalagmite’ which consists of two variables.
35. xopt(i) = inputs(1);
The optimum value of x is saved under the input variable ‘xopt(i)’ for every single loop which is taken from the input variable ‘inputs’ of ‘ga’s syntax.
36. yopt(i) = inputs(2);
The optimum value of y is saved under the input variable ‘yopt(i)’ for every single loop which is taken from the input variable ‘inputs’ of ‘ga’s syntax.
37. end
End of for loop.
38.
39. figure(1)
40. subplot(2,1,1)
Figure(1) is saved under the command ‘subplot’ which consists of three numeric digits. The main objective of the ‘subplot’ command is to represent the two or more than two figures in the same frame. The very first digit in the command represents the number of rows, second digit represents the number of columns and third digit represents the number of sub-figure.
41. xlabel('X-Axis')
42. ylabel('Y-Axis')
43. zlabel('Z-Axis')
Labeling X, Y and Z axis of the plot.
44. hold on
45. surfc(x,y,f)
objective of the command ‘surfc(x,y,f)’ is to plot the function plot ‘f’ on the Z-axis on the 2D grid defined by the x and y coordinates. This figure of ‘surfc’ command is first sub-figure under the ‘subplot’ command.
46. shading interp
shading interp varies the color in each line segment and face by interpolating the colormap index or true color value across the line or face.
47. plot3(xopt,yopt,-fopt,'marker','o','markersize',5,'markerfacecolor','r')
Commanding the ‘plot3’ for plotting optimum values of x,y and f of specified input credentials.
48. title('unbounded inputs')
Title of the plot ‘unbound inputs’.
49. subplot(2,1,2)
50. plot(-fopt)
Plotting the second sub-figure of the ‘subplot’ command which will plot the values of ‘f’ for minima.
51. xlabel('Iterations')
52. ylabel('Function minimum')
Labeling the x and y axises of the second sub-figure.
53.
54. study01_time = toc
End of timer for the evaluation of the time required for the execution for Study-01.
55.
56. tic
57.
58. % Study-02: Statistical Behaviour with upper and lower bounds.
59.
60. for i = 1:num_cases
61. [inputs, fopt(i)] = ga(@F_stalagmite,2,[],[],[],[],[0:0],[0.1:0.1]);
The selection of the points for the evaluation is very random and unspecified therefore to overcome this we have to put the upper and lower bounds on the points under consideration.
[0:0] defines the lower bounds and [0.1:0.1] defines the upper bounds. Now it means for every single run the values for the points of selction will range between [0:0] to [0.1:0.1].
62. xopt(i) = inputs(1);
63. yopt(i) = inputs(2);
64. end
65.
66. study02_time = toc
67.
68. figure(2)
Figure command in order to frame second separate figure named as’Figure02’
69. subplot(2,1,1)
70. xlabel('X-Axis')
71. ylabel('Y-Axis')
72. zlabel('Z-Axis')
73. hold on
74. surfc(x,y,f)
75. shading interp
76. plot3(xopt,yopt,-fopt,'marker','o','markersize',5,'markerfacecolor','r')
77. title('Bounded inputs')
Title of Study-02 ‘Bounded inputs’.
78. subplot(2,1,2)
79. plot(-fopt)
80. xlabel('Iterations')
81. ylabel('Function minimum')
82.
83. options = optimoptions(options,'populationsize',180)
Startup options instruct matlab to perform certain operations when you start the program. Startup options also are called command flags or command-line switches. When you start at the operating system prompt, specify the options as arguments to the matlab command.
The population size is stated in the command. Here the polulaton size means the total number of values taken into consideration for the study i. e. 180 so that larger the size more easier it becomes for’ga’ to compare and study and evaluate the minima, the only drawback is this process takes a comparatively more time.
84.
85. tic
86.
87. % Title of Study-03 ‘Bounded inputs with modified population size’.
88.
89. for i = 1:num_cases;
90. [inputs,fopt(i)] = ga(@F_stalagmite,2,[],[],[],[],[0:0],[0.1:0.1],[],[],options);
This command will get executed as explained in the section of “Syntax of ga”.
91. xopt(i) = inputs(1);
92. yopt(i) = inputs(2);
93. end
94.
95.study3_time = toc
96.
97. figure(3)
98. subplot(2,1,1)
99. xlabel('X-Axis')
100. ylabel('Y-Axis')
101. zlabel('Z-Axis')
102. hold on
103. surfc(x,y,f);
104. shading interp
105. plot3(xopt,yopt,-fopt,'marker','o','markersize',5,'markerfacecolor','r')
106. title('bounded inputs with modified population size')
107. subplot(2,1,2)
108. plot(-fopt)
109. xlabel('Iterations')
110. ylabel('Function Minimum')
Program-03: Function program for stalagmite.
function [f] = F_stalagmite(input_vec)

x = input_vec(1);
y = input_vec(2);

f1 = (sin(5.1*pi*x + 0.5))^6;
f2 = (sin(5.1*pi*y + 0.5))^6;

f3 = exp((-4*log(2)*(x-0.0667)^2)/0.64);
f4 = exp((-4*log(2)*(y-0.0667)^2)/0.64);

f = -(f1*f2*f3*f4);

end
Picture01: Shows the Functional program for the stalagmite.
Results:
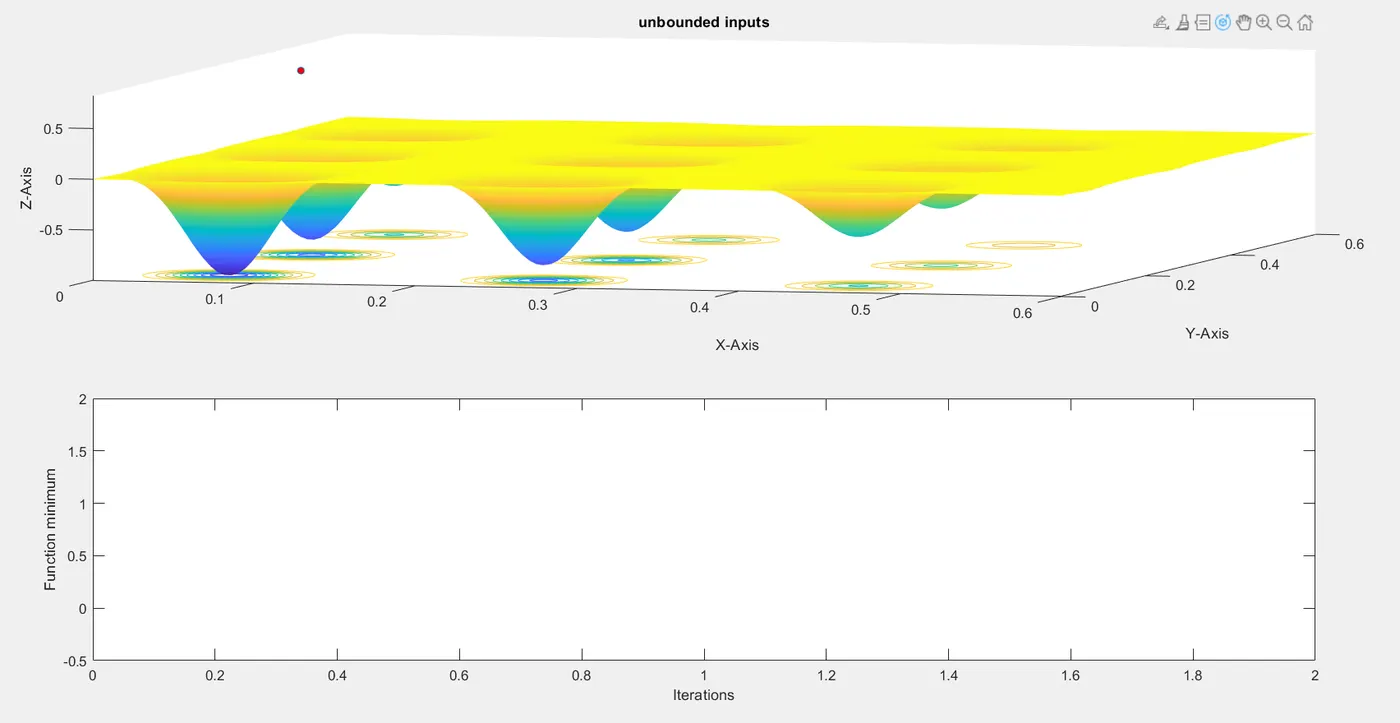
Figure05: Figure(1) of the results for the study-01.
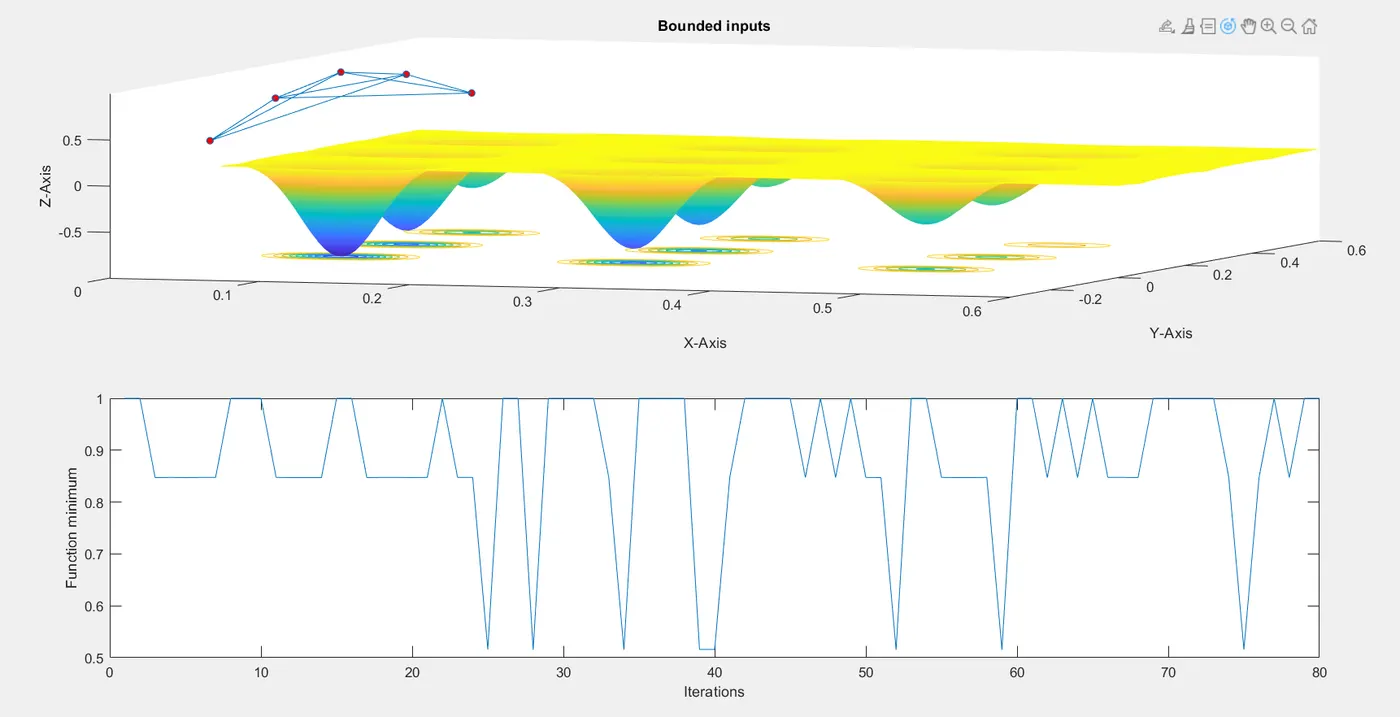
Figure06: Figure(2) of the results for the study-02.
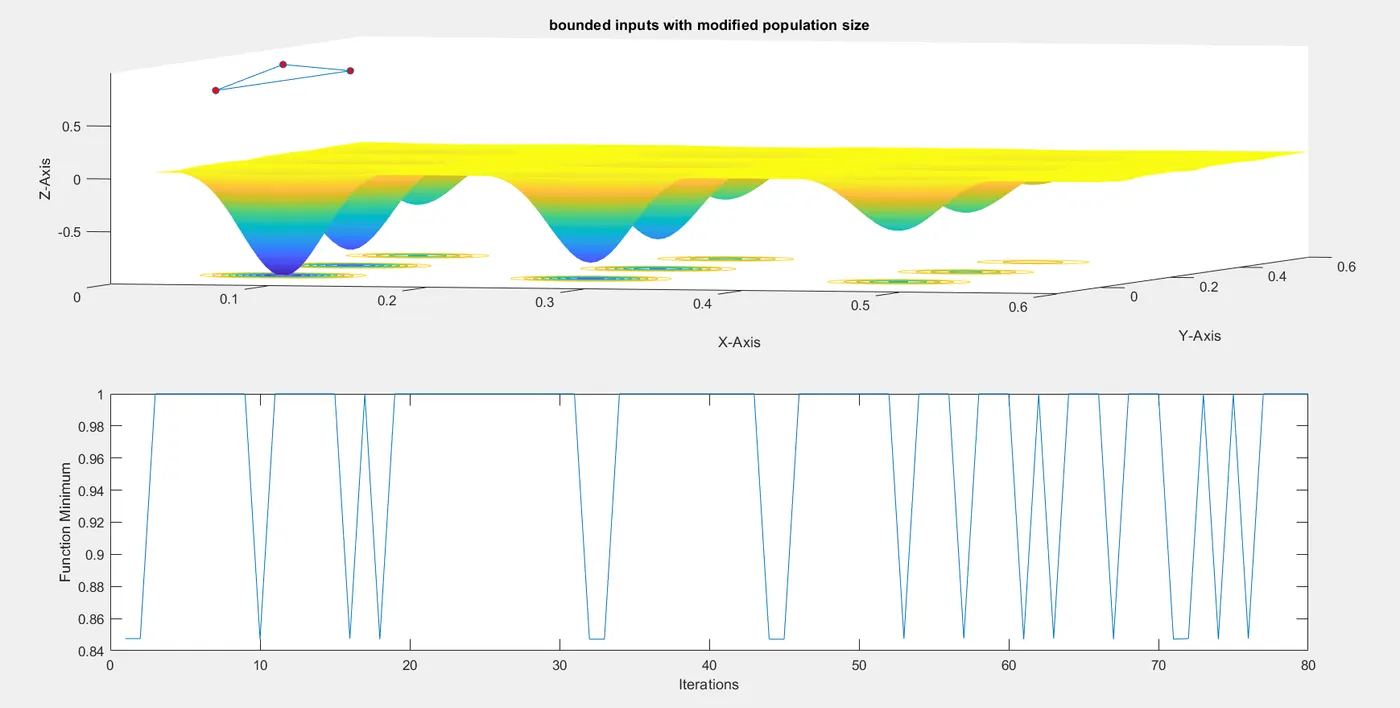
Figure07: Figure(3) of the results for the study-03.
Errors occured while Programming:
01. Stalagmite functiion was used as command instead of the programming the run.
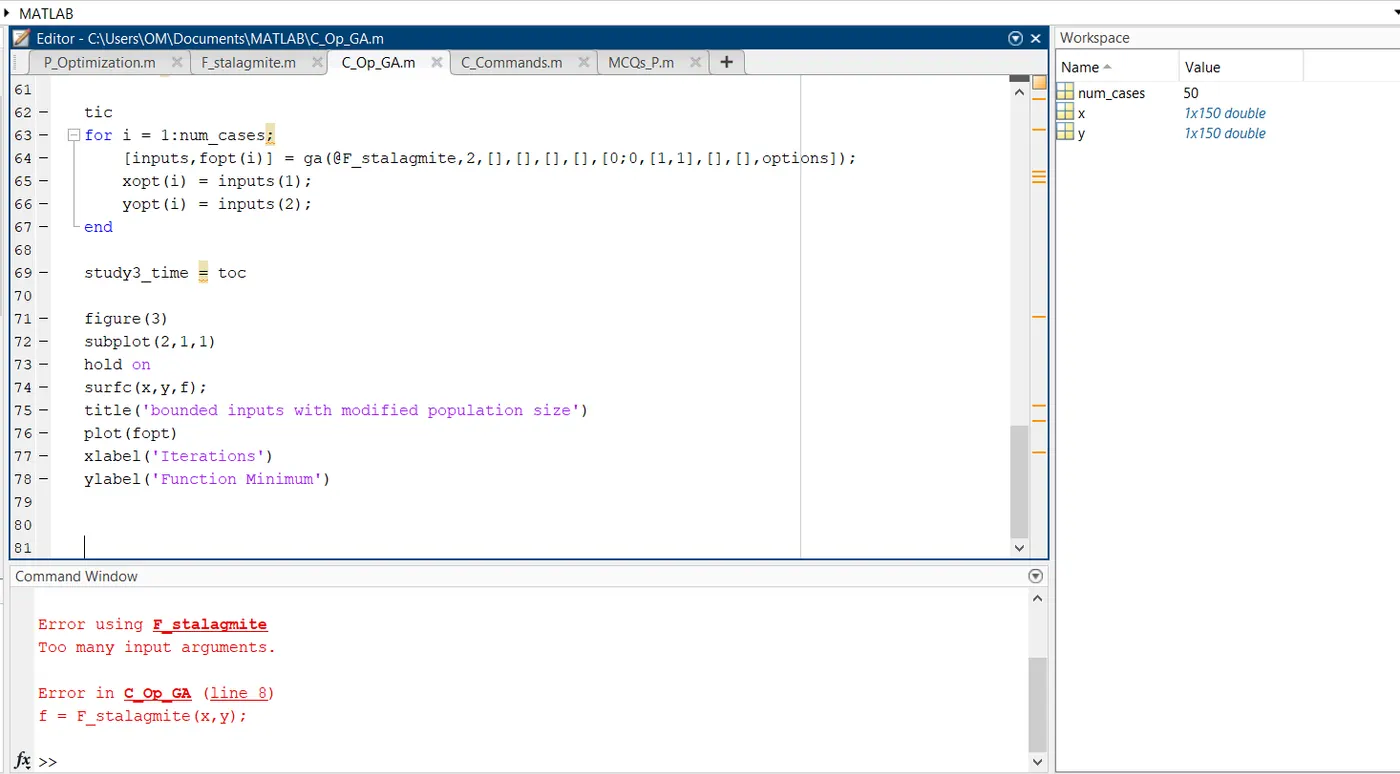
Figure08: Error programming the codec.
Correction:
Program was written for the plotting and command line of the stalagmite function was removed.
Conclusion:
The value of the minima for the given mathematical function was studied and evaluated using Geometric Algorithm.