Study and configure the generic battery model of lithium ion battery in MATLAB.
Aim: To study and configure the generic battery model of lithium ion battery in MATLAB.
Objectives:
01.
To configure the generic battery model of li-ion battery in MATLAB.
02.
To simulate generic battery model using UDDS data.
Introduction:
What is Lithium ion battery?
A lithium-ion battery or Li-ion battery is a type of rechargeable battery in which lithium ions move from the negative electrode through an electrolyte to the positive electrode during discharge, and back when charging. Li-ion batteries use an intercalated lithium compound as the material at the positive electrode and typically graphite at the negative electrode.
Li-ion batteries have a high energy density, no memory effect (other than LFP cells) and low self-discharge. Cells can be manufactured to either prioritize energy or power density.
Fig01: Lithium ion battery.
Problem statement:
01.
From datasheet of a lithium ion battery configure the generic battery model in MATLAB.
02.
Simulate generic battery model charge discharge using UDDS data.
Solution:
01. From datasheet of a lithium ion battery configure the generic battery model in MATLAB.
Note: Li-ion Battery Datasheet.
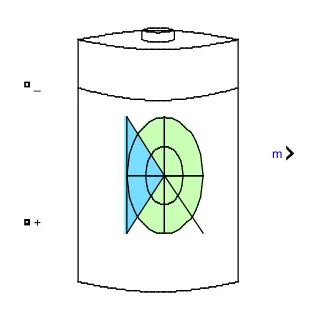
Fig01: Battery block from simulink.
As shown in figure01 is a battery block from simulink and it's function is to implement a generic battery model for most popular battery types. Temperature and aging (due to cycling) effects can be specified for Lithium-Ion battery type. When we open the battery block we get following interface.
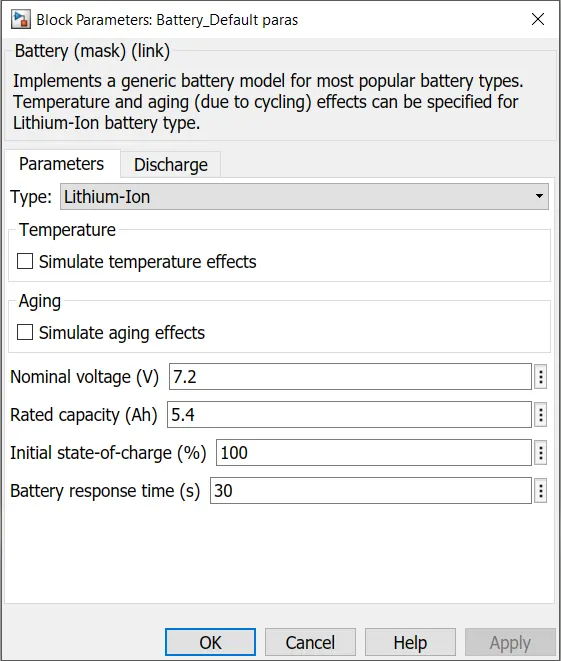
Fig02: Battery block- Basic parameters (By-default parameters).
First we have to select the type of a battery it can be lithium ion battery, Nickle Cadmium, Nickle Metal Hydrite or Lead acid type battery depending upon the application.
We can also simulate the battery model for the temperature effects and aging effects depending on our study.
Other basic parameters includes the Nominal voltage (V), Rated capacity (Ah), Initial state-of-charge (%) and Battery response time (t) of the battery.
Here in this particular case as we can see in the figure02 we are using Li-ion battery type without considering the temperature and aging effects.
Values of the other basic parameters of the battery are as shown in the figure02 which are the default values of the battery block.
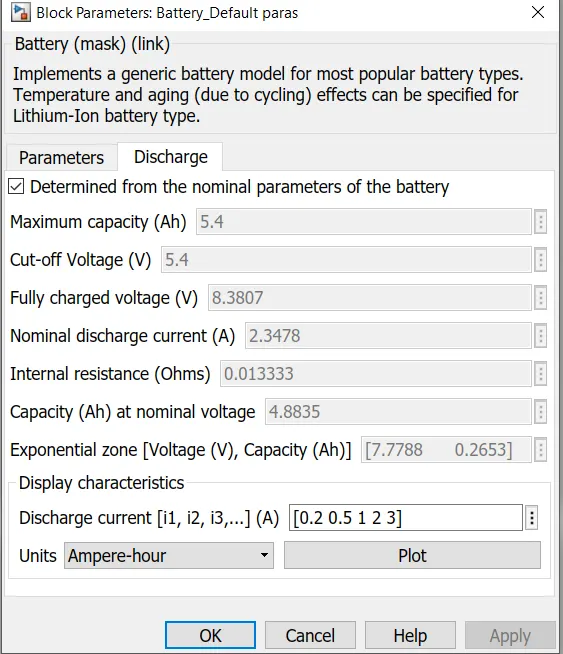
Fig03: Battery block- Discharge parameters (By-default parameters).
In the discharge parameters of the battery block we have to enter the values of the following parameters:
Maximum capacity (Ah)
Cut-Off voltage (V)
Fully charged voltage (V)
Nominal discharge current (A)
Internal resistance (Ohms)
Capacity (Ah) at nominal voltage
Exponential zone [Voltage (V), Capacity (Ah)]
For displaying characteristics of the battery we need to enter the values of the discharge current of the battery:
We can plot it against time (t) or capacity (Ah).
In our study we took the default values of the all discharge parameters and for characteristics we entered the current values as [0.2 0.5 1 2 3] against
capacity (Ah).
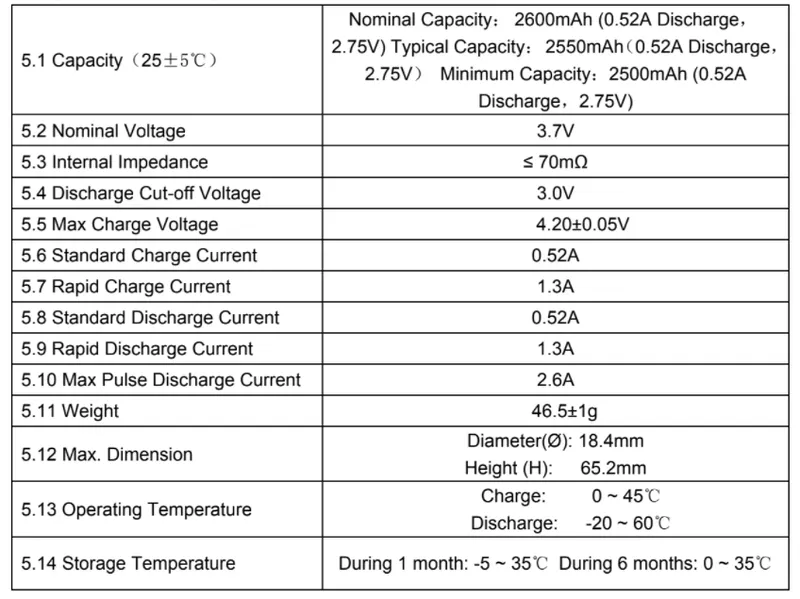
Fig04: Parameters of the battery from the datasheet.
The link for the datasheet is given at the begining, by refering these values we are gonna configure the generic model of Li-ion battery.
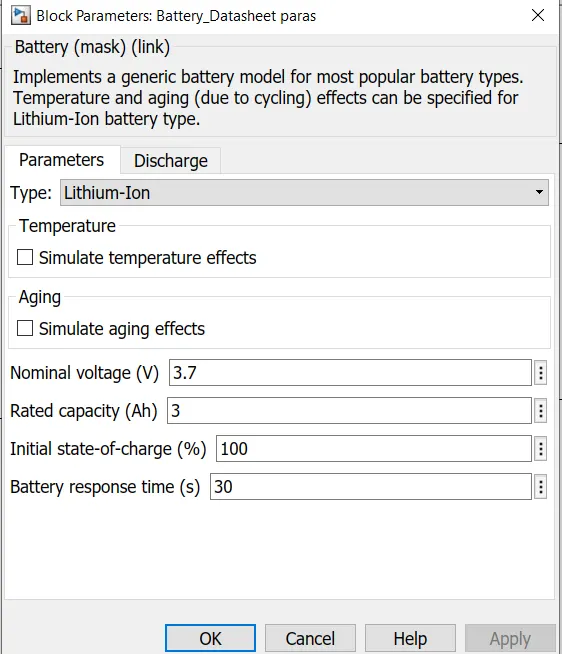
Fig05: Battery block- Basic parameters (Datasheet parameters).
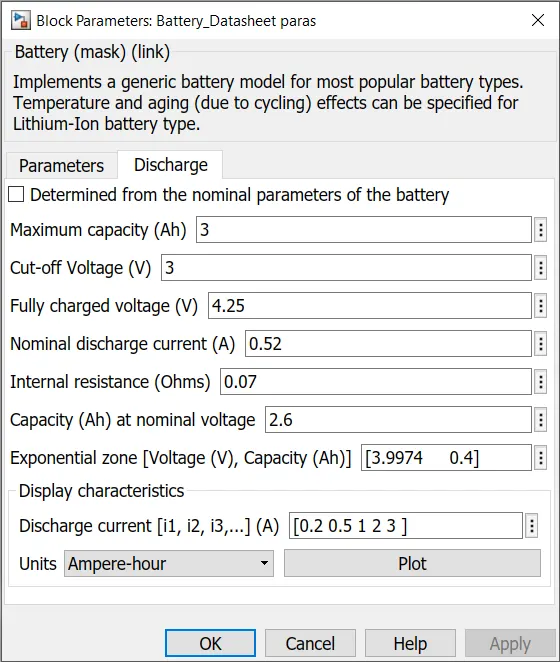
Fig06: Battery block- Discharge parameters (Datasheet parameters).
02. Simulate generic battery model charge discharge using UDDS data.
Note: Link for UDDS excel file.
UDDS stands for Urban Dynamometer Driving Schedule, and refers to a United States Environmental Protection Agency mandated dynamometer test on fuel economy that represents city driving conditions which is used for light duty vehicle testing.
It is also known as U.S. FTP-72 (Federal Test Procedure) cycle, LA-4 cycle, in Sweden as A10 or CVS (Constant Volume Sampler) cycle and in Australia as the ADR 27 (Australian Design Rules) cycle.
Though it was originally created as a reference point for fossil fueled vehicles, it is also used to give estimates on how many miles an electric vehicle will travel on a single charge.
Fig07: UDDS (Speed Vs. time plot).
Now we got the excel file from the link provided in the begining. Next we will have to feed this drive cycle data as excel sheet for further processing and simulation.
This is done with the help of 'Drive Cycle Source block' in simulink.
Firstly we will call out the 'Drive Cycle Source block' and open it, to get the following interface.
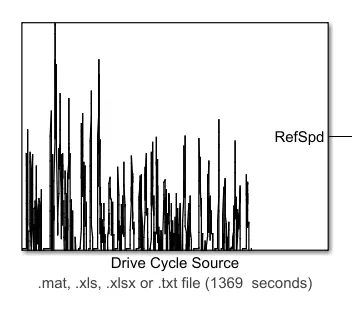
Fig08: Drive Cycle Source block.
With Drive Cycle Source block it is very easy to feed the data of the drive cycle in any format for further simulation.
To feed the data file we must open the block and select the type of file required and the file itself from it's destination.
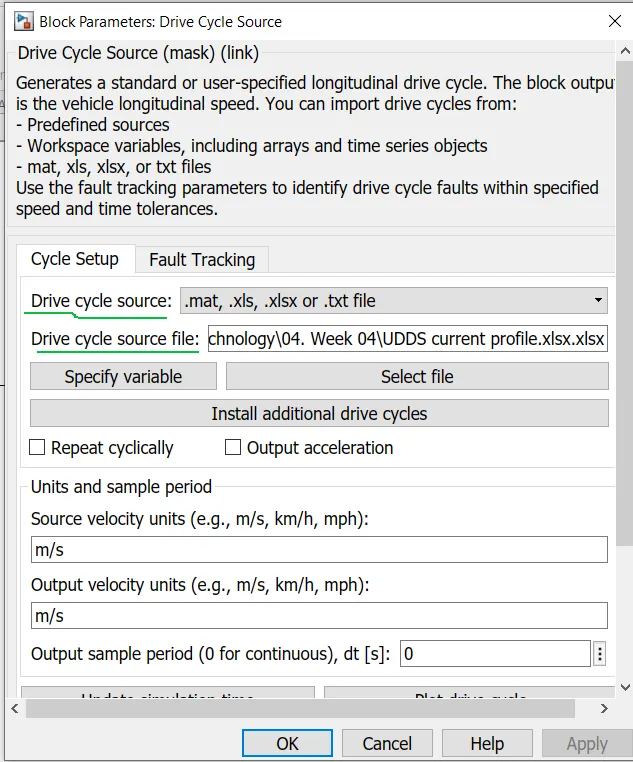
Fig08: Drive Cycle Source block for selection of the data file.
Note: The name of the data file must be saved with .xlsx (in case of excel file) at the end as shown in figure09 otherwise error will occur.

Fig09: Nomenclature guideline for the excel format of the data file.
Generic battery model for the Lithium-ion battery:
Genetic model Li-ion battery file.
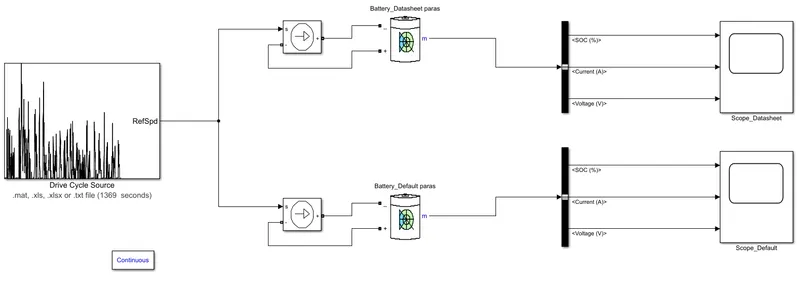
Fig10: Generic model of a Li-ion battery in simulink for UDDS.
Here for this model we used the two batterry blocks.
For the first battery block we use values of parameters from datasheet whereas for the second battery block we used the default values of the battery block.
Values of the discharge current for ploting the characteristics of the both batteries were taken same and as [0.2 0.5 1 2 3] .
Both the battery blocks are supplied with each blockof controlled source of current.
Each of this block of controlled source of current is supplied with the Drive cycle data from the block of Drive Cycle Source.
Further the output of the each battery block is given to the bus selector connected separately to each battery block.
Further this signals (Voltage (V), Current (A), SOC (%)) are fed to their respective scopes.
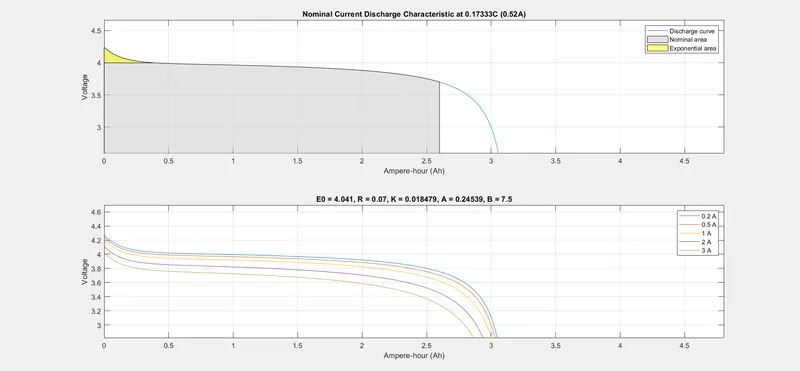
Fig11: Current discharge characteristic for datasheet parameters.
According to the input parameters of datasheet which are Nominal voltage (V) of 3.7 V and Rated capacity (Ah) 3 Ah.
For lower values of the current we can obtain 3 Ah or bit more than 3 Ah as a rated capacity.
Whereas as the values of the current increases the rated capacity of a lithium-ion battery decreases (2.8 Ah) below it's rated capacity.
For lower values of the current fully charge voltage (4.25 V) can be obtained.
Whereas as the values of the current increases the voltage of a lithium-ion battery decreases (4 V) below it's fully charges voltage.
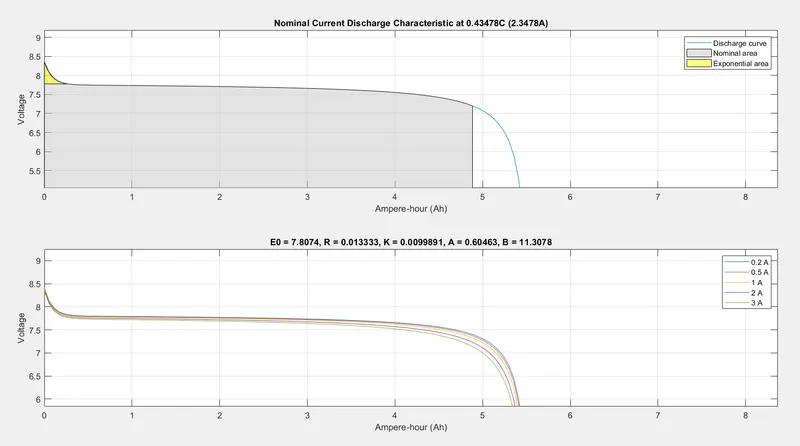
Fig12: Current discharge characteristics for default parameters.
According to the input parameters of datasheet which are Nominal voltage (V) of 7.2 V and Rated capacity (Ah) 5.4 Ah.
For lower values of the current we can obtain 5.4 Ah as a rated capacity.
Whereas as the values of the current increases the rated capacity of a lithium-ion battery decreases (5.2 Ah) below it's rated capacity.
For lower values of the current fully charge voltage (8.4 V) can be obtained.
Whereas as the values of the current increases the voltage of a lithium-ion battery decreases (8.3 V) below it's fully charges voltage.
From both plots it is clear that the behaviour of the lithium ion battery under both situations is same except the magnitude of the voltages and rated capacity.
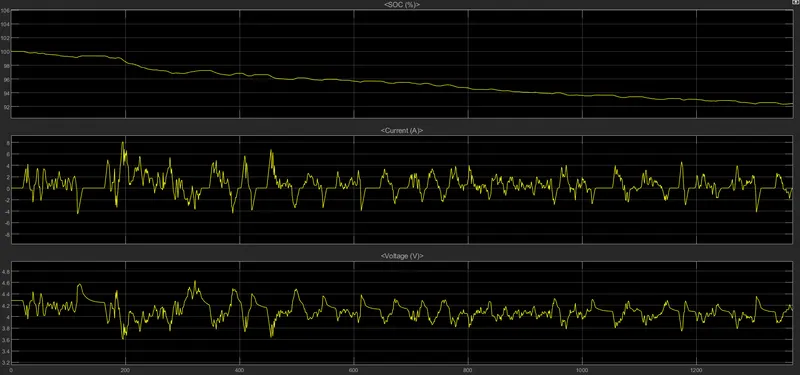
Fig13: (SOC,Current,Voltage) Vs. Time characteristics for datasheet parameters.
SOC gets reduced upto 92% within 1369 seconds of the cycle.
The minimum current achived is 0 A during minimum speed of the vehicle whereas the maximum current achived is 8 A during the maximum speed of the vehicle.
The negative values of the current represents the charging of the battery during regenerative braking of the vehicle.
The minimum voltage achived is 3.6 V during maximum speed of the vehicle whereas the maximum voltage achived is 4.65 V during the minimum speed of the vehicle.
The behaviour of the current and voltage under the maximum and minimum speed of the vehicle are contradictory.
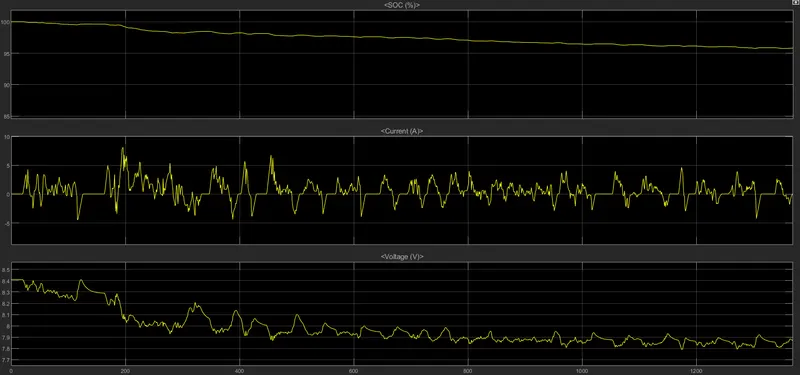
Fig14: (SOC,Current,Voltage) Vs. Time characteristics for default parameters.
SOC gets reduced upto 94% within 1369 seconds of the cycle.
The minimum current achived is 0 A during minimum speed of the vehicle whereas the maximum current achived is 8 A during the maximum speed of the vehicle.
The negative values of the current represents the charging of the battery during regenerative braking of the vehicle.
The minimum voltage achived is 7.8 V during maximum speed of the vehicle whereas the maximum voltage achived is 8.4 V during the minimum speed of the vehicle.
The behaviour of the current and voltage under the maximum and minimum speed of the vehicle are contradictory.
The behaviour of both the battery blocks (same battery with different parameters) is same under both conditions except the behaviour of the voltage.
In first battery pack of datasheet's parameters with rated nominal voltage 3.7 V the voltage keeps on increasing and decreasing (according to the speed of vehicle) nearby it's fully charge voltage of 4.25 V.
Whereas in second battery pack of default's parameters with rated voltage 7.2 V the voltage keeps on increasing and decreasing (according to the speed of vehicle) but not nearby it's fully charged voltage of 8.4 V.
This is because battery with the datasheet's parameters is of small capacity (3 Ah) which can be charged easily and rapidly upto it's fully charged voltage (4.25 V) whereas the battery with the default's parameters is of large capacity (5.4 Ah) which cannot be charges rapidly upto it's fully charged voltage.
Conclusion:
In this study we studied the behaviour of the Li-ion battery under default parameters and the parameters from the datasheet by using UDDS.