Study of frequency response analysis in matlab.
Questions:
1. a.) List all the MATLAB commands related to transfer function, pole-zero-gain and step response.
b.) Apply all the commands for the following transfer functions in MATLAB-
- For the motor load transfer function is-
`G=frac(Km)(Ts+1)`
where, Km=1.25
T=0.1
`G(s)=frac((1+0.02s)(1+0.025s))(s^3(1+0.005s)(1+0.001s))`
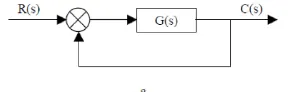
2. For the unity feedback system shown in figure below-
Determine the closed loop step response using MATLAB commands. Comment on the result.
`G(s)=frac(30(s^2-5s+3))((s+1)(s+2)(s+4)(s+5))`
3. Explain the MATLAB model ‘scdspeedctrl’. Comment on results for non-tuned PID gain values.
(Click here scdspeedctrl )
4. Answer the following-
a.) What is the importance of bode plot for control system design?
b.) Using MATLAB, make a bode plot of the following transfer functions. Determine the phase and gain margin, gain and phase crossover frequency and also comment on the stability in each case.
`G(s)=frac(1)((1+s)(1+2s))`
`H(s)=frac(1)(s(1+s)(1+2s))`
`K(s)=frac(10)(s(1+0.5s)(1+0.01s))`
`J(s)=frac(75(1+0.2s))(s^2(s+16s+100)`
Solution:
01.
a] List all the MATLAB commands related to transfer function, pole-zero-gain and step response.
Following commands are used in matlab for transfer function:
Function Command
tf Creates a transfer function in polynomial form.
pole Creates poles of the dynamic systems.
zero Zero and Gain of single input single output dynamic system.
pzmap Creates a pole-zero plot of the continuous or discrete-time dynamic system.
zpk Creates transfer function out of zero-pole-gain.
step Step response plot of the dynamic system.
bode Bode plot of frequency response or magnitude and phase data.
ss State space model.
b] Apply all the commands for the following transfer functions in MATLAB-
i]
`G(1)=frac(Km)(Ts+1)`
where, Km=1.25
T=0.1
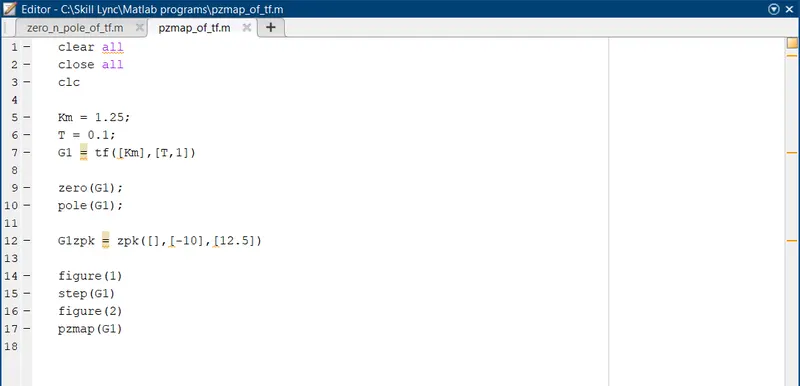
Fig01: Matlab script for plotting step response and pzmap of transfer function G1.
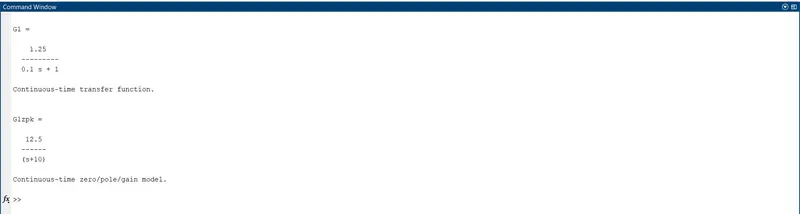
Fig02: Results for matlab script of transfer function G1.
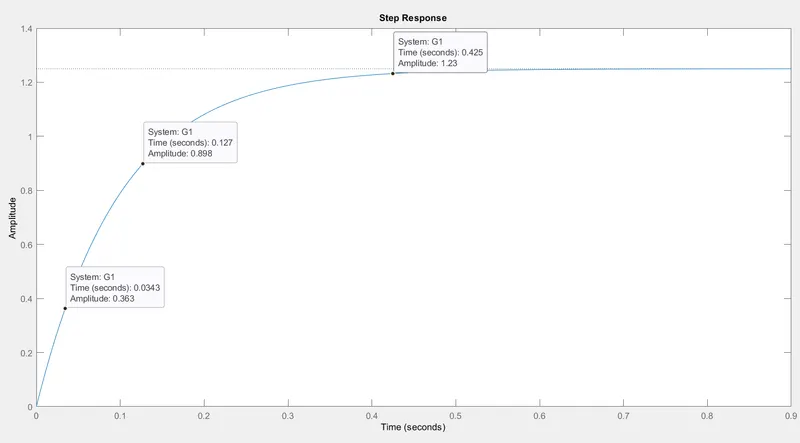
Fig03: Step response of transfer function G1.
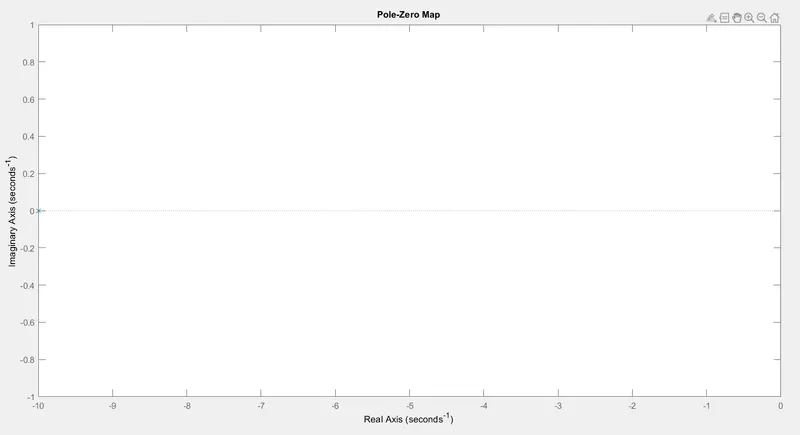
Fig04: pzmap of transfer function G1.
ii]
`G(2)=frac((1+0.02s)(1+0.025s))(s^3(1+0.005s)(1+0.001s))`
`G(2)=frac(0.0005s^2+0.027s+1)(5e^-6s^5+0.064s^4+s)`
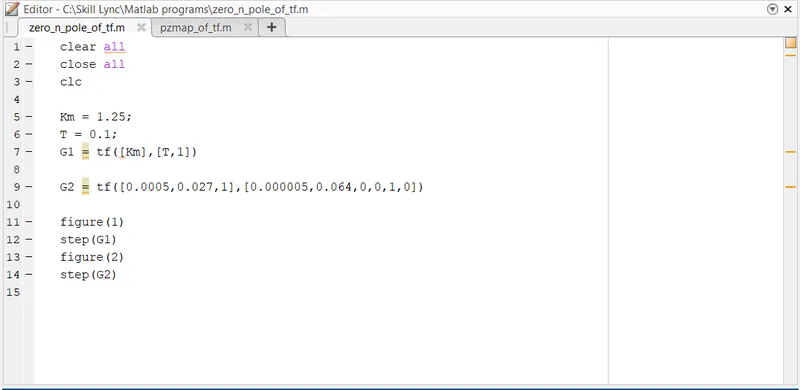
Fig05: Matlab script for plotting step response of transfer functions G1 and G2.
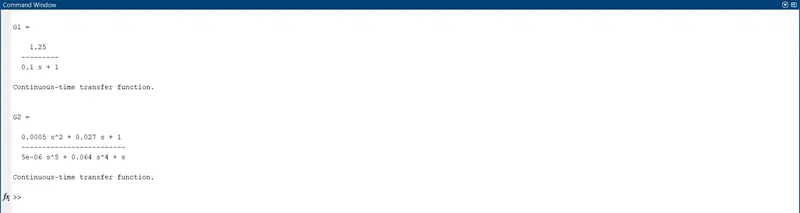
Fig06: Results of matlab script for plotting step response of transfer functions G1 and G2.
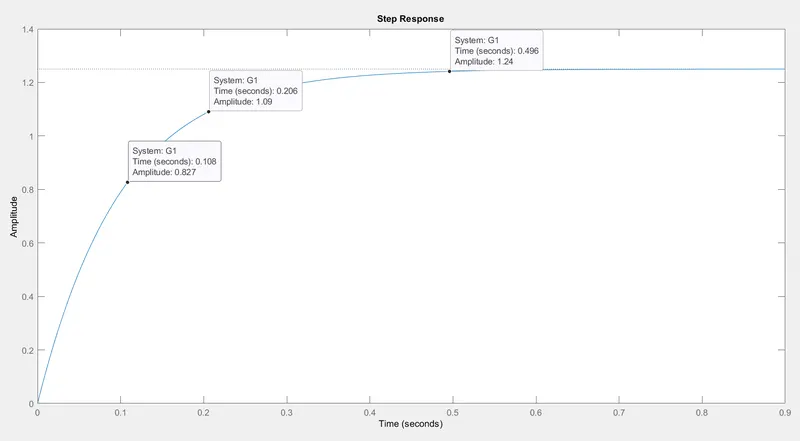
Fig07: Step response of transfer function G1.
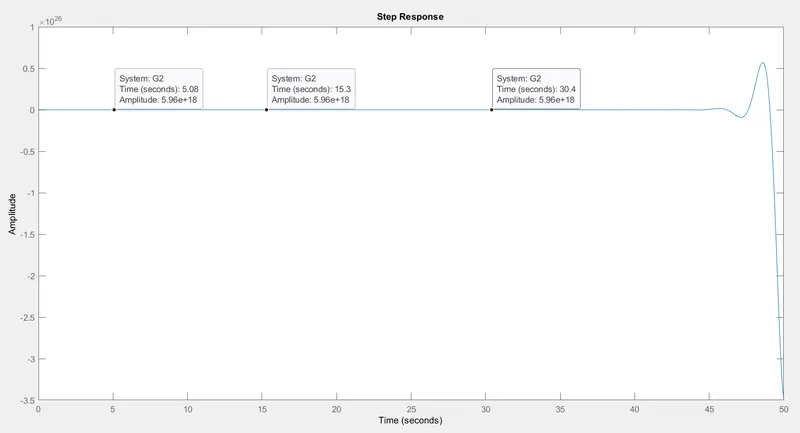
Fig08: Step response of transfer function G2.
02.
Determine the closed loop step response using MATLAB commands.
`G(s)=frac(30(s^2-5s+3))((s+1)(s+2)(s+4)(s+5))`
Numerator:
`30(s^2-5s+3)=30s^2-150s+90`
Denominator:
i.
`(s+1)(s+2)=s^2+2s+s+2`
`=s^2+3s+2`
ii.
`(s^2+3s+2)(s+4)=s^3+4s^2+3s^2+12s+2s+8`
`=s^3+7s^2+14s+8`
iii.
`(s^3+7s^2+14s+8)(s+5)=s^4+5s^3+7s^3+35s^2+14s^2+70s+8s+40`
`=s^4+12s^3+49s^2+78s+40`
Therefore,
`G(s)=frac(30s^2-150s+90)(s^4+12s^3+49s^2+78s+40)`
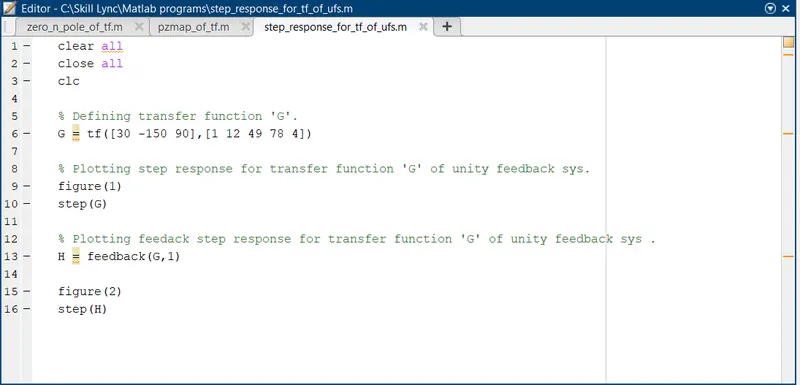
Fig09: Matlab script for plotting step response of transfer function G(s).
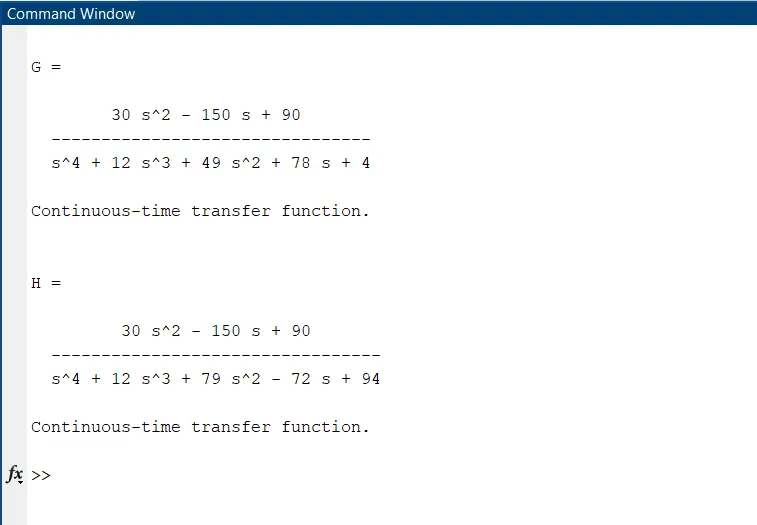
Fig10: Results of matlab script for plotting step response of transfer function G(s).
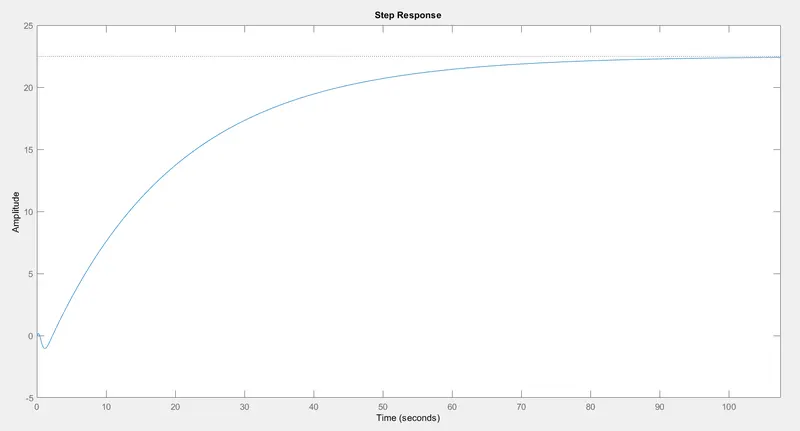
Fig11: Step response of transfer function G(s).
- Peak response reaches a maximum of around 20.10 amplitude.
- System took approximately 100 seconds as a settling time.
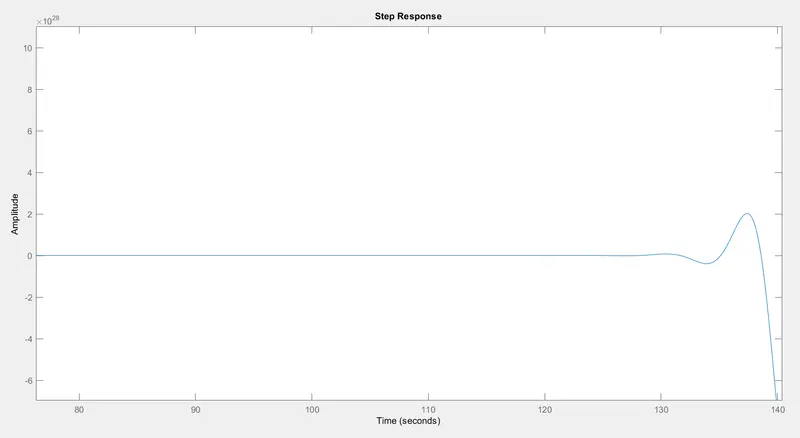
Fig12: Feedback step response of transfer function G(s).
- With the feedback, the system was unstable and it's difficult to find the characteristic points.
- Using PID tune command in matlab we can optimize the system to be more stable.
3. Explain the MATLAB model ‘scdspeedctrl’. Comment on results for non-tuned PID gain values.
- This model represents an engine speed controlsetup with feedback loop.
- Represents all the processes of how the engine produces a torque i.e. as the throttle pressed , air flows in-->spark ignition-->combustion takes place-->power stroke produces torque-->subtracted from load torque to get net torque-->converted to engine speed.
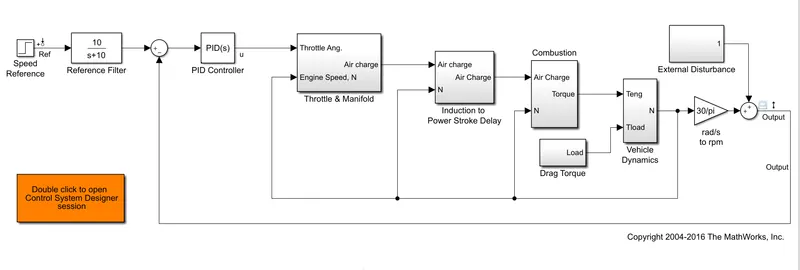
Fig13: Simulink model for 'scdspeedctrl'.
- In the above Engine speed control model, all the blocks are connected in series.
- The major blocks are Speed reference, PID controller, Throttle and Manifold, Power stroke, Combustion, Drag Torque, Vehicle dynamics and finally Output.
- A feedback loop is also present in the system which measures the output speed and gives feedback again to the PID controller.
- In the model, an additional scope is attached to the input reference speed in order to view the input speed.
1. Throttle and Manifold Subsystems:
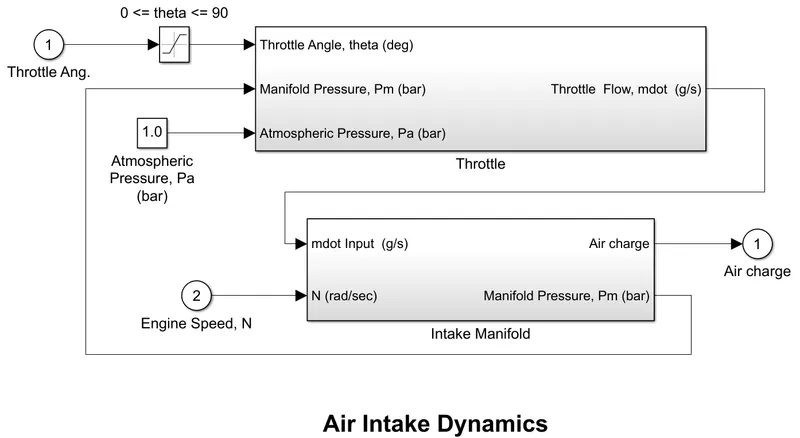
Fig14: Throttle and Manifold subsystem.
- The throttle block takes three inputs which include throttle flow(throttle angle), manifold pressure from the intake manifold and an atmospheric pressure of 1 bar.
- Inside the throttle block, it performs a series of calculations to find the output throttle flow and this value is sent to the engine intake manifold along with the engine speed to obtain the air charge which is given to the power stroke block and manifold pressure which is feedback to the throttle block.
- The power stroke delay block takes the air charge and the speed (final output) as feedback to provide a certain delay to the input.
2. Induction to Power stroke delay and Combustion subsystem:
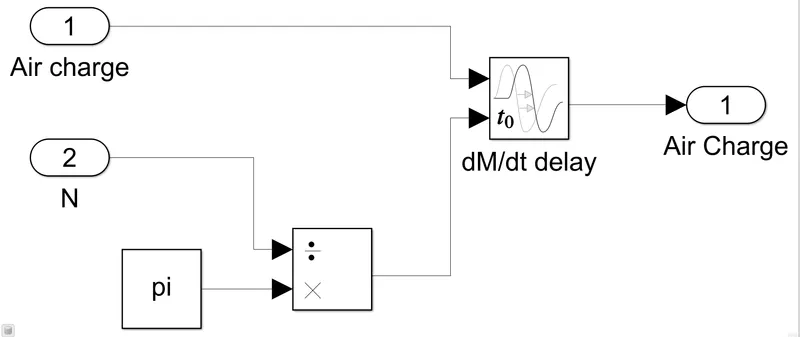
Fig15: Induction to Power Stroke Delay subsystem.
- The power stroke delay block takes the air charge and the speed (final output) as feedback to provide a certain delay to the input.
3. Combustion:
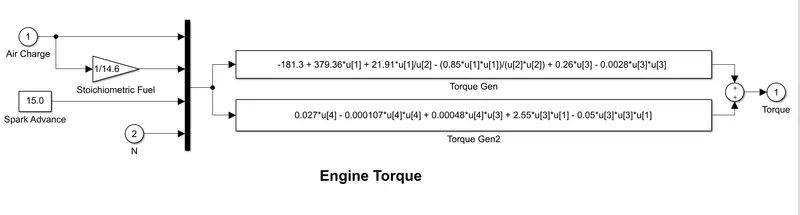
Fig16: Combustion subsystem.
- The air charge value is converted into the fuel terms with the use of stoichiometric fuel constant along with the feedback used to find the engine torque.
4. Vehicle Dynamic subsystem:
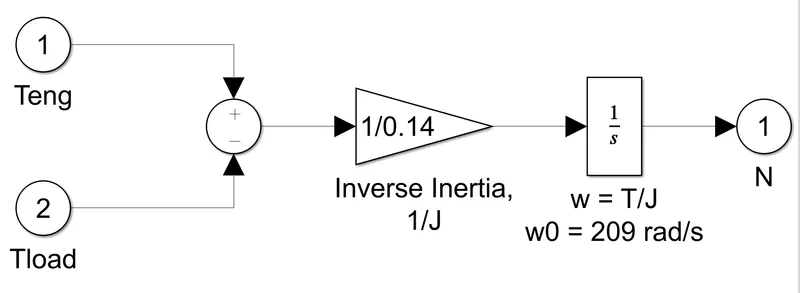
Fig17: Vehicle Dynamic subsystem.
- From the engine troque, the load torque is subtracted and this value is divided by the inertia and is feed to the integrator block.
- The integration is done in order to find the value of engine speed.
- The output speed and this calculated speed is given as input to the PID controller.
- The PID controller controls the speed of the engine with the help of the reference speed given as input in the form of a step function.
PID Non-Tuned response:
- The speed control model is opened and using the default values the model is simulated.
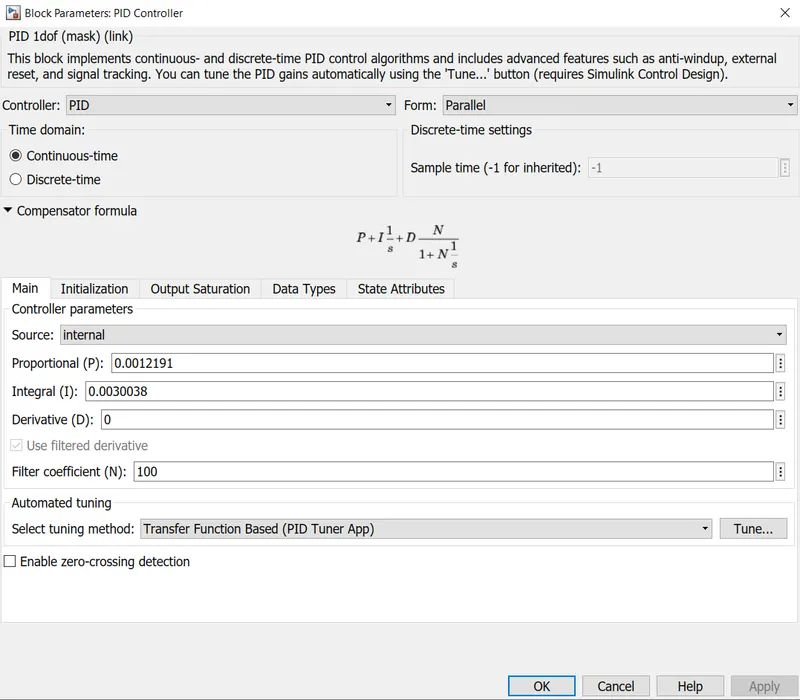
Fig18: PID controller default parameters and untuned.
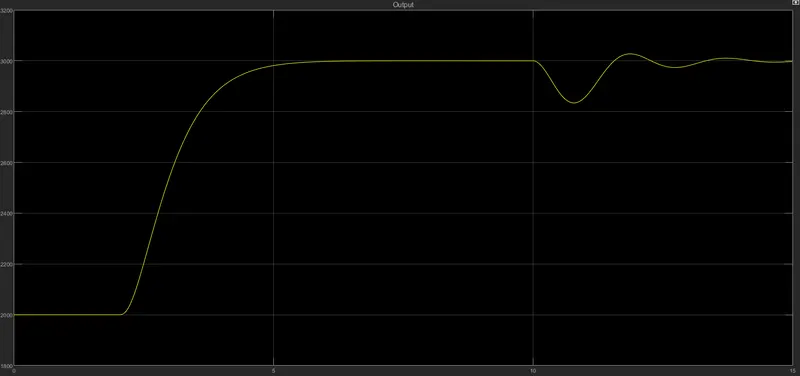
Fig19: Output result without tuning the PID controller.
- The rise time is high which indicates that the response time to react according to the input response is high.
- From above figure it is clear that actual output response requires minimum 5 seconds to reach 3000.
- For better operating behaviour we will have to tune the PID controller.
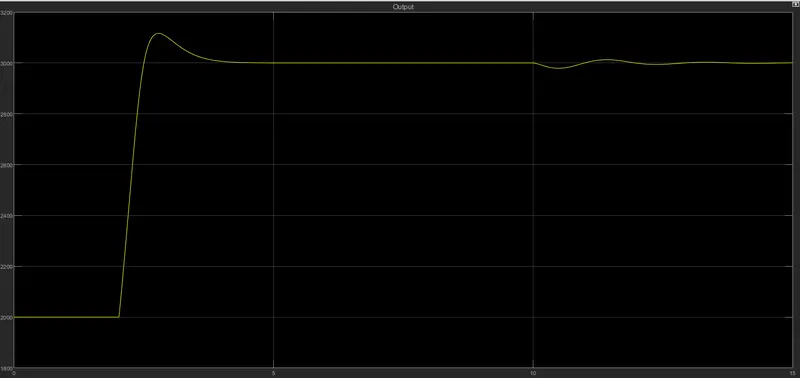
Fig20: Output result with tuning the PID controller.
- After tuning the response time is reduced rapidly and it almost tries to cope up with the input reference speed.
- To reduce the overshoot and best response time fine tuning of the controller is required.
4. Answer the following-
a]. What is the importance of bode plot for control system design?
Frequency response analysis of the control systems can be carried after either analytically or graphically. The various graphical techniques available for frequency analysis are:
- Bode plot
- Root locus
- Polar plot
- M and N circles
- Nichols chart
Bode plot:
Bode plots are usually drawn for open-loop systems. From the open-loop plot, the performance and stability of the closed-loop systems are estimated. Frequency response plots are used to determine the frequency domain, to study the stability of the systems and adjust the gain of the system to satisfy the desired specifications. In control engineering, a bode plot is the frequency response of the system represented by using two sub-plots-Magnitude plot (expressing the magnitude in decibels) and the phase plot (expressing the phase shift in degrees).
Determining the stability of the system using the Bode plot:
The stability of the control system is defined as the ability of the any system to provide a bounded output when a bounded input is applied to it. More specially we can say that stability allows the system to reach the steady-state and remain in that state for that particular input even after the variation in the parameters of the system.
The stability of the system using a bode plot can be expressed in terms of gain margin and phase margin.
Gain margin:
Greater will be the gain margin greater will be the stability of the system. It refers to the amount of gain, which can be increased or decreased without making the system unstable. It is expressed in db.
Phase margin:
Greater will be the phase margin greater will be the stability of the system. It refers to the phase, which can be increased or decreased without making the system unstable. It is expressed in degree.
Body stability criterion:
The stability conditions are given below:
- For a Stable system: Both the margins should be positive or the phase margin should be greater than the gain margin vor the system to be stable.
- For Marginal Stable system: Both the gain and phase margins should be zero or the phase margin should be equal to the gain margin then the system is said to be marginally stable.
- For Unstable system: If either of the phase or gain margin is negative or the phase margin is less than the gain margin then the system is unstable.
Advantage of the Bode plot:
- It is based on the asymptotic approximation, which provides a simple method to plot the logarithmic magnitude curve.
- The multiplication of various magnitude that appears in the transfer function can be treated as an addition, while the division can be treated as substraction as we are using logarithmic scale.
- With the help of this plot, we can directly comment on the stability of the system without doing any calculations.
- Bode plot provides a relative stability in terms of gain margin and phase margin.
- It also covers from low frequency to high frequency range.
b]. Using MATLAB, make a bode plot of the following transfer functions. Determine the phase and gain margin, gain and phase crossover frequency and also comment on the stability in each case.
- `G(s)=frac(1)((1+s)(1+2s))`
- `H(s)=frac(1)(s(1+s)(1+2s))`
- `K(s)=frac(10)(s(1+0.5s)(1+0.01s))`
- `J(s)=frac(75(1+0.2s))(s^2(s+16s+100)`
clear all
close all
clc

figure(1)
G = tf([1],[2 3 1])
bode(G)

[Gm,Pm,Gcw,Pcw] = margin(G)

if (Gm && Pm > 0) || (Pm>Gm)
disp ('The system is stable')
end

if (Gm && Pm == 0) || (Pm==Gm)
disp ('The system is marginally stable')
end

if (Pm < 0) || (Pm>Gm)
disp ('The system is unstable')
end

figure(2)
H = tf([1],[2 3 1 0])
bode(H)

[Gm,Pm,Gcw,Pcw] = margin(H)

if (Gm && Pm > 0) || (Pm>Gm)
disp ('The system is stable')
end

if (Gm && Pm == 0) || (Pm==Gm)
disp ('The system is marginally stable')
end

if (Pm < 0) || (Pm>Gm)
disp ('The system is unstable')
end

figure(3)
K = tf([10],[0.005 0.51 1 0])
bode(K)

[Gm,Pm,Gcw,Pcw] = margin(K)

if (Gm && Pm > 0) || (Pm>Gm)
disp ('The system is stable')
end

if (Gm && Pm == 0) || (Pm==Gm)
disp ('The system is marginally stable')
end

if (Pm < 0) || (Pm>Gm)
disp ('The system is unstable')
end

figure(4)
J = tf([15 75],[17 100 0 0])
bode(J)

[Gm,Pm,Gcw,Pcw] = margin(J)

if (Gm && Pm > 0) || (Pm>Gm)
disp ('The system is stable')
end

if (Gm && Pm == 0) || (Pm==Gm)
disp ('The system is marginally stable')
end

if (Pm < 0) || (Pm>Gm)
disp ('The system is unstable')
end
Explanation:
- We rewrite the transfer function in matlab using the command tf([num], [deno]) and assigning the variable to it.
- To plot Bode for a particular transfer function, we used the command bode(). Inside bracket writing the variable assigned to transfer function. Ex: bode(G).
- Gain magnitude (Gm), Phase magnitude (Pm), Gain crossover frequency (Gcw), Phase crossover frequency (Pcw) are determined by using command margin(G).
- Later we wrote 'if' conditioncondition to display whether the transfer function of system is stable or unstable.
- Same script is written for the remaining three transfer function but their stability changes according to the system their transfer functions.
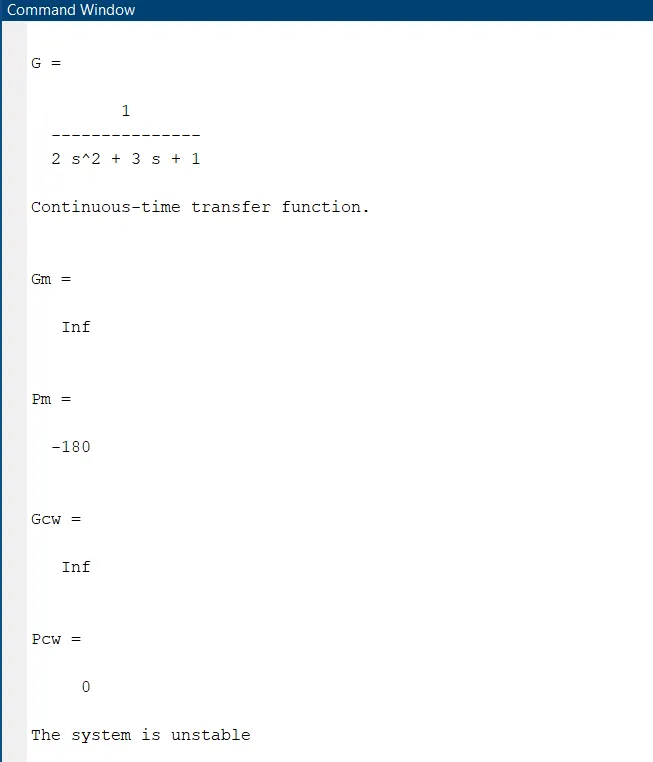
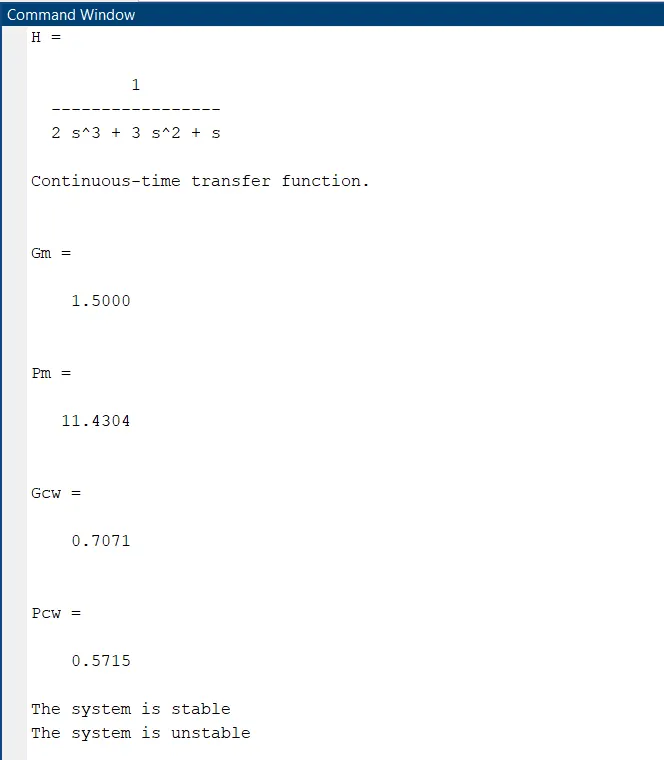
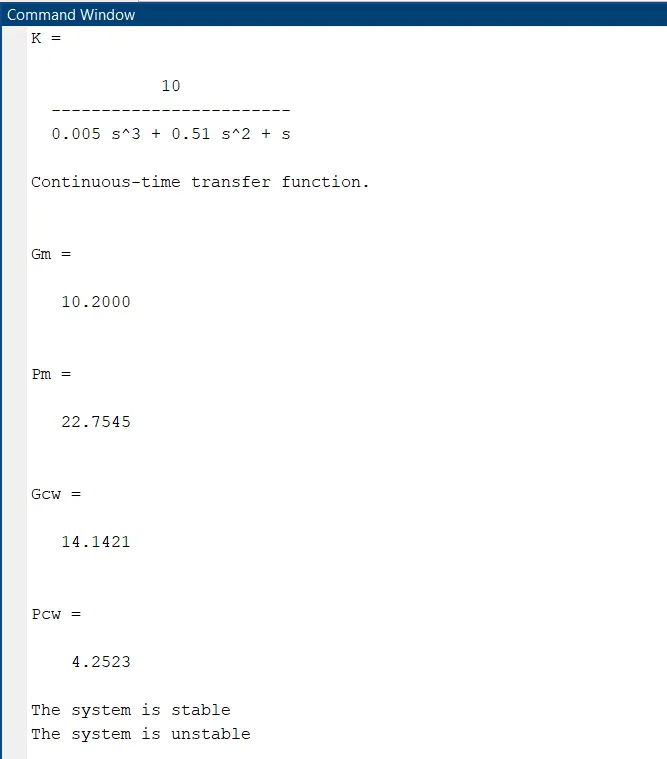
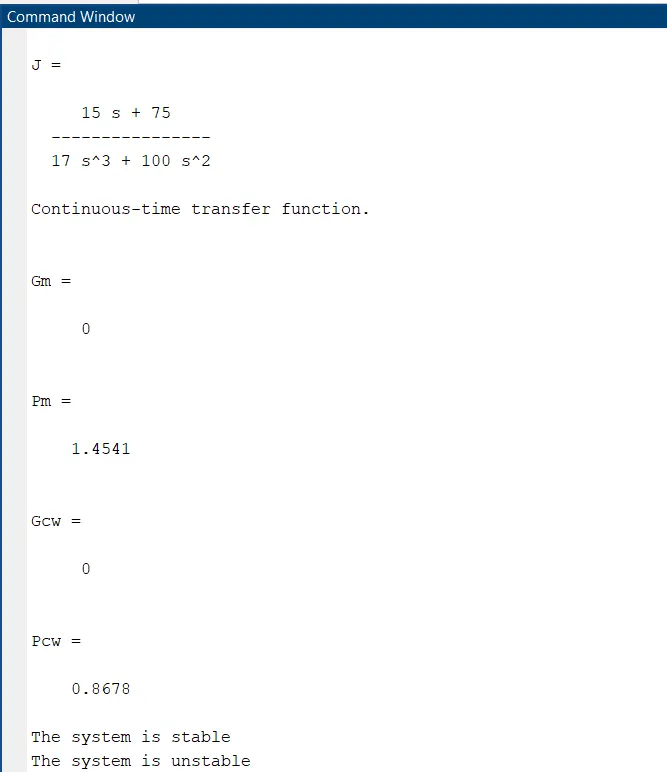
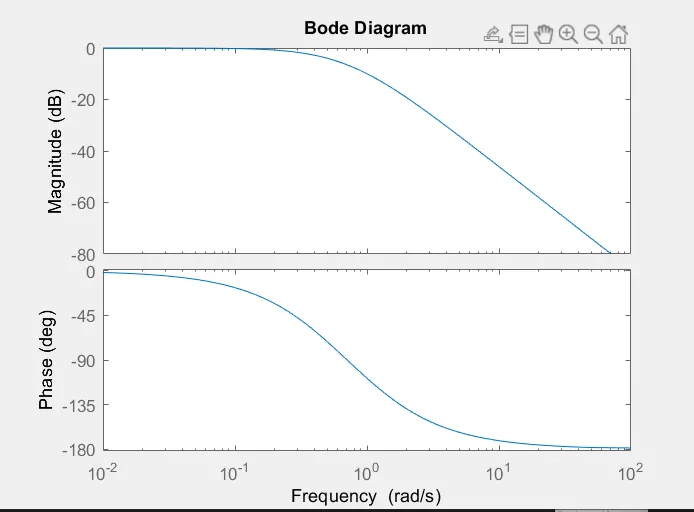
Fig21: Bode plot for transfer function G.
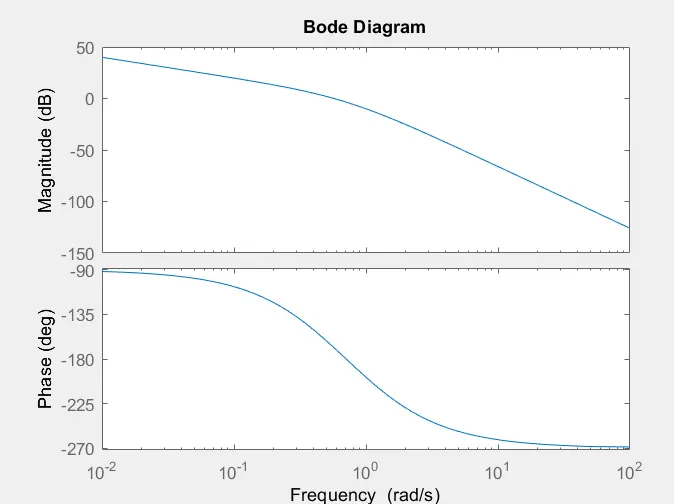
Fig22: Bode plot for transfer function H.
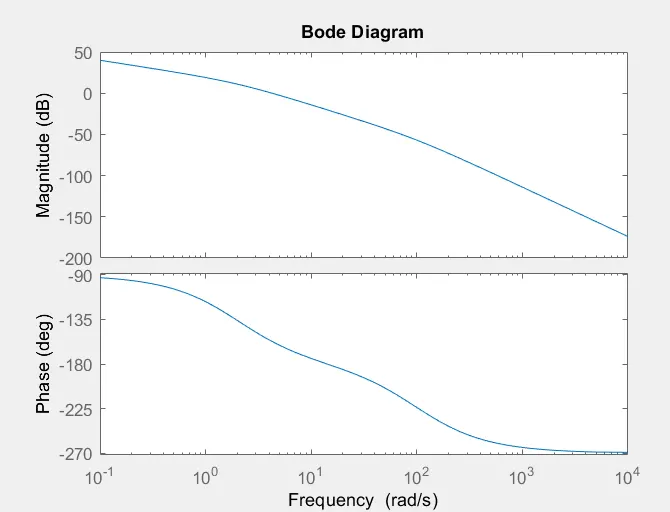
Fig23: Bode plot for transfer function K.
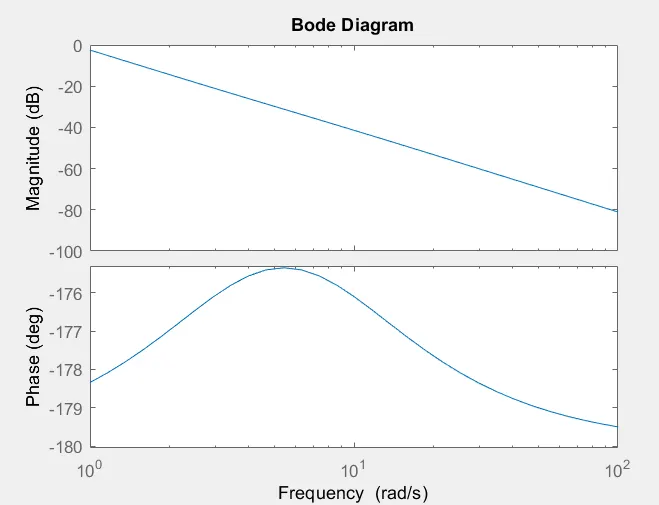
Fig24: Bode plot for transfer function J.