Structural dynamics
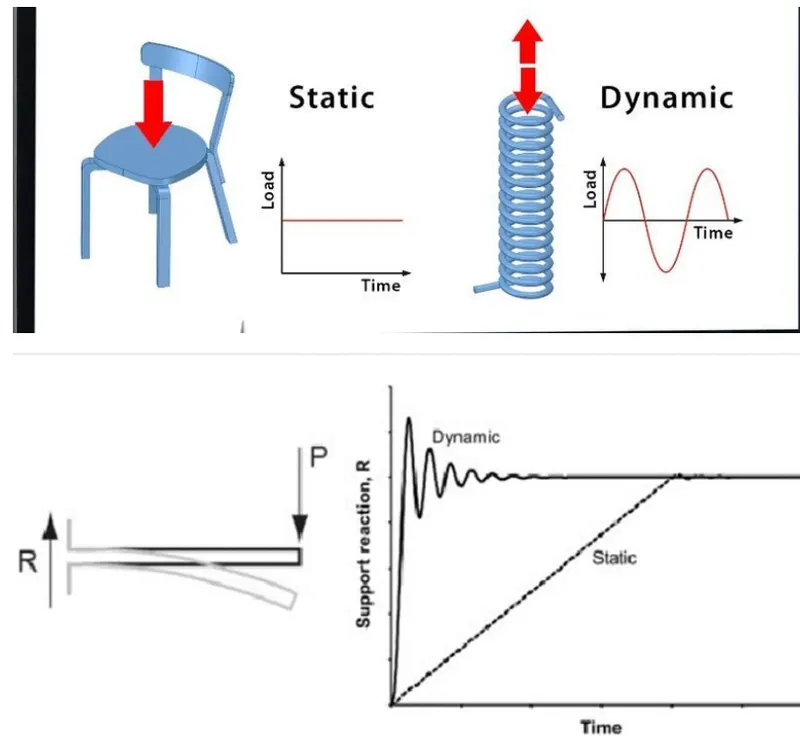
1.Difference between static analysis and dynamic analysis
| Static analysis | Dynamic analysis |
| Load is not variable with timeand negelected due to slow applying of load | Load is variable with time due to fast applying load and vibration |
| Motion of the structure is disregarded | Motion can not be diaregarded |
| There is no necessity to count inertia and daming force in case of static analysis but elastic force should be accounted | Inetria and damping force should be accouted for calculation of dynamic analysis |
| There is no effect on static analysis | Inertia effect is considered in the dynamic analysis |
2.
1.Elastic behavior
- It can be defined as ability of components to return to it's original shape and position when an application of external loading is removed.
- The explanation is that any components under loading like compression and tension loses its original shape and tend to act according to load and when load is removed the components restore to it's original shape
- Linear system be express as
fs=ku
where ku=lateral stiffness constant.
2.Inelastic behavior
- It can be defined as inability of the material to return to it's original shape when load is removed and tend to be in the deformed shape
- The materials undergone deformation acts opposite to elastic behavior hence called inelastic behavior
3.Plastic behavior
- The property of materials which has the deformed shape and permanent starin in it when loading is removed is called plastic behavior of the material
- The plastic behavior of the structure occurs beyond yeild point of the structure and deformation is irreversible even when loading is removed
- It occurs beyond point a after unloading and represented in curve
4.Non linear inelastic behavior
- When large deformation occurs at materials the force displacement relationship of materials become non linear
- Force cooresponding to displacement is not single value in non linear behavior and depends on history deformation of materials
- For non linear system force can be represented as fs=(u,v)
- The bend form o to a represents the non linear
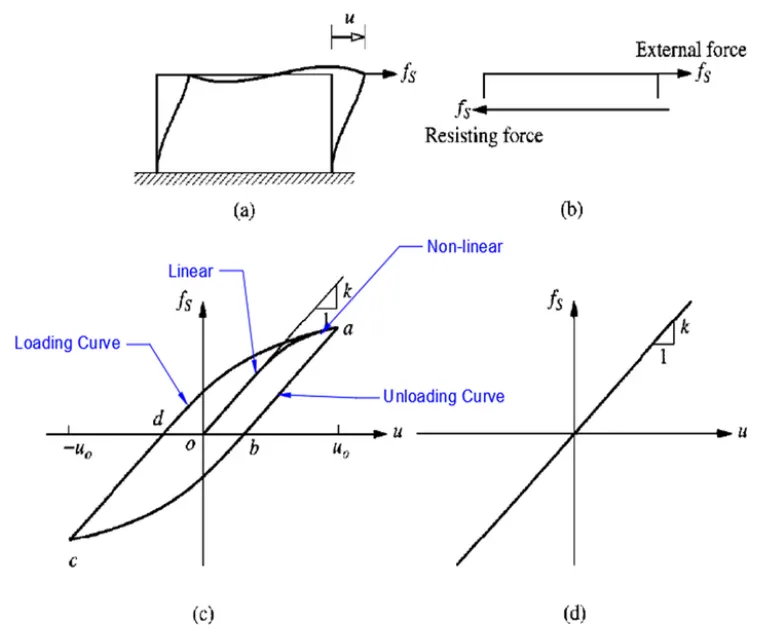
The above graph represents the behaviourial of above mentioned Systems and graph obtained is based on cyclic loading and unloading
3.
Mass components
- The roof mass without stiffness or damping force
- The mass components in equation of motion consider only mass of frame and stiffness and damping are considered to neglected
- The external force fi on mass components is related to the acceleration by
fi=mu''
mu"+fd+fs=P(t)
mu"+cu'+ku=P(t)
Stiffness components.
- The frame without damaging or mass
- The external force fs on stiffness components is related to displacement u
- The rigidity of the material to resist deformation is called as stiffness and in this components only stiffness is considered in the frame and other mass and damping components are neglected
fs=ku if stiffness is linearly elastic
Damping components
- Damping is dissipation of energy due to vibration over a time and distance
- It occurs due to friction between structural and bon structural components
- Frame with its damping property but no stiffness or mass the external force on damping components is related to velocity
fd=cv=cu'
4.The relationship between natural period and natural frequency
Natural period of vibration of the system (Tn)
- The time required for undamped system to complete one cycle of free vibration
- Unit of natural period in second
- It is related to natural circular frequency of vibration w in unit is radian per second.
Tn = 2π/ωn where w=2n/Tn
Natural cyclic frequency of vibration of the system
- The number of cycle or one complete revolution executed by Systems in one second.
- It is measure in Hz
Tn=1/Tn
Natural vibration properties and,Tn and fn depend only on mass and stiffness of structure
k=mw^2
5.
Response spectrum
- It is concept of charctestierzing the ground motion and their effects on Structure of different time period Tn .
- A plot of the peak value of response activity (u,v,a) as function of natural vibration period Tn of Systems is called response spectra
- The peak response of all linear singly degree of freedom system can be computed by response spectra plot
- Three types of plot generally plotted with u and Tn as deformation response spectra and a similar plot is done with u* as Relative velocity spectrum and with u* as acceleration response spectrum
- Each plot is done with fixed damping ratio and several such plot with different damping ratio are created for the range of damping values encountered in the structures
Deformation response spectrum
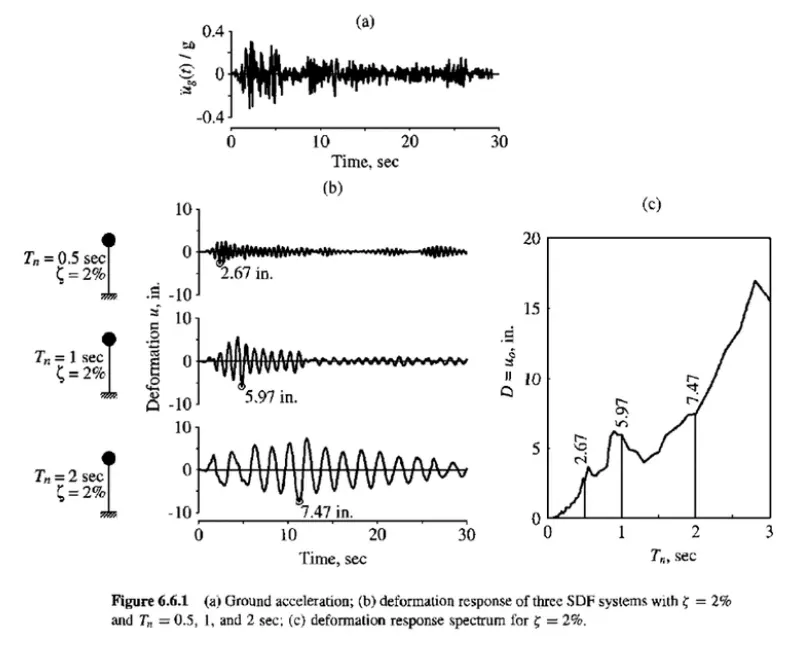
The above image contain the plot with deformation w.r.t time. The first plot (a) represent the ground acceleration recorded during the earthquake .The second plot (b) represent the plot of deformation response of 3 independent SDF system. In each plot of b has been done with fixed damping ratio as 2% and vibration in naturaltime period as 0.5s, 1s, 2s and corresponding deformation are obtained w.r.t time .Finally a plot of recorded dim and Tn is done to record the peak responses.So which can be time period of vibration the deformationof the system can be obtained which can be further used for the analysis of structure
Pseudo acceleration response spectrum:
- Pseudo acceleration for an single degree of freedom system with natural frequency ωn is related to its peak deformation D = uo, due to earthquake ground motion
A = (ωn^2) * D = ((2π/Tn)^2) * D.
- The D here represents relative deformation and not total deformation hence, the acceleration obatained is relative so, it is called as pseudo acceleration.
- The quantity A has units of acceleration and it is related with base shear Vbo.
Vbo = fso = mA (or) Vbo = (A/g)*ω.
- In this formula A/g is base shear coefficient which is acceleration divided by gravitational force. So multiplying this with total mass of the structure provides total base shear or equivalent static force which can be used for analysis of the structure.
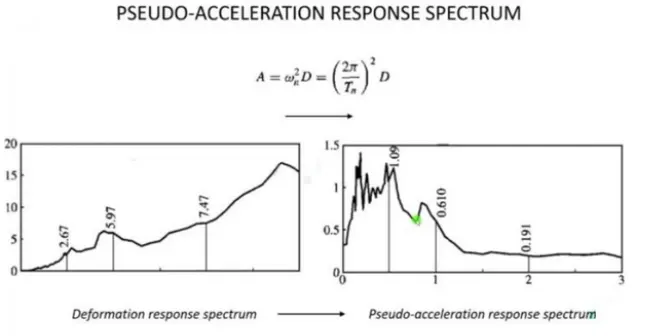
The above graphical represents the graphic diffrence between Deformation sepecta and pseudo acceleration spectra.Pseudo acceleration can be calculated by multiplying deformaion with natural circular frequency of vibration at any instant of time