Structural dynamics
1. Differentiate Static analysis and Dynamic analysis with proper representing pictures (30 marks)
Static analysis can only be performed if the system being simulated does not depend on time, and if the loads being applied are constant. In a dynamic analysis, the system itself, the load application, or both might change with time.
In a dynamic analysis, the inertial loads developed by the system due to acceleration are taken into account. Static analyses don’t consider inertia.
The variation of load with time. And the motion cannot be disregarded. The inertia and damping forces and be added.
2. Explain the following with a relevant force-displacement graph (40 marks)
- Elastic behavior
- Inelastic behavior
- Plastic behavior
- Non-linear Inelastic behavior
Elastic Behavior:
When an external force is applied, these particles are displaced, resulting in the deformation of the solid. When the application of the deforming force is stopped, interatomic forces drive the atoms to regain their state of equilibrium.
Inelastic behavior:
As illustrated in Figure 1, the equal displacement rule states that inelastic peak displacements (u p) remain almost the same as elastic peak displacement (u el) whatever the selected yield strength (F y =F el /R or yield displacement u y =u el /R) of the structure
Plastic behavior
Below the elastic limit, the material exhibits elastic behaviour Above the elastic limit, the material exhibits plastic behaviour Elastic deformation occurs in the ‘elastic region’ of the graph. The extension is proportional to the force applied to the material (straight line
Non-linear Inelastic behavior
A graph showing force vs. displacement for a linear spring will always be a straight line, with a constant slope. A nonlinear spring has a nonlinear relationship between force and displacement. A graph showing force vs. displacement for a nonlinear spring will be more complicated than a straight line, with a changing slope.
3. Explain Mass, Stiffness & Damping components in the equation of motion (30 marks)
The SODF system can be viewed as a combination of 3 Independent systems:
1. Stiffness component: The frame without damping or mass, The external forces fs on the stiffness component are related to displacement u by fs=ku if the system is linearly elastic.
The damping component: The drama with its damping property but no stiffness or mass. The external force on the damping component is related to velocity by fb=cv.
The mass component: The roof mass without the stiffness or damping of the frame. The external force fi on the mass component is related to the acceleration by fi=mu.
4. Provide the relationship between Natural period (Tn) & Natural frequency (f) and provide their definitions (25 marks)
Tn Natural period of vibration: of the system the time required for the undamped system to compete for one cycle of free vibration(Unit is seconds)
It is related to the natural circular frequency of vibration wm, in units of radians per second.
Natural cyclic frequency of vibration of the system-the number of cycles (or one complete revolution) executed by the system in 2 sec (unit is hertz)
The natural vibration: The properties wn, Tn, and fn, depend only on the mass and stiffness of the structure.
The stiffness of two SDF systems having the same mass will have a shorter natural period and a higher natural frequency.
Similarly, the heavier of two structures having the same stiffness will have the longer natural period and the lower natural frequency.
5. Explain in detail about Response spectrum & its Graph (25 marks)
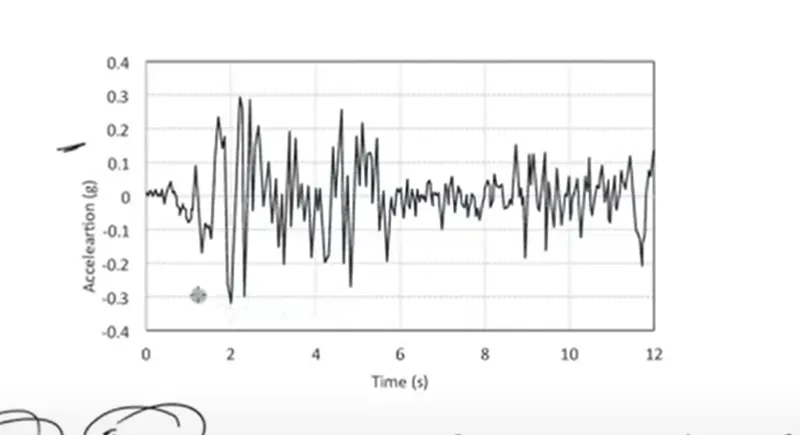
It is a central concept in earthquake engineering, response spectrum is a practical means of characterizing ground motions and their effects on structures of different Tn
It provides a convenient means to summarize the peak response of all possible linear SDF systems to a [articular component of ground motion.
It also provides a practical approach to applying the knowledge of structural dynamics to the design of structures and the development of lateral force requirements in building codes.
A plot of the peak value of response quality (u,v, a ) as a function of the natural vibration period Tn of the system, is called the response spectrum for that quality.