Structural dynamics
1. Differentiate Static analysis and Dynamic analysis with proper representing pictures
Structural analysis is mainly concerned with finding out the behavior of a physical structure when subjected to force. This action can be in the form of load due to the weight of things such as people, furniture, wind, snow, etc. or some other kind of excitation such as an earthquake, shaking of the ground due to a blast nearby, etc. In essence all these loads are dynamic, including the self-weight of the structure because at some point in time these loads were not there. The distinction is made between the dynamic and the static analysis on the basis of whether the applied action has enough acceleration in comparison to the structure's natural frequency. If a load is applied sufficiently slowly, the inertia forces can be ignored and the analysis can be simplified as static analysis. Structural dynamics, therefore, is a type of structural analysis which covers the behavior of structures subjected to actions having high acceleration . Dynamic loads include people, wind, waves, traffic, earthquakes, and blasts. Any structure can be subjected to dynamic loading. Dynamic analysis can be used to find dynamic displacements, time history, and modal analysis.
A dynamic analysis is also related to the inertia forces developed by a structure when it is excited by means of dynamic loads applied suddenly (e.g., wind blasts, explosion, earthquake).
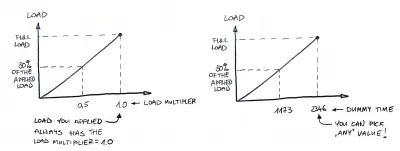
A static load is one which varies very slowly. A dynamic load is one which changes with time fairly quickly in comparison to the structure's natural frequency. If it changes slowly, the structure's response may be determined with static analysis, but if it varies quickly relative to the structure's ability to respond, the response must be determined with a dynamic analysis.
2. Explain the following with relevant force-displacement graph (40 marks)
- Elastic behavior
- Inelastic behavior
- Plastic behavior
- Non-linear Inelastic behavior
ELASTIC BEHAVIOR:-
Inelastic behavior: Force-deformation relations for typical structures undergoing cyclic deformations .The initial loading curve is nonlinear at the larger amplitudes of deformation, and the unloading and reloading curves differ from the initial loading
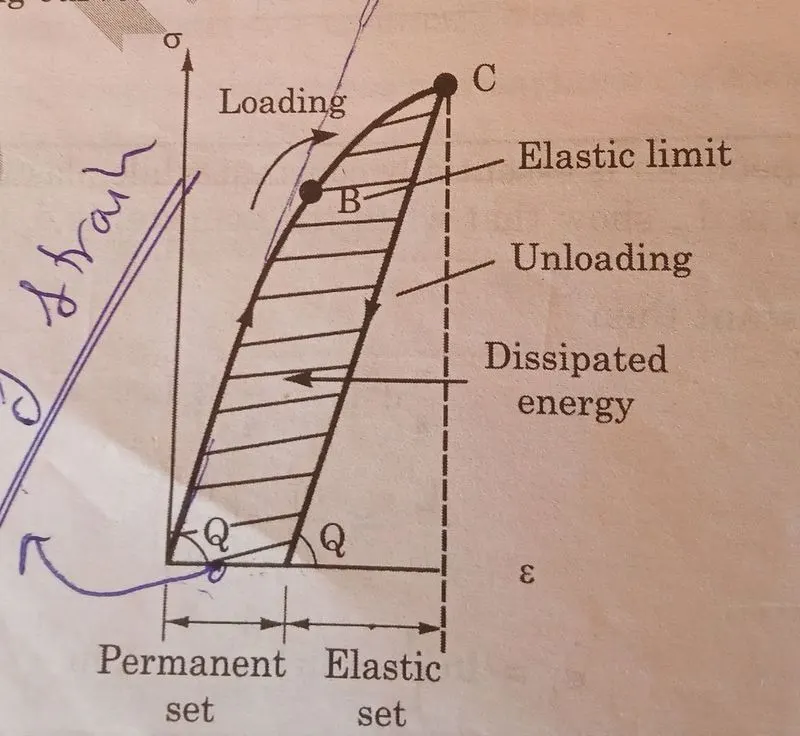
Plastic behavior; if applied force is greater then elastic limitt omatireal is not retrun to it original position .
Non-linear Inelastic behavior:-if material is stressed beyond elastic limit and than unloaded it will have a residual strain and the unloading curve will be diffrent from the origional loading curve the unloading curve will be parallel to the intial portion of the loading curve
3. Explain Mass, Stiffness & Damping components in the equation of motion
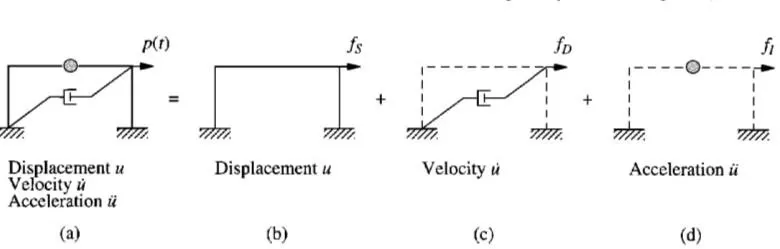
based on an alternative viewpoint. Under the action of external force p(t) the state of the system is described by displacement u(t), velocity u(t), and acceleration ü(t) Now visualize the system as the combination of three pure components:
(1) the stiffness component: the frame without damping or mass
(2) the damping component: the frame with its damping property but no stiffness or mass
(3) the mass component: the roof mass without the stiffness or damping of the frame .
The external force fs on the stiffness component is related to the displacement u by eqation if the system is linearly elastic, the external force fp on the damping component is related to the velocity ù and the external force fr on the mass component is related to the acceleration by fi mü. The external force p(t) applied to the complete system may therefore be visualized as distributed among the three components of the structure, and fs + fo+fi must equal the applied force p(t) leading to Eq. this alternative viewpoint may seem unnecessary for the simple system of
4. Provide relationship between Natural period (Tn) & Natural frequency (f) and provide their definitions.
5. Explain in detail about Response spectrum & its Graph
Response spectrum plot gives the maximum response (that maybe maximum displacement, maximum velocity, maximum acceleration, or any other parameter of interest) to the natural frequency (or natural period) subjected to specified excitation for linear single degree of freedom system oscillators. These plots are subjected to specific damping and it changes as damping changes.
The response spectral values are dependent on various factors like,
- Soil condition
- Energy release mechanism
- Damping in the system
- Epicentral distance
- Focal depth
- Richter magnitude
- Time period of the system
The construction of Response Spectrum requires the solution of a single degree of freedom systems, for a sequence of natural frequency values and damping ratio in the range of interest. Every solution provides only one point (with the maximum value) of the response spectrum. All of these maximum response values are plotted against natural frequency to construct a single response spectrum.Since a large number of systems must be analyzed in order to fully plot each response spectrum, the task is lengthy and time-consuming. But once these curves are constructed and available for the excitation of interest, the analysis for the design of structure subjected to dynamic loading is reduced to a very simple calculation of the natural frequency of the system and the use of response spectrum to calculate the maximum response.These response spectrum plots are created for specific areas of regions and different for different regions. The study of geographic areas combined with an assessment of historical earthquakes allows geologists to determine seismic risk and to create seismic hazard map for respective areas, which show the likely maximum response values to be experienced in a region during an earthquake.