Structural dynamics
1. Differentiate Static analysis and Dynamic analysis with proper representing pictures
Ans:
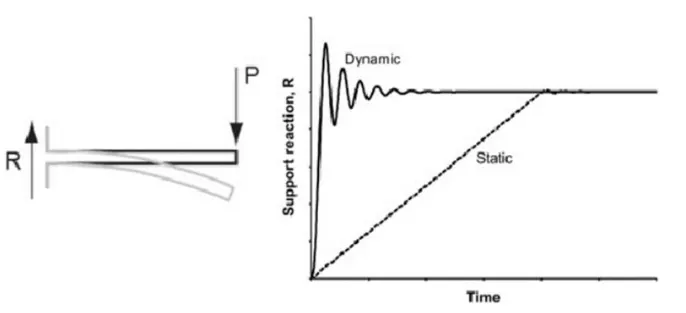
In the structural engineering field, static analysis and dynamic analysis are two distinct methods used to assess the behaviour and stability of structures.
Here's a differentiation between these two approaches:
Static Analysis:
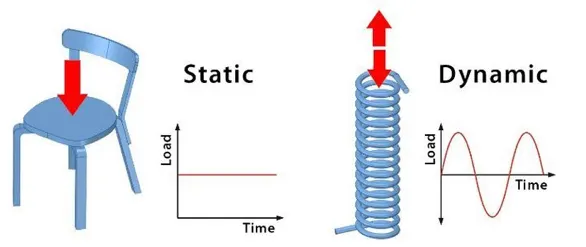
Static analysis in structural engineering involves studying the behaviour of a structure under static, or non-moving, loads. It is typically used to determine how a structure will respond to steady loads, such as the weight of the building itself, occupants, and furniture. The static analysis does not consider dynamic forces like wind, earthquakes, or vibrations.
Key Characteristics of Static Analysis in Structural Engineering:
- Examines the response of a structure to steady, unchanging loads.
- Primarily used for assessing gravity loads, such as the weight of the structure and its contents.
- Assumes that loads remain constant and do not change over time.
- Provides information about the equilibrium and stability of the structure under static conditions.
- Typically used for design and analysis of standard building structures.
Dynamic Analysis:
Dynamic analysis, on the other hand, involves studying how a structure responds to dynamic or time-varying loads. This type of analysis is crucial for assessing the behaviour of structures during events like earthquakes, wind gusts, vehicle traffic, and vibrations caused by machinery. Dynamic analysis considers the time-dependent forces and their effects on the structure's response.
Key Characteristics of Dynamic Analysis in Structural Engineering:
- Focuses on analyzing the response of a structure to time-varying and dynamic loads.
- Essential for evaluating structural performance during events such as earthquakes, windstorms, and vibrations.
- Considers the changing nature of loads and their impact on the structure's behaviour over time.
- Provides insights into how the structure will deform, oscillate, or react during dynamic events.
- Helps in designing structures to withstand dynamic forces safely.
In summary:
- static analysis in the structural engineering field assesses how structures respond to steady, unchanging loads.
- On the other hand dynamic analysis focuses on studying the response of structures to time-varying and dynamic loads, such as those caused by earthquakes or wind.
- Both types of analysis are essential in ensuring the safety and stability of structures under different conditions.
2. Explain the following with relevant force-displacement graph
- Elastic behaviour
- Inelastic behavior
- Plastic behavior
- Non-linear Inelastic behaviour
Ans:
Understanding the behaviour of materials and structures under load is critical in structural engineering. The behaviour of materials can be described using force-displacement graphs, which help illustrate how materials respond to applied forces.
Let's explain each of the terms mentioned and provide relevant force-displacement graphs for each:
1. Elastic Behavior:
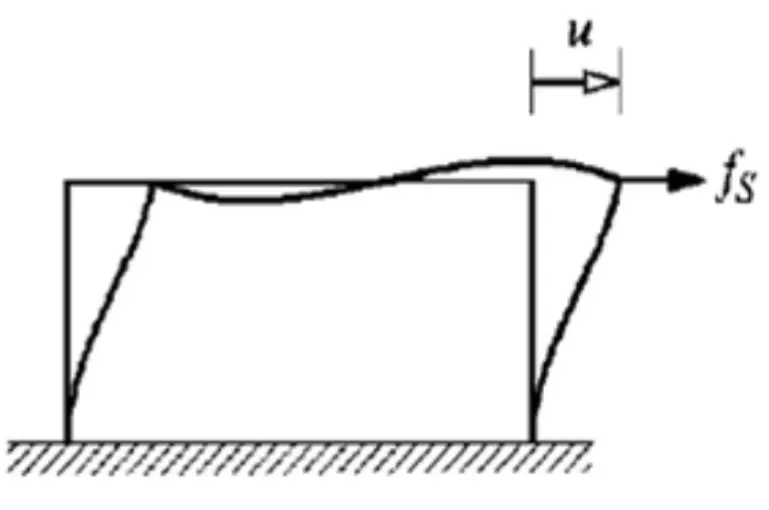
Elastic behaviour refers to the property of a material or structure to return to its original shape and size after the applied force is removed. This means that when a force is applied, the material deforms elastically, and when the force is released, it returns to its initial state with no permanent deformation.
Here's a relevant force-displacement graph for elastic behaviour:
2. Inelastic Behavior:
Inelastic behaviour occurs when a material or structure undergoes permanent deformation even after the applied force is removed. Inelastic behaviour can occur due to factors like plastic deformation, cracking, or yielding, and it implies that the material or structure does not return to its original state.
Here's a relevant force-displacement graph for inelastic behaviour: 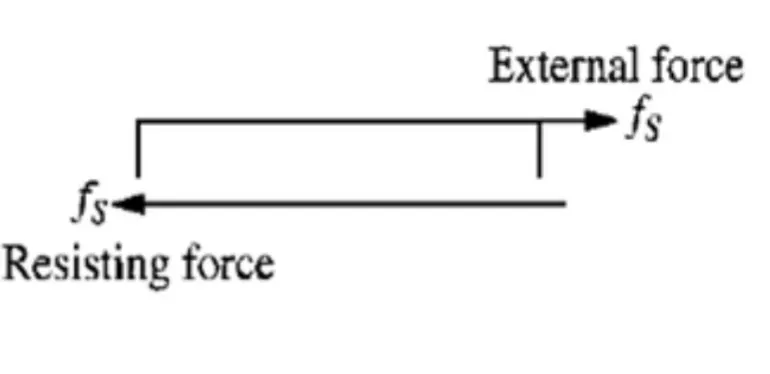 3. Plastic Behavior:
Plastic behaviour is a specific type of inelastic behaviour where a material undergoes permanent deformation without a significant increase in stress. It typically occurs after a yield point is reached. In plastic behaviour, the material deforms plastically, but the applied force may not increase significantly.
Here's a relevant force-displacement graph for plastic behaviour: 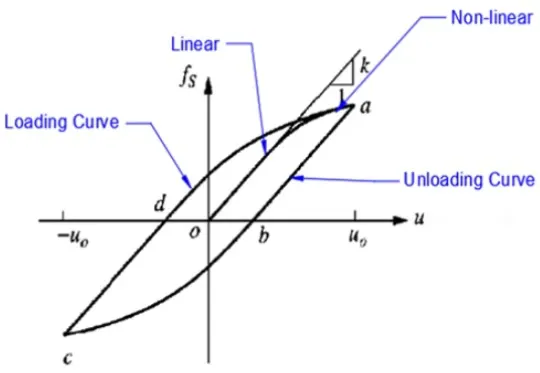
4. Non-linear Inelastic Behavior:
Non-linear inelastic behaviour is a more complex form of inelasticity where the relationship between force and displacement is not linear. This behaviour can involve a combination of elastic, plastic, and other deformations, and the stress-strain curve may exhibit multiple peaks and valleys.
Here's a relevant force-displacement graph for non-linear inelastic behaviour: 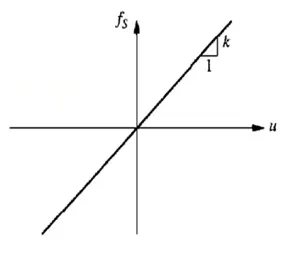
In summary:
- Force-displacement graphs are valuable tools for visualizing and understanding the behaviour of materials and structures under load.
- Elastic behaviour returns to the original state, inelastic behaviour involves permanent deformation, plastic behaviour is characterized by permanent deformation without a significant increase in stress, and non-linear inelastic behaviour can be a complex combination of these behaviours.
- Graphs help engineers assess the performance and safety of structures in various loading conditions.
3. Explain Mass, Stiffness and damping components in the equation of motion
Ans:
In the context of structural and mechanical engineering, the equation of motion describes the behaviour of a dynamic system subjected to external forces or excitations. The equation of motion typically includes three main components: mass, stiffness, and damping.
Let's explain each of these components:
1. Mass (M): Mass represents the inertia of a system, which is its resistance to changes in motion. In the context of the equation of motion, mass refers to the physical mass of the object or structure being analyzed. The greater the mass, the more force is required to accelerate or decelerate the object. In mathematical terms, mass (M) is typically represented as a scalar constant.
- The force is related to the mass component with the equation of fi=Mu¨
2. Stiffness (K): Stiffness is a measure of the system's resistance to deformation or displacement under an applied force. It quantifies how much a system resists changes in shape or position. In the context of structural analysis, stiffness is often related to the material properties and geometry of the structure. For mechanical systems, it may refer to the stiffness of springs, rods, or other elements. Stiffness (K) is typically represented as a positive constant in the equation of motion.
- The force is related to the stiffness component with the equation of fs=Ku
3. Damping (C): Damping represents the dissipation of energy within a dynamic system. It accounts for the resistance to motion caused by various internal and external factors, such as friction, air resistance, or energy losses within the system. Damping helps model how a system's motion gradually comes to rest or stabilizes after being subjected to external forces or excitations. Damping (C) is typically represented as a positive constant in the equation of motion.
- The force is related to the damping component with the equation of fd=Cu˙
The general form of the equation of motion for a dynamic system can be expressed as:
M⋅u¨+C⋅u˙+K⋅u=P(t)
Where:
- M represents the mass of the system.
- u¨ represents the acceleration of the system (the second derivative of displacement concerning time).
- C represents the damping coefficient.
- u˙ represents the velocity of the system (the first derivative of displacement concerning time).
- K represents the stiffness of the system.
- u represents the displacement of the system.
- P(t) represents the external forces or excitations applied to the system as a function of time.
This equation of motion describes how the dynamic system responds to external forces (P(t)) based on its mass (M), stiffness (K), and damping (C) properties. The interplay of these three components determines the system's behaviour, including its natural frequencies, damping ratios, and response to various excitations. Engineers use this equation to analyze and design systems across various engineering disciplines.
4. Provide the relationship between Natural period (Tn) and natural frequency (f) and provide their definitions
Ans:
Relationship between Natural Period (Tn) and Natural Frequency (f):
The relationship between natural period (Tn) and natural frequency (f) is given by the following equation:
f=Tn/1
Where:
- f is the natural frequency in hertz (Hz), which represents the number of oscillations per second.
- Tn is the natural period in seconds (s), which represents the time it takes for one complete oscillation.
In summary, the natural period (Tn) and natural frequency (f) of a dynamic system are inversely related. The natural frequency is the reciprocal of the natural period, and they are both fundamental properties used to describe the behaviour of vibrating systems. These parameters are essential in structural engineering, mechanical engineering, and various other fields to analyze and design systems with dynamic responses.
Definition of Natural Period (Tn):
The natural period (Tn) of a dynamic system, often denoted as Tn, is the time it takes for the system to complete one full oscillation or cycle of its free, undamped vibration when subjected to an initial disturbance and then left to vibrate freely without any external forces or damping. In simpler terms, it's the time it takes for the system to return to its initial position after being displaced.
Definition of Natural Frequency (f):
The natural frequency (f) of a dynamic system, usually denoted as f, is the reciprocal of the natural period (Tn). In other words, it is the number of oscillations or cycles the system completes in one second when it is vibrating freely under its inertia and stiffness, without any external forces or damping
In summary:
- The natural period (Tn) and natural frequency (f) of a dynamic system are inversely related.
- The natural frequency is the reciprocal of the natural period, and they are both fundamental properties used to describe the behaviour of vibrating systems.
- These parameters are essential in structural engineering, mechanical engineering, and various other fields to analyze and design systems with dynamic responses.
5. Explain in detail about Response spectrum & its Graph
Ans:
A response spectrum is a graphical representation used in structural engineering and earthquake engineering to characterize the dynamic response of a structure or system to ground motion or other dynamic forces. It provides valuable information about how a structure is likely to respond to various frequencies and amplitudes of excitation. Let's delve into the details of response spectra and its graph:
1. Purpose of Response Spectrum:
The primary purpose of a response spectrum is to visualize and quantify the maximum response of a structure at different frequencies. It helps engineers understand how a structure will behave when subjected to ground motion, such as during an earthquake or when exposed to other dynamic loads like wind or machinery vibrations. By analyzing the response spectrum, engineers can assess the structural integrity, safety, and performance of a building or system.
2. How It Works:
A response spectrum is typically generated using a mathematical model of the structure and input ground motion data. The procedure involves the following steps:
-
Input Ground Motion: Engineers obtain records of ground motion data, often recorded during past earthquakes or simulated for design purposes.
-
System Modeling:
-
They create a mathematical model of the structure, including its mass, stiffness, and damping properties.
-
Dynamic Analysis:
-
Using the ground motion data and the structural model, engineers perform a dynamic analysis to calculate the response of the structure over a range of frequencies.
-
Response Calculation:
-
The response spectrum is generated by plotting the maximum response (e.g., displacement, velocity, or acceleration) at each frequency of interest.
3. Graphical Representation:
A response spectrum is typically graphically represented as a plot with two axes:
-
Horizontal Axis (Frequency):
-
The horizontal axis represents the frequency of vibration in hertz (Hz). It covers a range of frequencies, from low to high. Engineers are interested in understanding how the structure responds to a wide range of frequencies because different structures have different natural frequencies.
-
Vertical Axis (Response Amplitude):
-
The vertical axis represents the maximum response amplitude of the structure at each corresponding frequency. This amplitude can represent various response quantities, such as displacement, velocity, or acceleration, depending on the context and purpose of the analysis.
4. Characteristics of the Response Spectrum:
The response spectrum plot typically exhibits the following key characteristics:
-
Peak Responses:
-
Peaks in the response spectrum indicate the natural frequencies of the structure. These frequencies correspond to modes of vibration where the structure resonates, resulting in higher response amplitudes.
-
Broadband Region:
-
The region between the natural frequencies, known as the "broadband" region, shows how the structure responds to frequencies outside its resonant frequencies.
-
Amplitude Peaks:
-
The peaks in the response spectrum indicate the maximum response amplitudes that the structure experiences at different frequencies. Engineers use these values to assess the structural performance and design accordingly.
5. Applications:
Response spectra are widely used in structural design and earthquake engineering for the following purposes:
-
Seismic Design:
-
Engineers use response spectra to evaluate the seismic performance of structures and ensure they meet safety standards.
-
Structural Assessment:
-
Response spectra help assess the response of existing structures to potential seismic or dynamic loads.
-
Response Prediction:
-
They are used to estimate the dynamic response of structures to various excitations, aiding in design and analysis.
Deformation response spectrum:
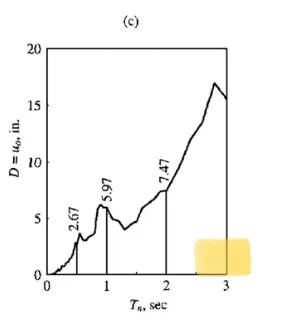
- The below images contain the plot with deformation concerning time.
- The 1st plot (a) represents the ground acceleration recorded during an earthquake.
- The second plot (b) represents the plots of the deformation response of three independent SDF systems. Each plot of b has been done with a fixed damping ratio of 2% and variation in the natural period as 0.5s,1s,2s and the corresponding deformations are obtained concerning time.
- Finally a plot of recorded dimensions and Tn is done to record the peak responses. So based on the period of vibration the deformation of the system can be obtained which can be multiplied with stiffness to obtain equivalent static force which can be further used for the analysis of the structure.
a) Ground acceleration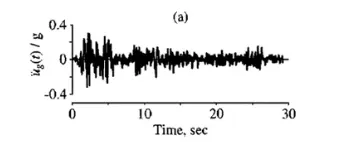
b) Deformation response to three SDF systems with 'c,=2% and Tn=0.5%, 1 and 2 sec
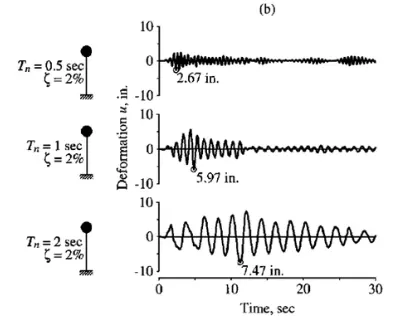
c) Deformation response spectrum for 'c,=2%
Pseudo acceleration response spectrum:
- Pseudo acceleration for a single degree of freedom system with natural frequency ωn is related to its peak deformation D = uo, due to earthquake ground motion: A = (ωn^2) * D = ((2π/Tn)^2) * D.
- The D here represents relative deformation and not total deformation hence, the acceleration obtained is relative so, it is called pseudo acceleration.
- The quantity A has units of acceleration and it is related to base shear Vbo. Vbo=fso=mA (or) Vbo (A/g)*ω.
- In this formula A/g is the base shear coefficient which is acceleration divided by gravitational force. So multiplying this with the total mass of the structure provides total base shear or equivalent static force which can be used for analysis of the structure.
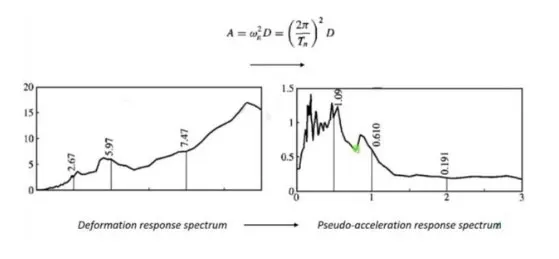 The above image represents the graphical difference between deformation spectra and pseudo acceleration spectra. Pseudo-acceleration can be calculated by multiplying deformation with the natural circular frequency of vibration at any instant of time.
In summary:
- A response spectrum is a graphical tool used in structural engineering and earthquake engineering to analyze and visualize how structures respond to dynamic forces at different frequencies.
- It provides valuable information for seismic design, structural assessment, and response prediction, helping engineers ensure the safety and reliability of structures in dynamic environments.