Structural dynamics
Aim:
To get the better understanding of following topics which are explained below.
Explanation:
1.Static analysis and Dynamic analysis:
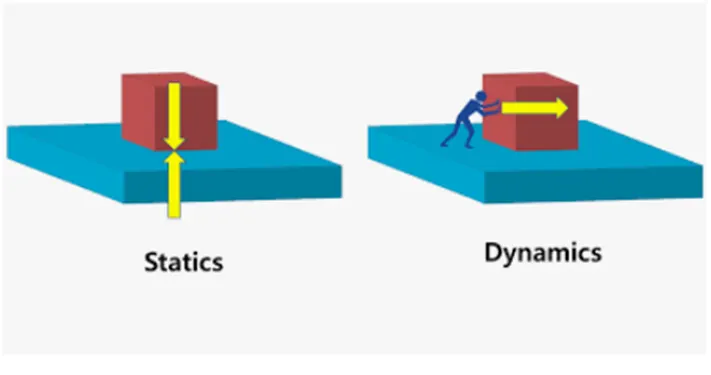
Static analysis:
- A static structural analysis calculates the effect of steady (or static) loading conditions on a structure.
- It ignores inertia and damping effects, such as those caused by time varying loads.
- Static analysis is an essential procedure to design a structure.
- Using static analysis, the structure's response to the applied external forces is obtained. Moreover, the static analysis is performed when the structure is subjected to external displacements, such as differential support settlements.
Dynamic analysis:
- Dynamic analysis is a type of structural analysis which covers the behavior of a structure subjected to dynamic (actions having high acceleration) loading.
- A dynamic load is any load that changes over time. These type of loads exert forces onto a structure that are often much greater than their static equivalents.
- Dynamic analysis is the testing and evaluation of a program by executing data in real-time.
- The objective is to find errors in a program while it is running, rather than by repeatedly examining the code offline.

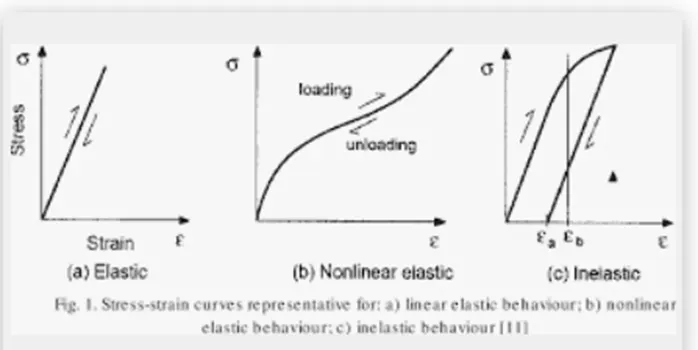
- Explanation and the relevant force-displacement graph of the below given terms,
- Elastic behavior
- Inelastic behavior
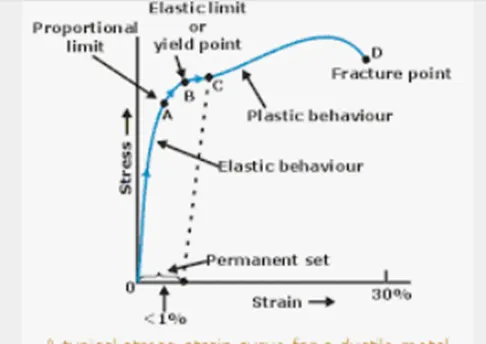
- Plastic behavior
- Non-linear Inelastic behavior
Answer:
- Elastic behavior:
Ability of a deformed material body to return to its original shape and size when the forces causing the deformation are removed. A body with this ability is said to behave elastically.
- Inelastic behavior:
Material that does not return to its original shape after being deformed or when the external forced is removed.
- Non- linear elastic behavior:
Materials have elastic behavior usually only up to a certain load, which is called the 'yield point'. After that, the deformations are plastic. Rubber, for instance, has an elastic stress–strain curve, but the relation is not linear − in such cases nonlinear elastic models are required.
- Plastic behavior:
For stresses beyond the elastic limit, a material exhibits plastic behavior. This means the material deforms irreversibly and does not return to its original shape and size, even when the load is removed. When stress is gradually increased beyond the elastic limit, the material undergoes plastic deformation.
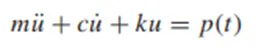
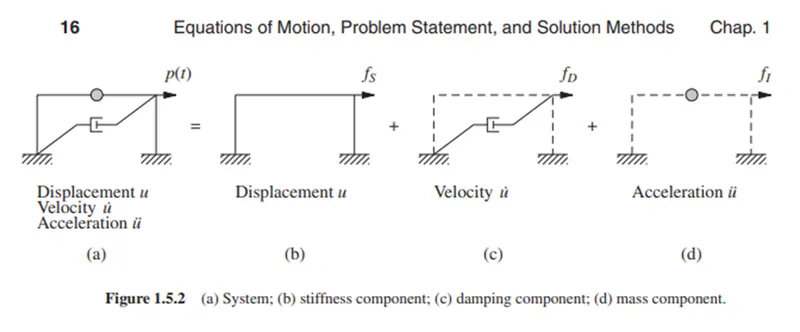
- Mass, Stiffness & Damping components in the equation of motion:
The equation of motion can be derived from Newton's second law of motion is F = ma, or force is equal to mass times acceleration.
- The stiffness components: The frame without damping or mass. The external force fs on the stiffness component is related to displacement ‘u’ by fs=ku, if the system is linear.
- The damping component: The frame with its damping property but no stiffness or mass. The external force on the damping component is related to velocity by fd=cv
- The mass component: The roof mass with out the stiffness or damping of the frame. The external force fi on the mass component is related to the acceleration by fi=

- Hence it becomes,
 Relationship between Natural period (Tn) & Natural frequency (f):
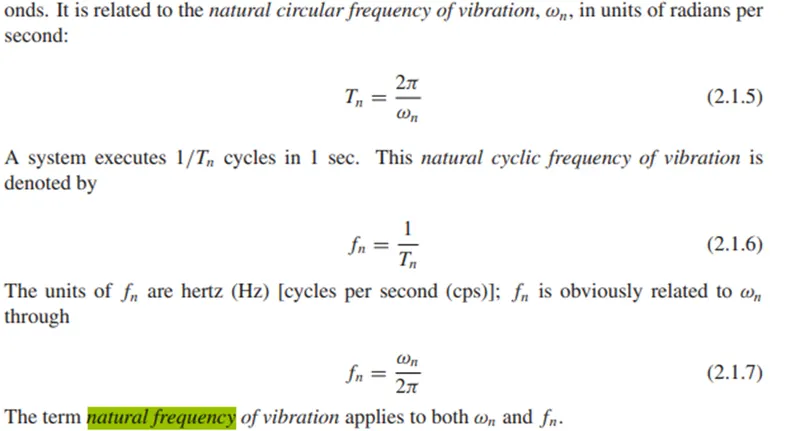
Natural frequency (f):
Natural frequency, also known as eigenfrequency, is the frequency at which a system tends to oscillate in the absence of any driving force. Also referred as wn
Natural period (Tn):
The period of one complete oscillation of a body or system.
Relationship:
- Both refers to quantities which are mass and stiffness.
- Natural frequency is inversely proportional to natural period.
- The following formulas are taken from the book, Dynamics of structure,
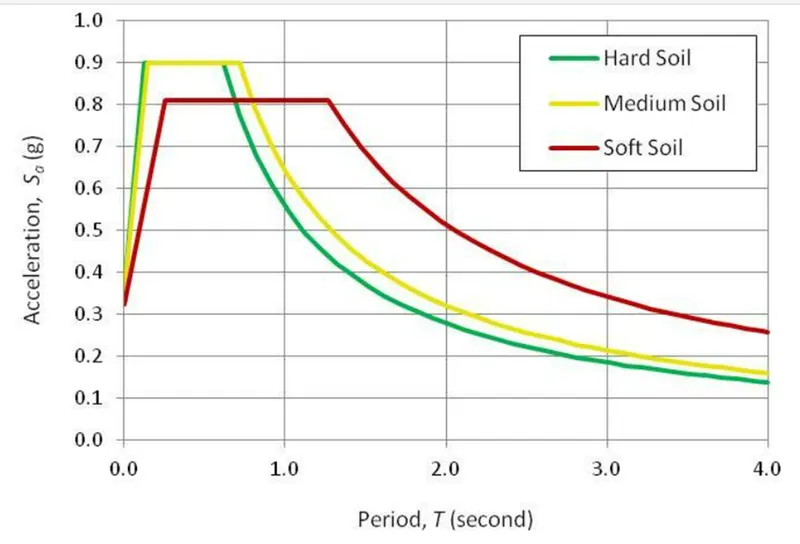
- Response spectrum:
- A response spectrum is a function of frequency or period, showing the peak response of a simple harmonic oscillator that is subjected to a transient event.
- The response spectrum is a function of the natural frequency of the oscillator and of its damping.
- The support movement acts as a forcing term and that the solution depends only on the two parameters
 and
and  , but not on the individual values of m, c, and k.
 - For given values of , , and
 , this equation can be solved for a sufficiently long time. The displacement, velocity, and acceleration response spectra are defined as the maximum values caused by the acceleration history .


- The response spectrum graph is given below,
Conclusion:
Hence the explanation and appropriate pictures are shown above.
.