CFD analysis of Steady and Transient flow over a cylinder in FLUENT
ABSTRACT
Flow over a cylinder is considered as one of the most challenging problems in fluid mechanics where intensive investigations are continued to understand the complex dynamic of cylinder wake flow. In this study, a similar CFD analysis have been performed for a flow over a cylinder. With varying the Reynolds no, the effect of Von karman vortex shedding is predicted. Both transient and steady state cases are run to compute Strouhal no frequency and observe the effect of drag and lift over the cylinder.
AIM
Simulate the flow over a cylinder and explain the phenomenon of Karman vortex street.
THEORY
In fluid dynamics, a Kármán vortex street (or a von Kármán vortex street) is a repeating pattern of swirling vortices, caused by a process known as vortex shedding, which is responsible for the unsteady separation of flow of a fluid around blunt bodies.
It is named after the engineer and fluid dynamicist Theodore von Kármán, and is responsible for such phenomena as the "singing" of suspended telephone or power lines and the vibration of a car antenna at certain speeds.
In fluid dynamics, vortex shedding is an oscillating flow that takes place when a fluid such as air or water flows past a bluff (as opposed to streamlined) body at certain velocities, depending on the size and shape of the body. In this flow, vortices are created at the back of the body and detach periodically from either side of the body forming a Von Kármán vortex street. The fluid flow past the object creates alternating low-pressure vortices on the downstream side of the object. The object will tend to move toward the low-pressure zone.
A vortex street will form only at a certain range of flow velocities, specified by a range of Reynolds numbers (Re), typically above a limiting Re value of about 90. The (global) Reynolds number for a flow is a measure of the ratio of inertial to viscous forces in the flow of a fluid around a body or in a channel, and may be defined as a nondimensional parameter of the global speed of the whole fluid flow.
For common flows (the ones which can usually be considered as incompressible or isothermal), the kinematic viscosity is everywhere uniform over all the flow field and constant in time, so there is no choice on the viscosity parameter, which becomes naturally the kinematic viscosity of the fluid being considered at the temperature being considered. On the other hand, the reference length is always an arbitrary parameter, so particular attention should be put when comparing flows around different obstacles or in channels of different shapes: the global Reynolds numbers should be referred to the same reference length. This is actually the reason for which most precise sources for airfoil and channel flow data specify the reference length at the Reynolds number. The reference length can vary depending on the analysis to be performed: for a body with circle sections such as circular cylinders or spheres, one usually chooses the diameter; for an airfoil, a generic non-circular cylinder or a bluff body or a revolution body like a fuselage or a submarine, it is usually the profile chord or the profile thickness, or some other given widths that are in fact stable design inputs; for flow channels usually the hydraulic diameter about which the fluid is flowing.
`Re=(U L)/(nu0)`
Where U is free stream flow speed, L is the characteristic length and is free stream kinematic viscosity.
The range of Re values will vary with the size and shape of the body from which the eddies are being shed, as well as with the kinematic viscosity of the fluid. Over a large Red range (47<Red<105 for circular cylinders; reference length is d: diameter of the circular cylinder) eddies are shed continuously from each side of the circle boundary, forming rows of vortices in its wake. The alternation leads to the core of a vortex in one row being opposite the point midway between two vortex cores in the other row, giving rise to the distinctive pattern shown in the picture. Ultimately, the energy of the vortices is consumed by viscosity as they move further downstream, and the regular pattern disappears.
When a single vortex is shed, an asymmetrical flow pattern forms around the body and changes the pressure distribution. This means that the alternate shedding of vortices can create periodic lateral (sideways) forces on the body in question, causing it to vibrate. If the vortex shedding frequency is similar to the natural frequency of a body or structure, it causes resonance. It is this forced vibration that, at the correct frequency, causes suspended telephone or power lines to "sing" and the antenna on a car to vibrate more strongly at certain speeds.
GOVERNING EQUATION
he frequency at which vortex shedding takes place for an infinite cylinder is related to the Strouhal number by the following equation:
`St=(fD)/V`
Where St is dimensionless Strouhal number, f is vortex shedding frequency, D is the dia of cylinder, V is flow velocity
The Strouhal number depends upon the Reynolds number Re. Over four order of magnitude Reynolds number from 100 to 100000, the Strouhal no varies from 0.18 to 0.22.
PROBLEM STATEMENT
PART-I
- Simulate the flow with the steady and unsteady case and calculate the Strouhal Number for Re= 100.
PART-II
- Calculate the coefficient of drag and lift over a cylinder by setting the Reynolds number to 10,100,1000,10000 & 100000. (Run with steady solver)
- Discuss the effect of Reynolds number on the coefficient of drag. [ Results should be validated with any standard literature and error should be within 5 %]
PREPROCESSING SET UP
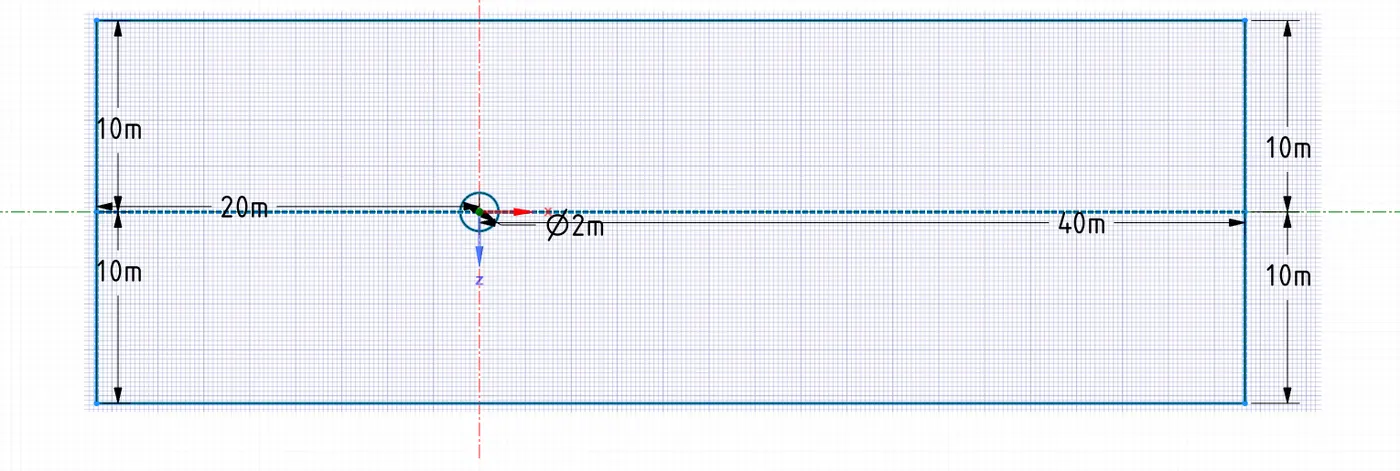
Geometry of the domain
Meshing of computational domain
- The computational domain is initially set to quadrilateral mesh of size 1mm.
- From quad it is changed to triangles in the entire computational domain with reducing the sizes from 0.5mm to 0.25mm.
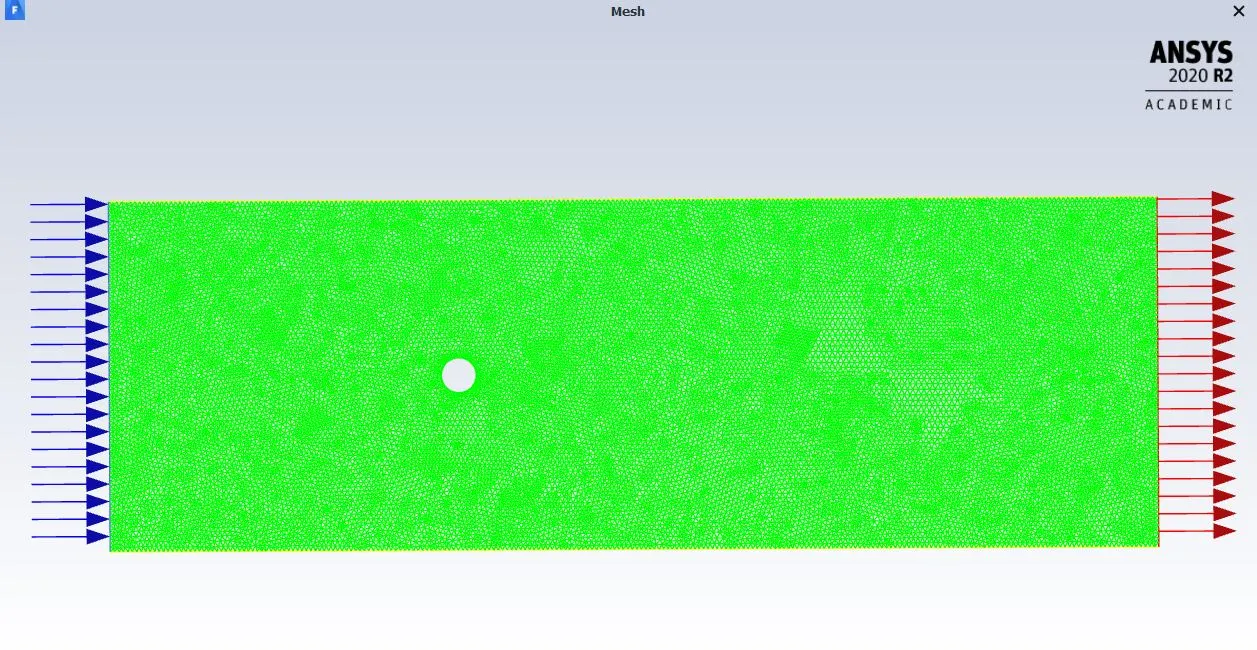
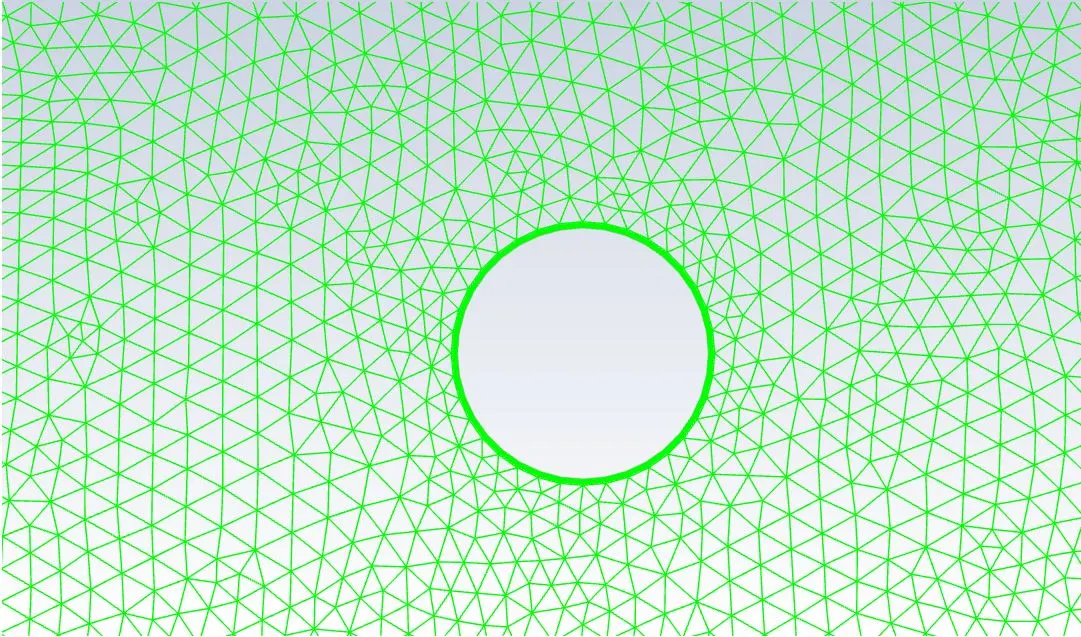
- After converting to triangular domain, the cylinder wall region is refined by the inflation layer properties.
- The wall of the cylinder is smoothly meshed approximately to circular shape and adding 6 inflation layers to it.
Setting up of physics
- The viscous model chosen for this case is laminar model.
- The flow medium is taken as a user material created inside the fluent data base. The properties assigned to the fluid is taken as density =1 and viscosity =0.02
- The cell zones and boundary conditions are assigned as per the named selection with respect to different Reynolds no.
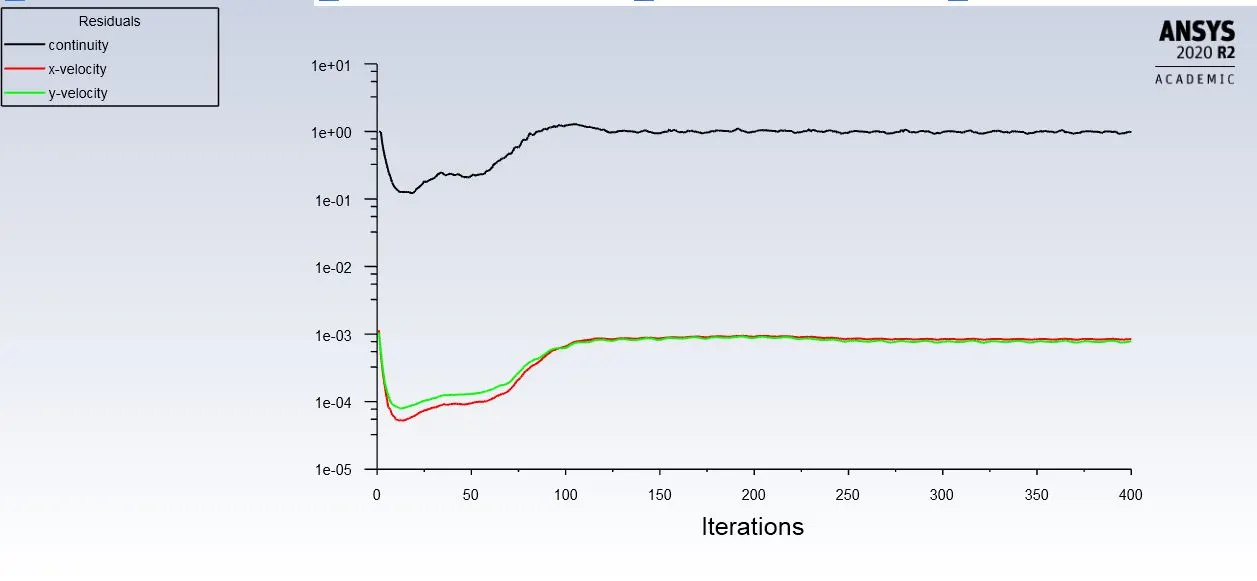
- The convergence criteria is unchecked and a velocity monitor point is fixed at the vicinity of the cylinder wall.
- The drag and the lift coefficients are also assigned according to the direction of the computational domain.
- Two pressure-based solvers are used in steady state and transient state simulation. For steady state SIMPLE algorithm is used and for transient COUPLED solver is used.
- Hybrid initialization schemes is used for both cases. The no of iterations are fixed at a certain interval to capture the vortex shedding phenomenon.
POST PROCESSING RESULTS
CASE 1
Flow across cylinder at Reynold no 100
Steady state approach
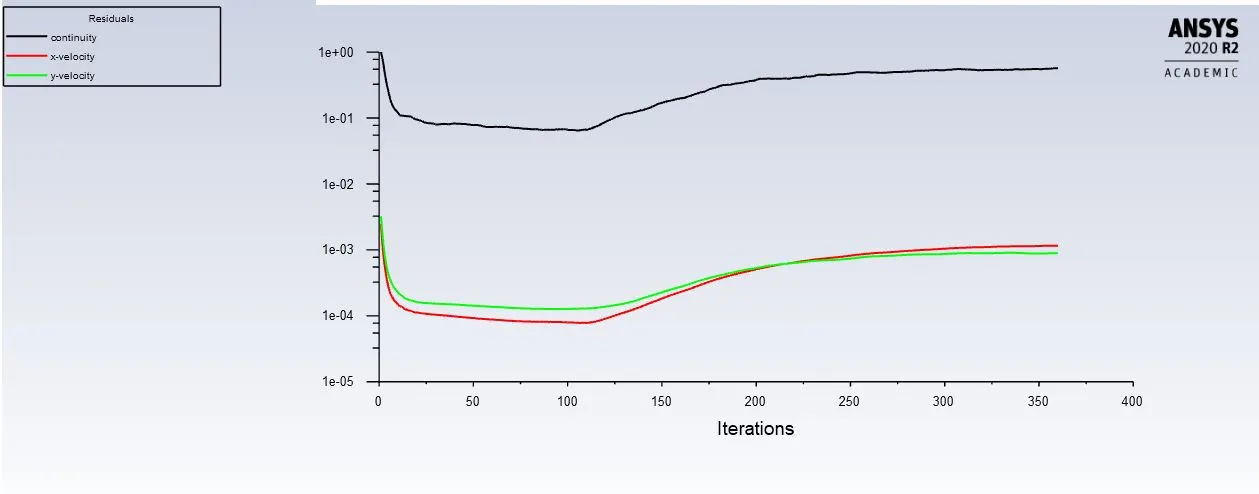
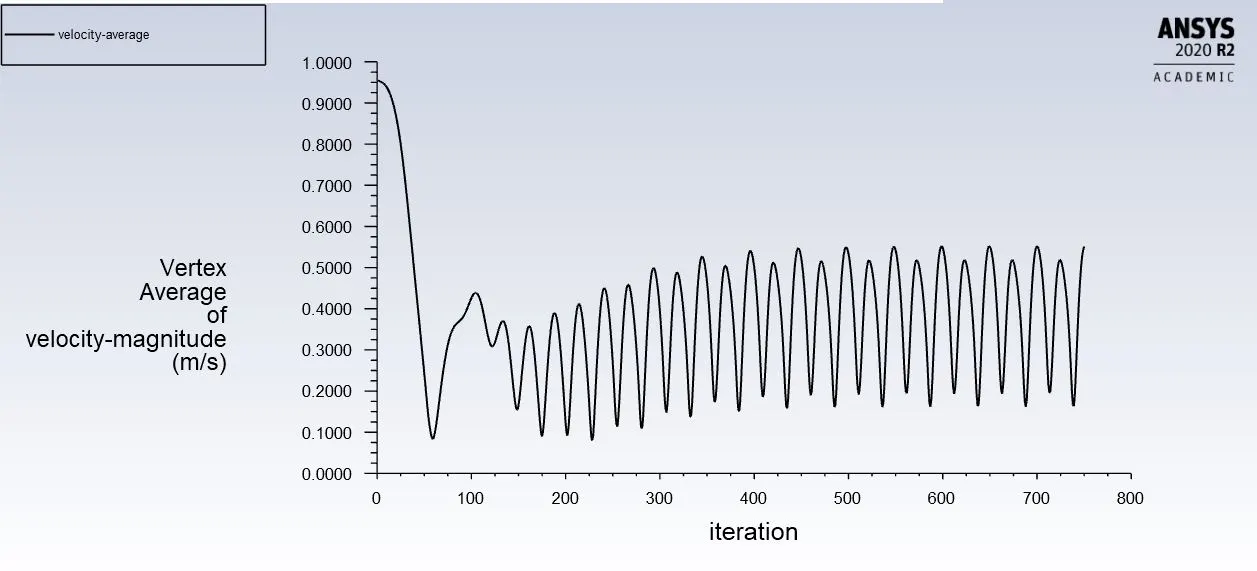
Iterations
Velocity vertex average
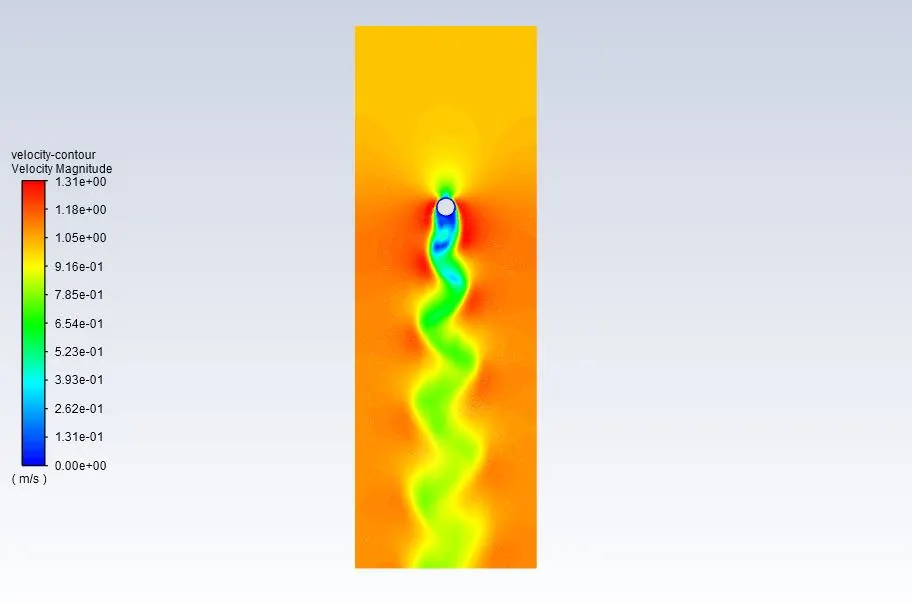
Velocity contour
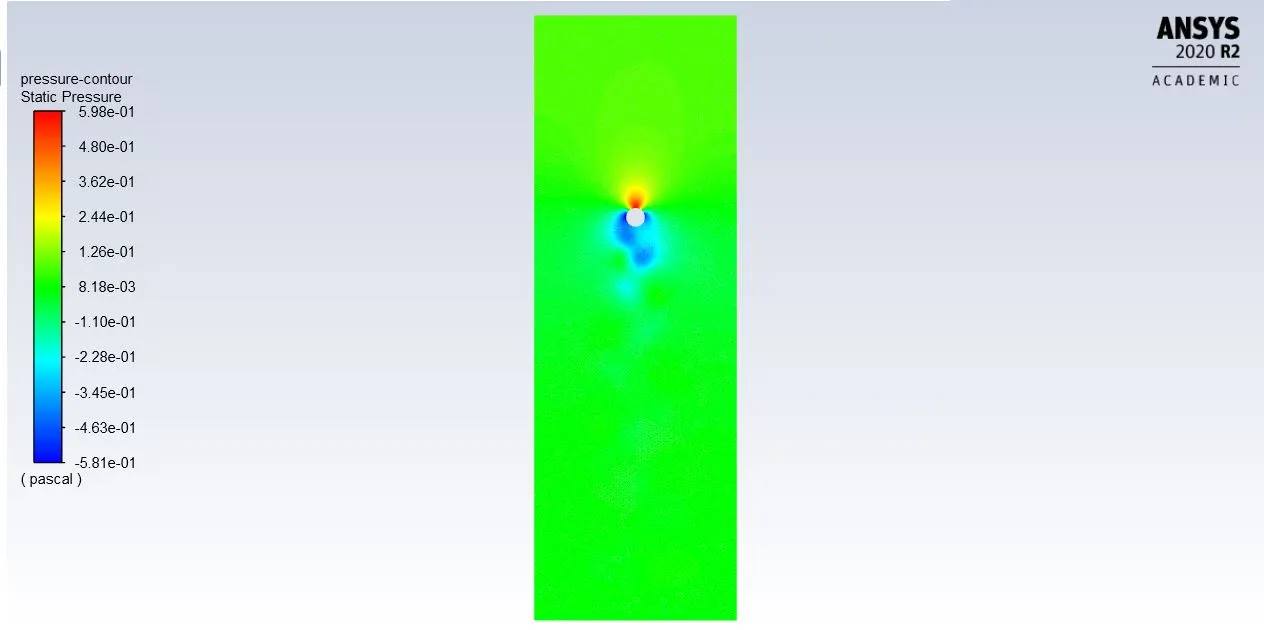
Pressure contour
Computation of Strouhal no
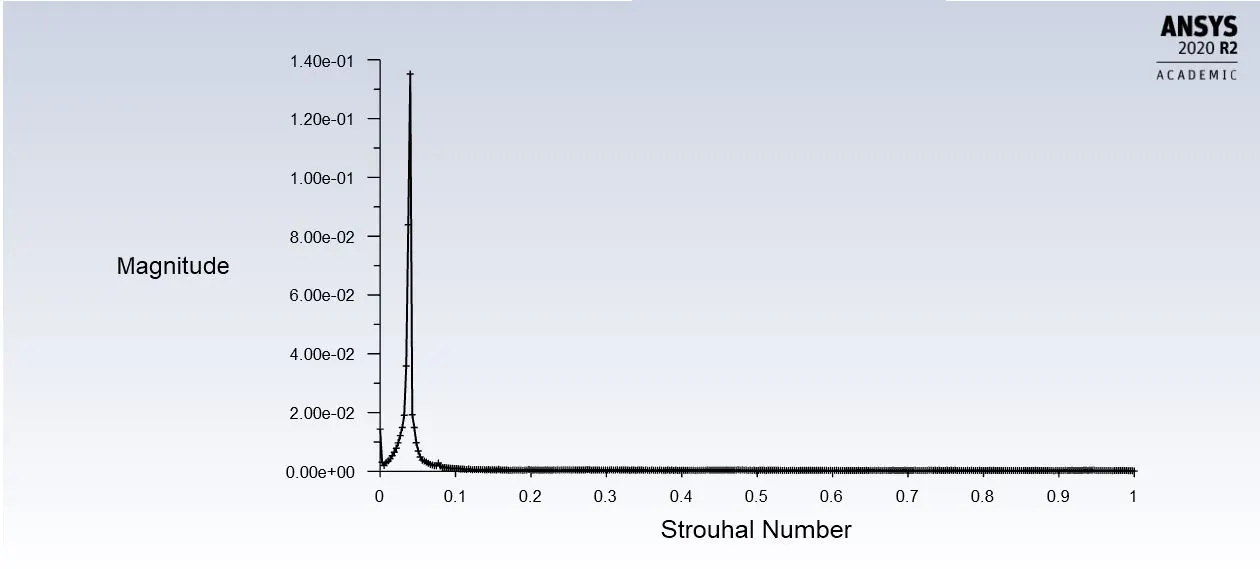
The maximum Strouhal no reached for the steady case is 0.13
CASE 2
Flow across cylinder at Reynold no 100
Transient analysis approach
Iterations
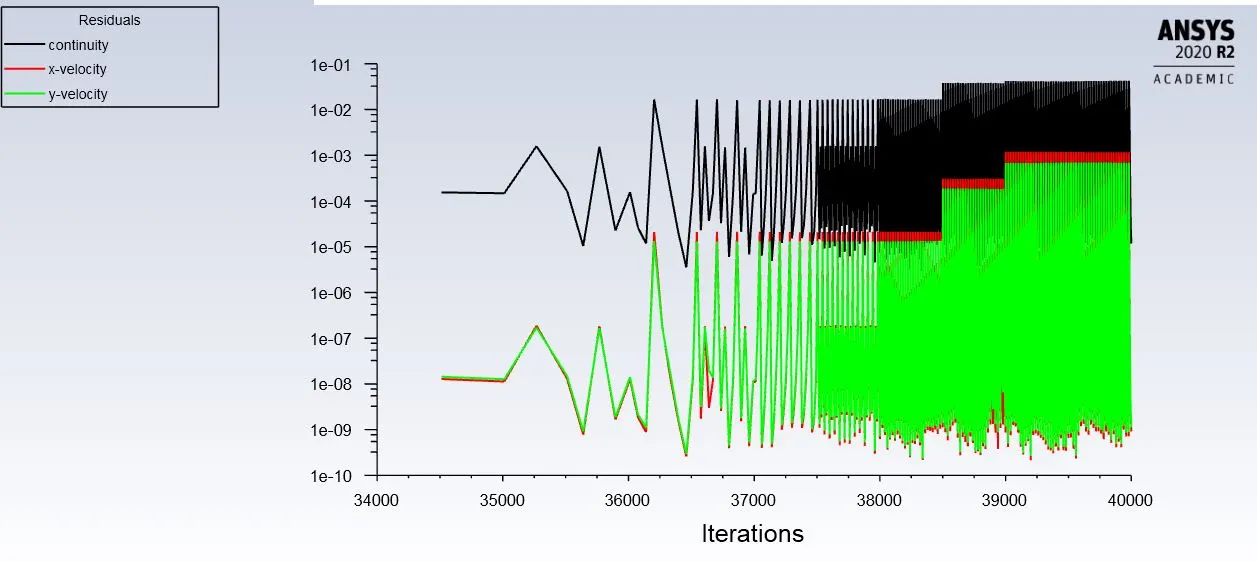
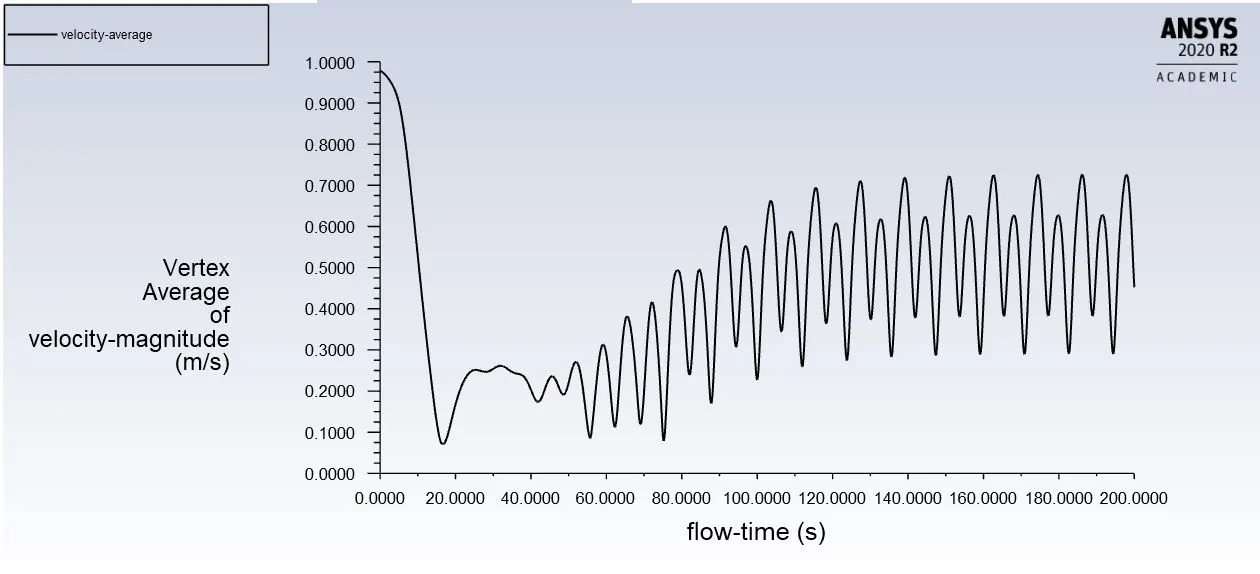
Velocity vertex average
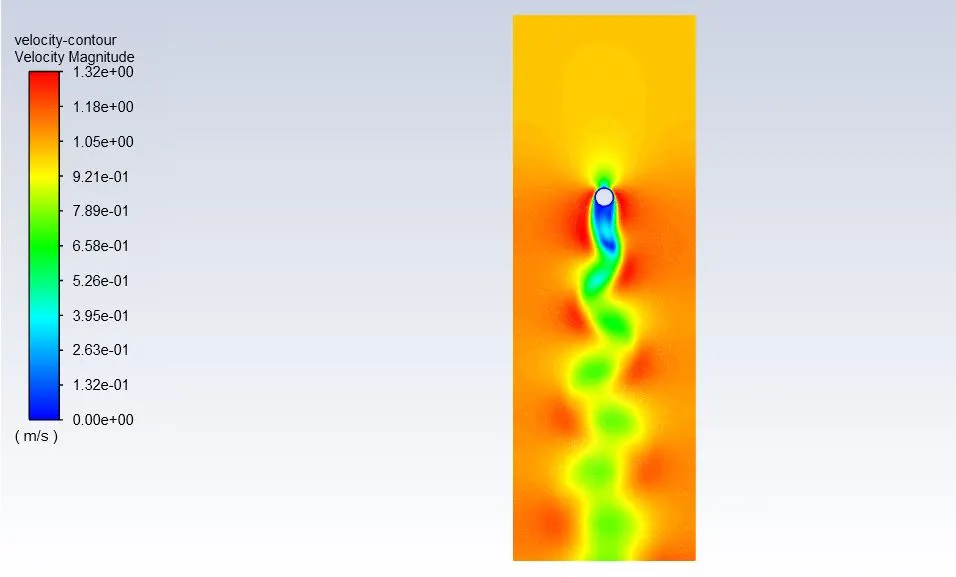
Velocity contour
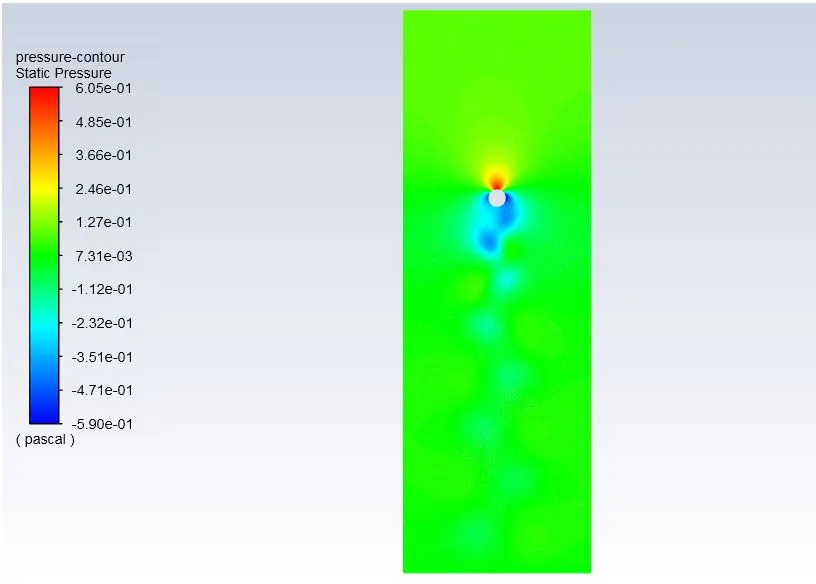
Pressure contour
Computation of Strouhal no
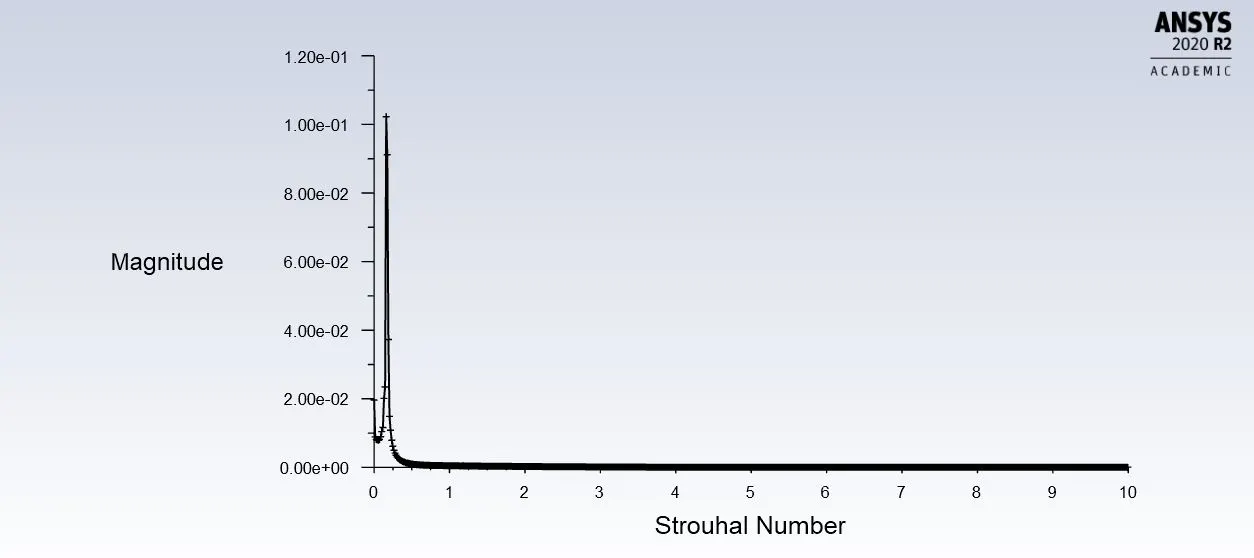
The maximum Strouhal no reached for the transient case is 0.105
CASE 3
Computing flow across cylinder at different Reynolds no
Re =10, velocity=0.1m/s
Iterations
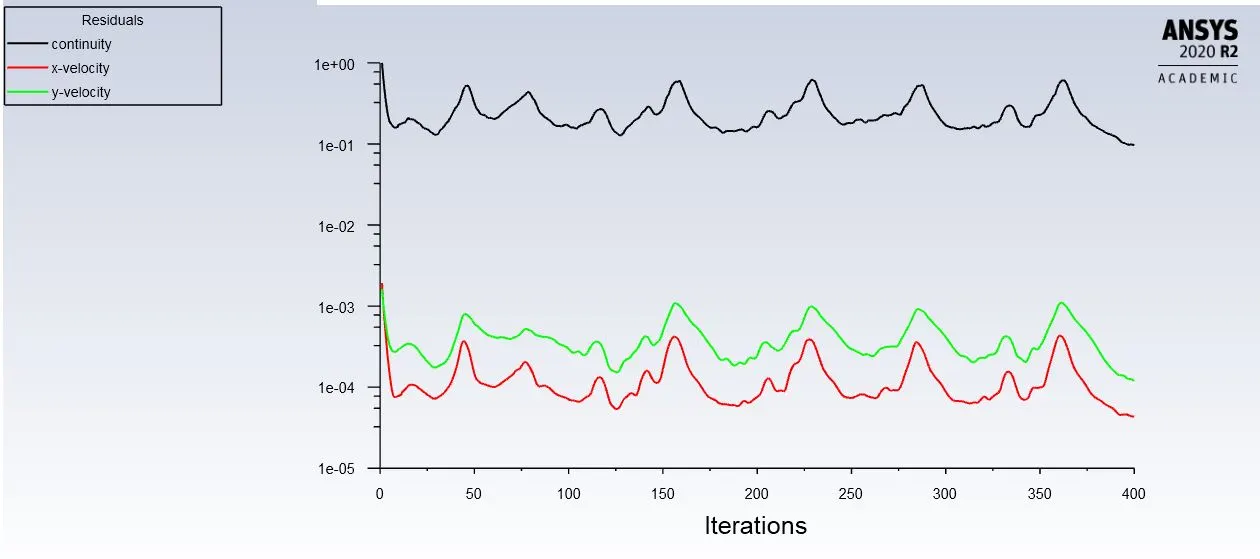
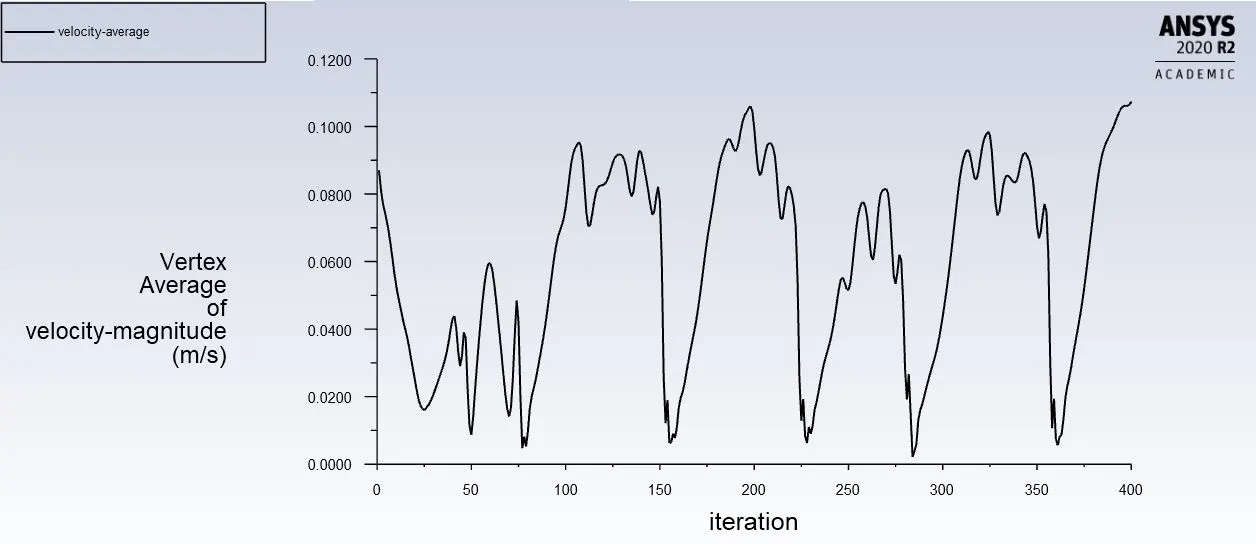
Velocity vertex average
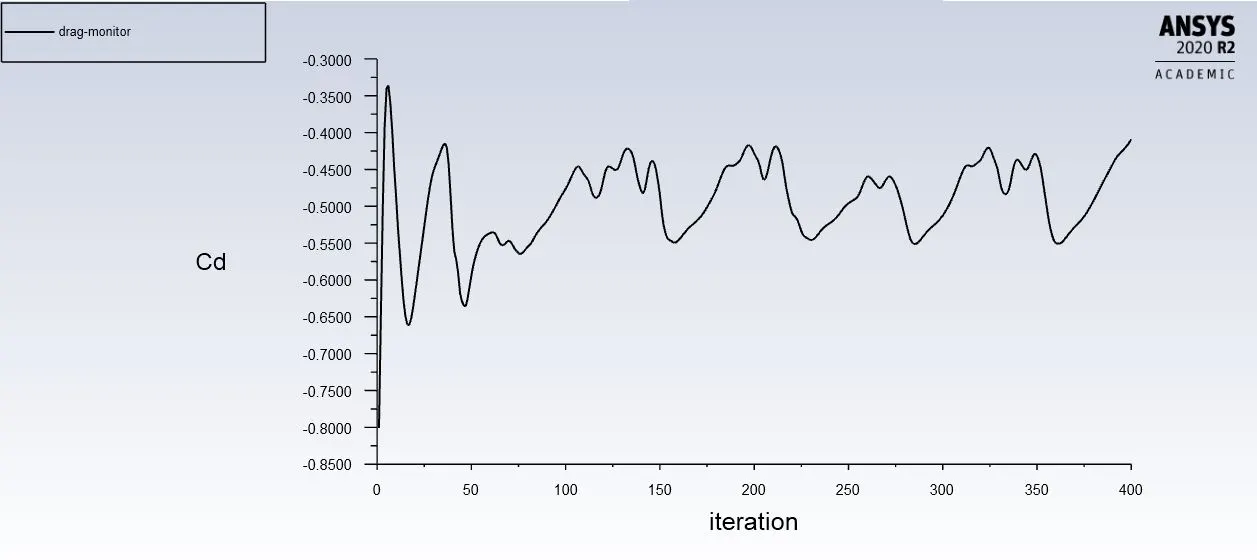
Coefficient of drag
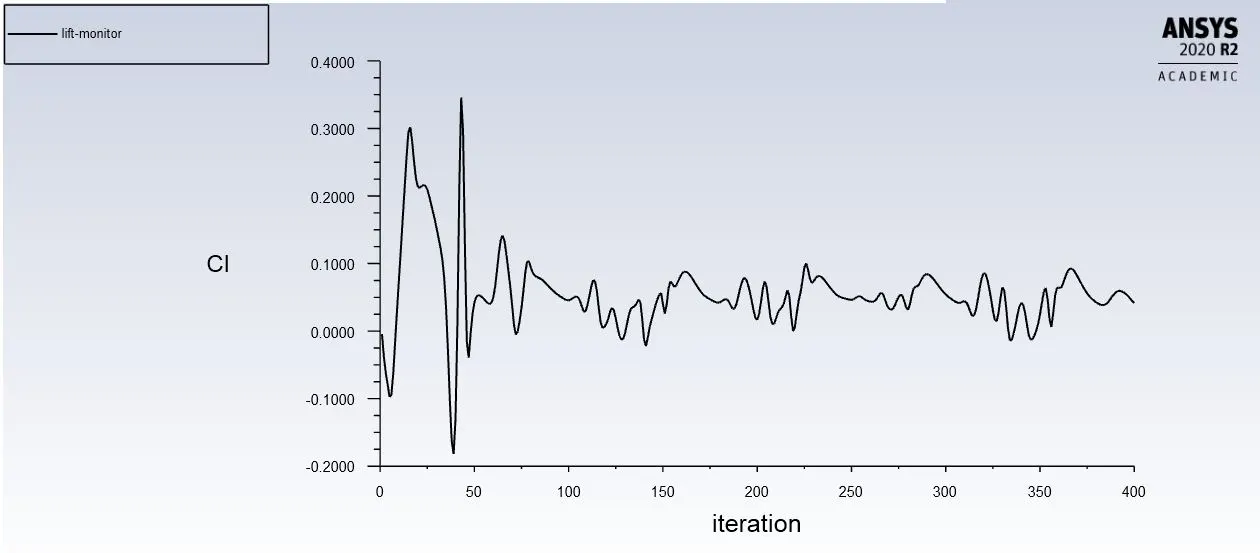
Coefficient of lift
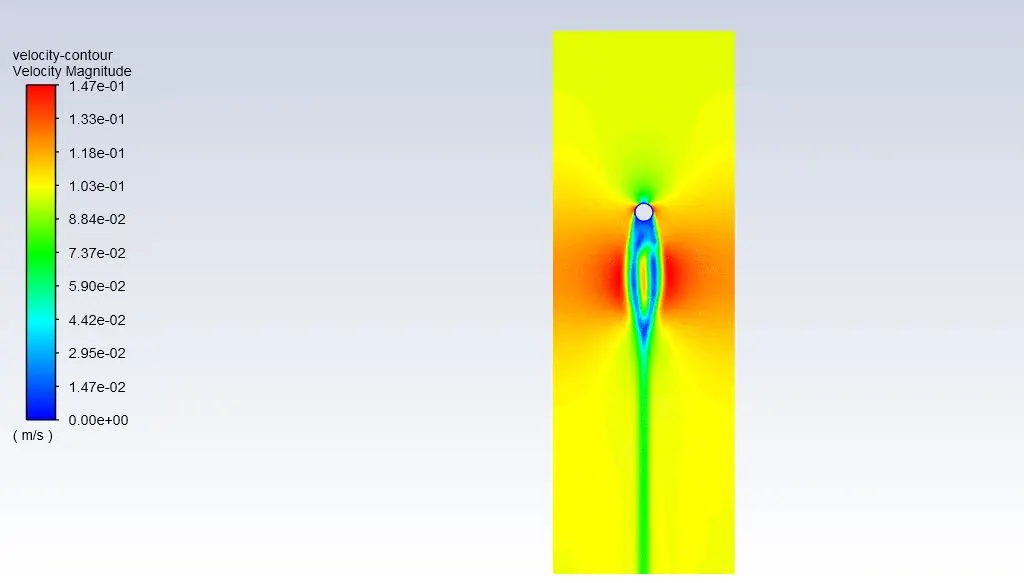
Velocity contour
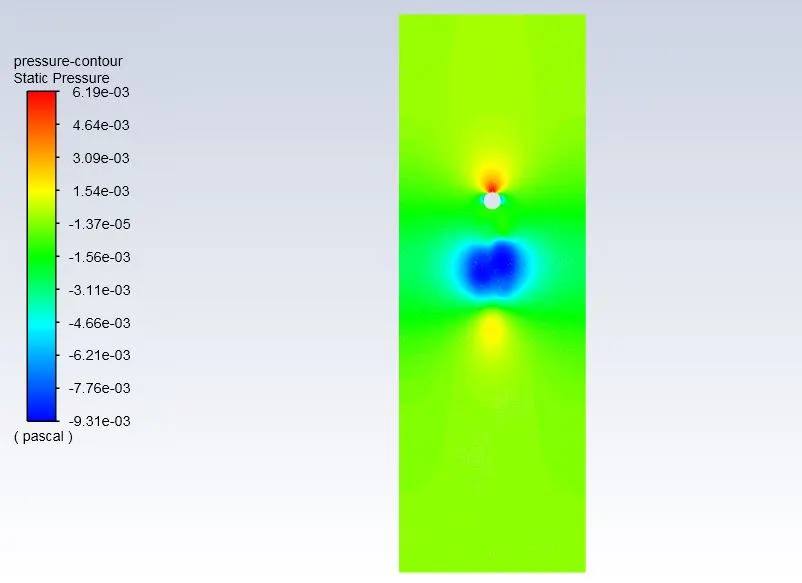
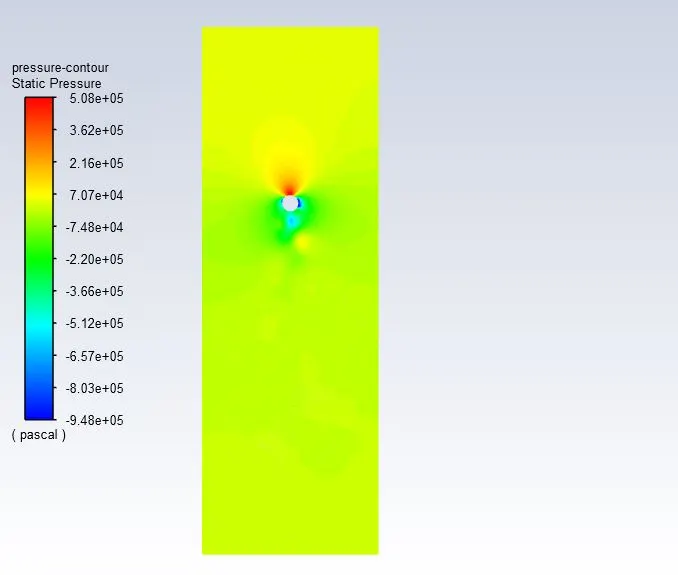
Pressure contour
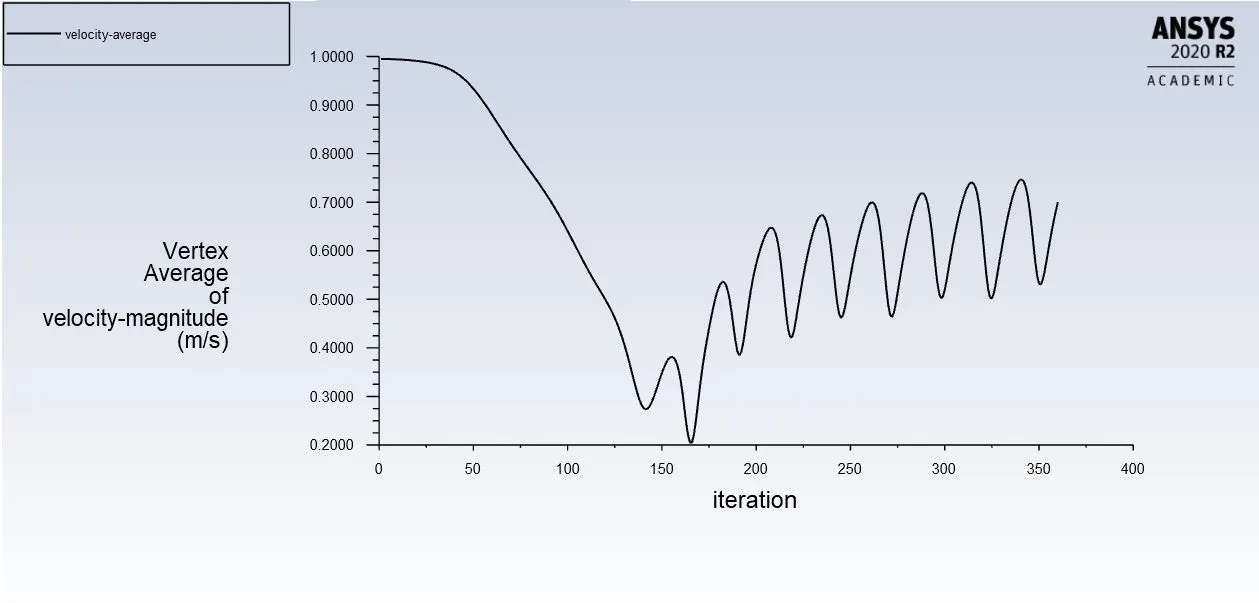
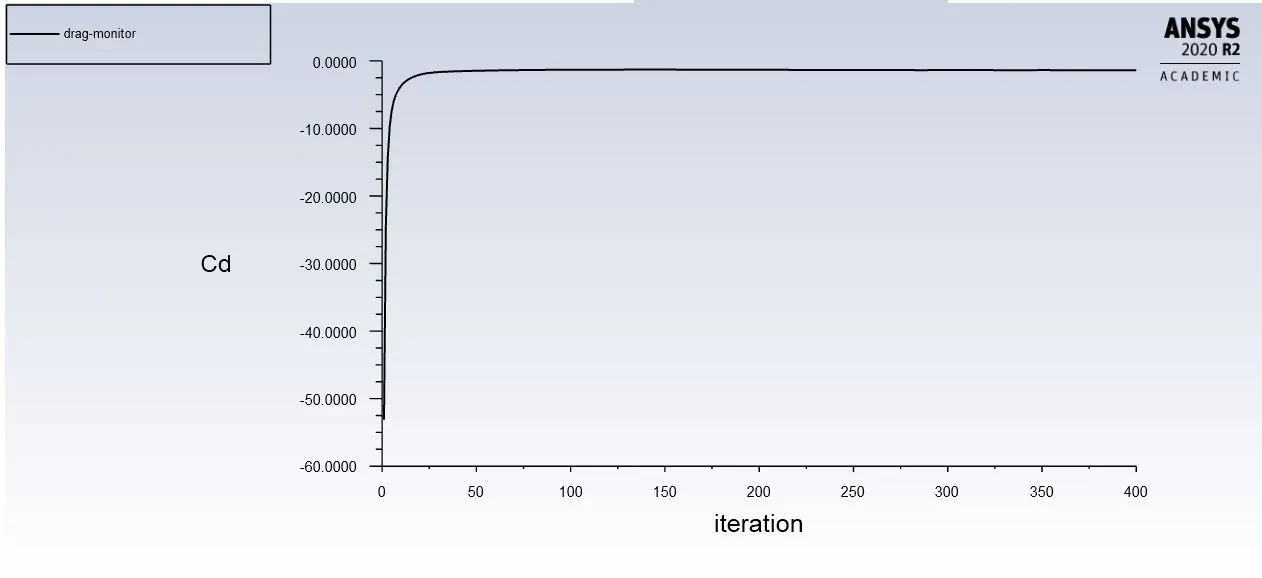
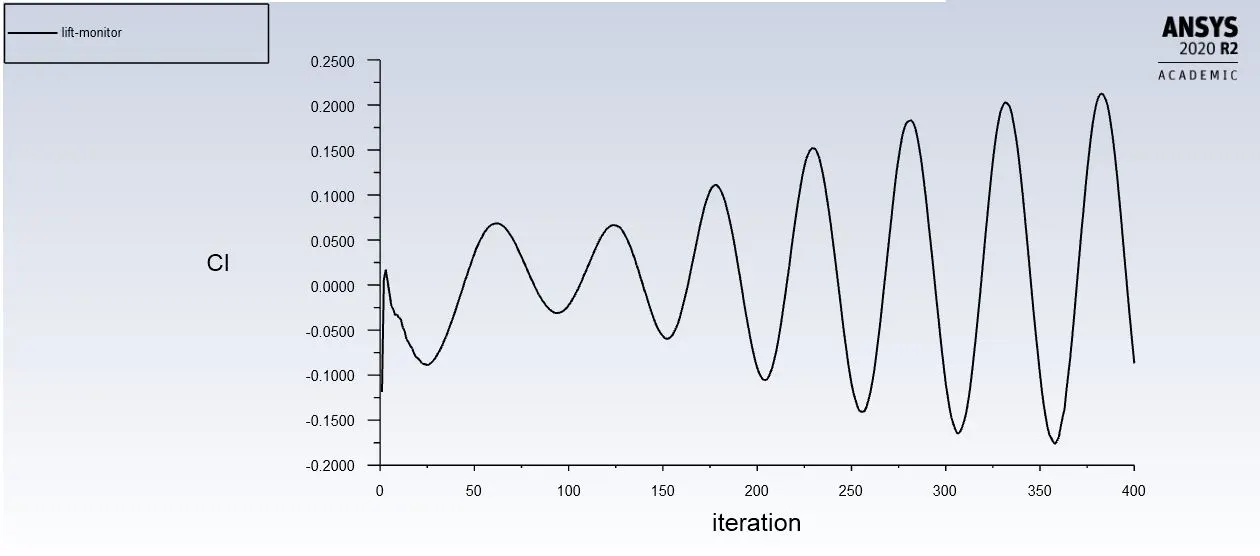
Re =100, velocity=1m/s
Iterations
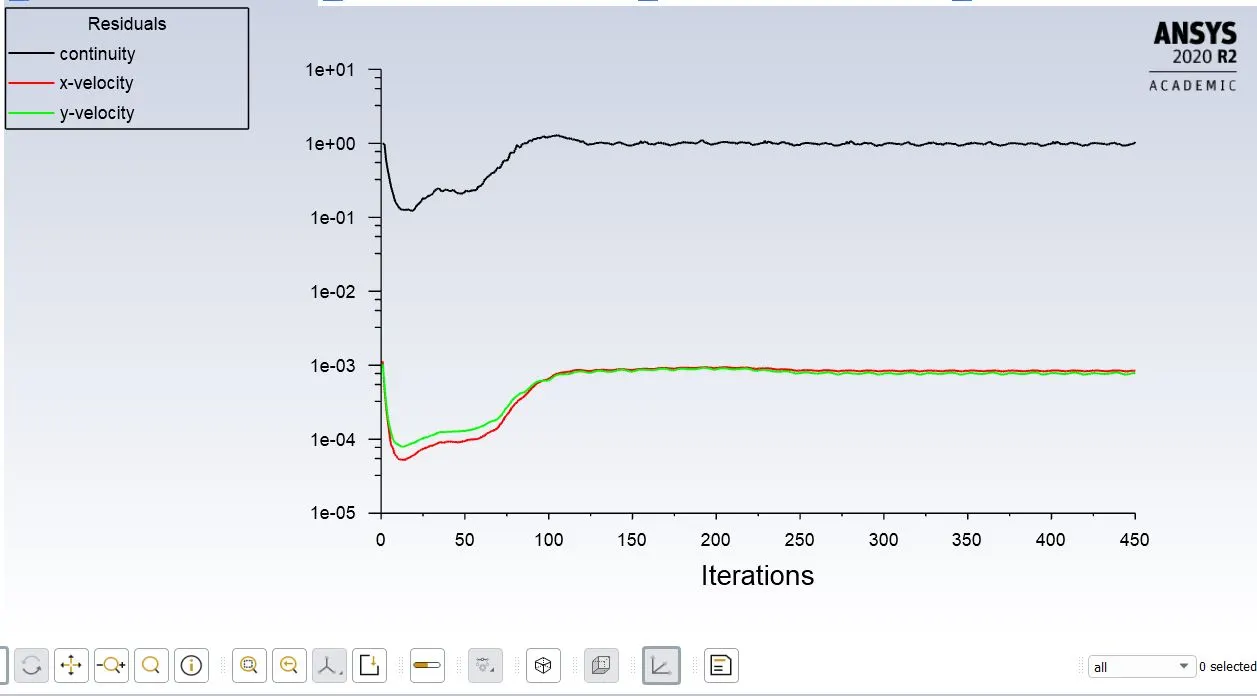
Velocity vertex average
Coefficient of drag
Coefficient of lift
Velocity contour
Pressure contour
Re =1000, velocity=10m/s
Iterations
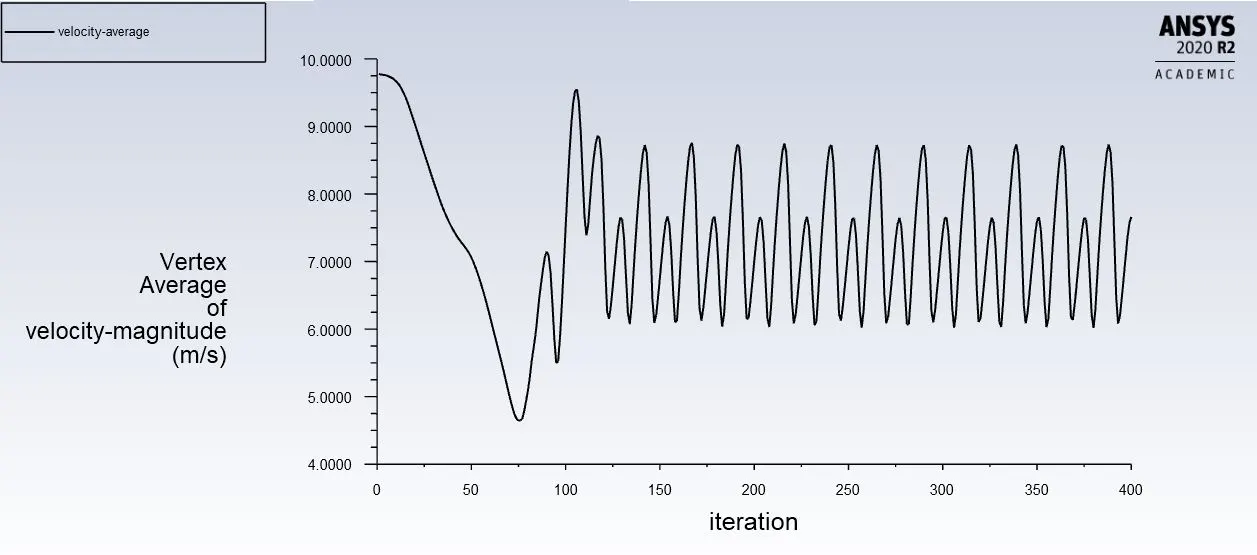
Velocity vertex average
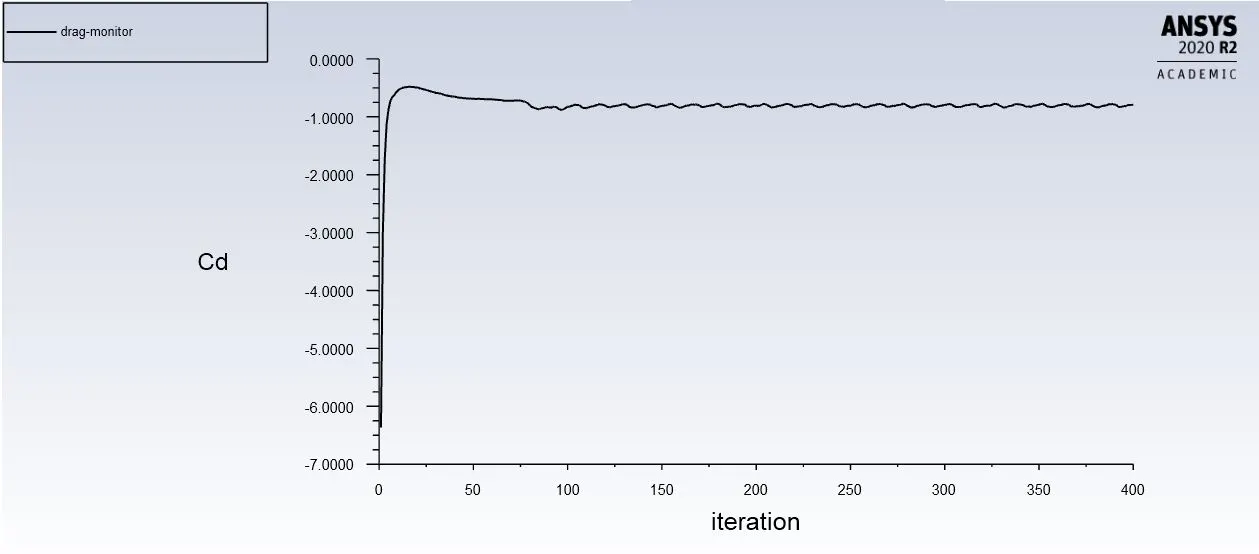
Coefficient of drag
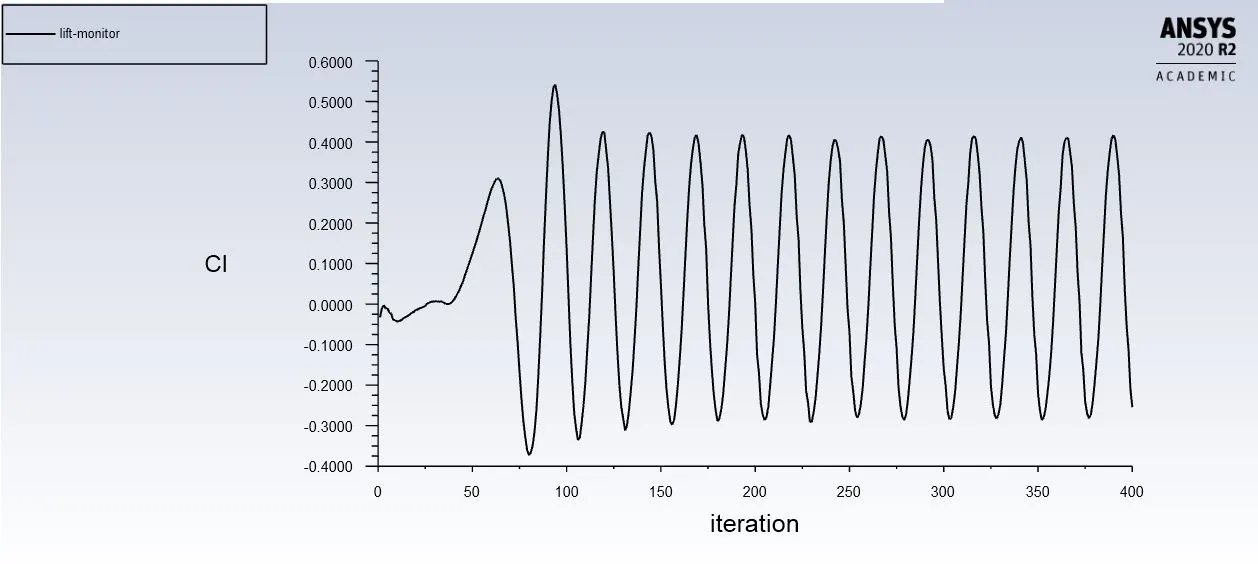
Coefficient of lift
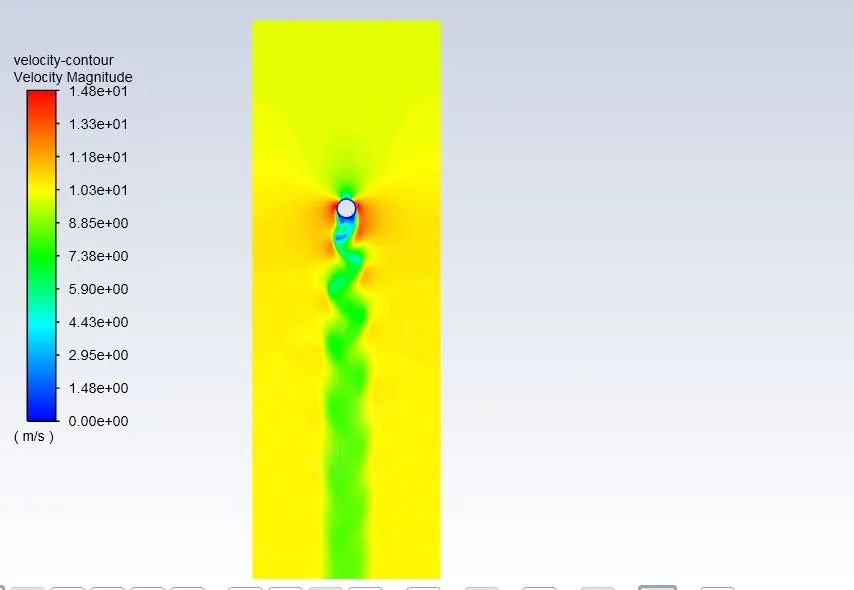
Velocity contour
Pressure contour
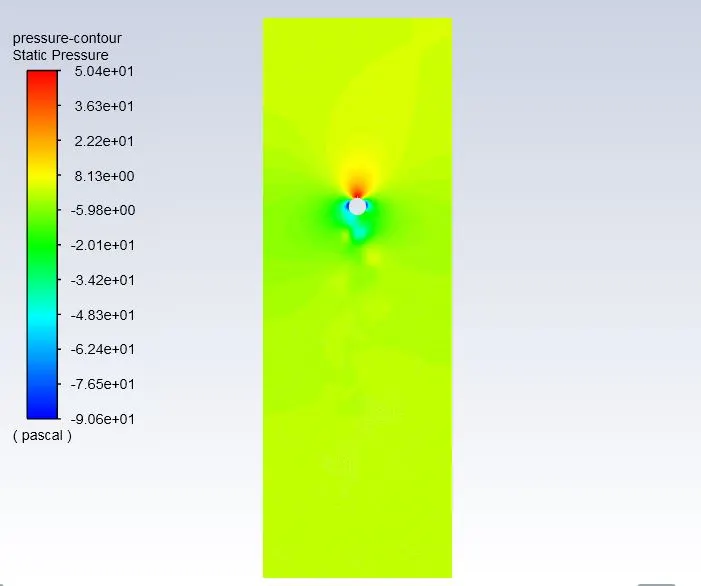
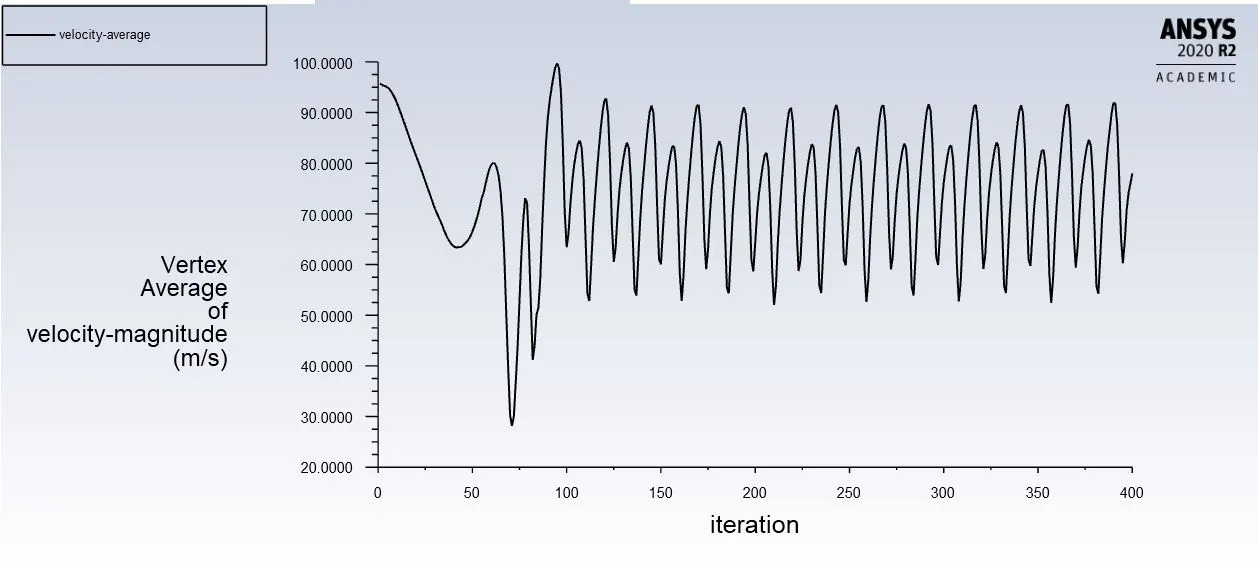
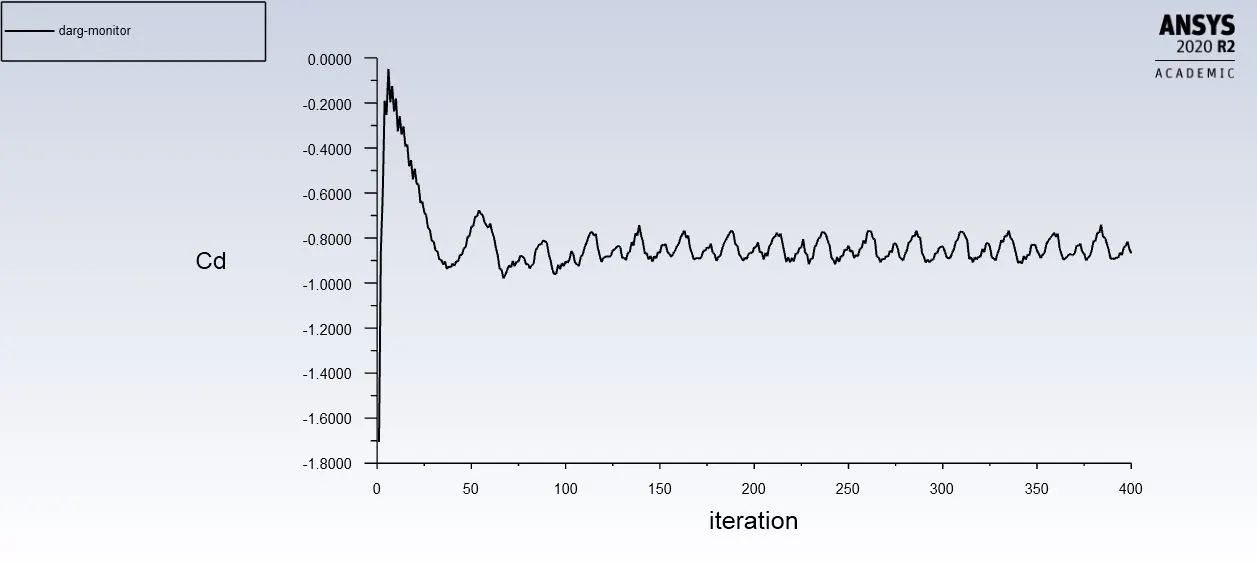
Re =10000, velocity=100m/s
Iterations
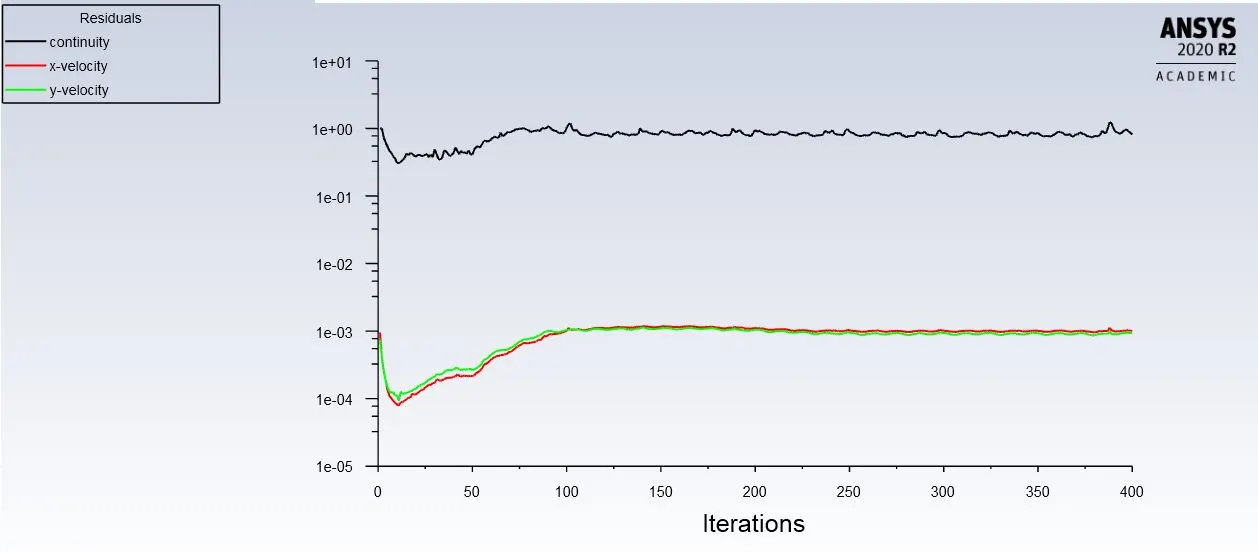
Velocity vertex average
Coefficient of drag
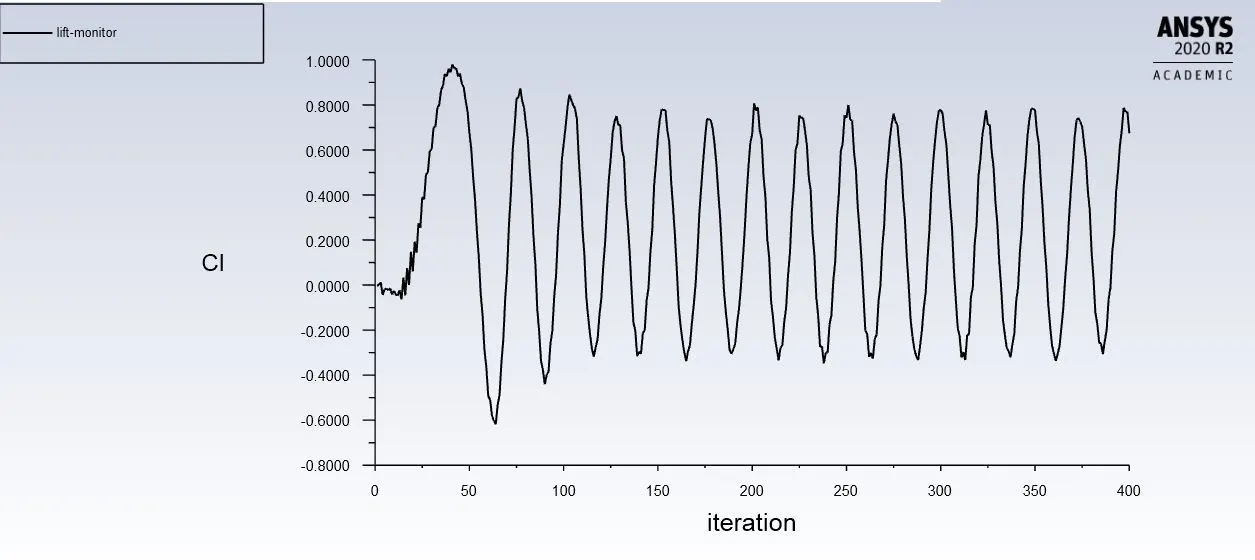
Coefficient of lift
Velocity contour
Pressure contour
Re =100000, velocity=1000m/s
Iterations
Velocity vertex average
Coefficient of drag
Coefficient of lift
Velocity contour
Pressure contour
|
Reynolds number |
CFD maximum predicted velocity at cylinder wall |
CFD maximum predicted pressure at cylinder wall |
|
10 |
1.47e-1 |
6.19e-3 |
|
100 |
1.3e1 |
5.98e-1 |
|
1000 |
1.4e1 |
5.04e1 |
|
10000 |
1.7e2 |
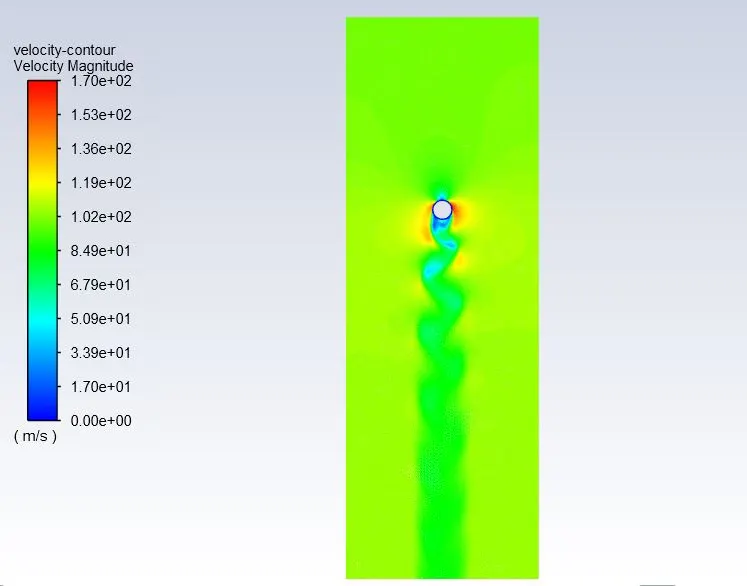
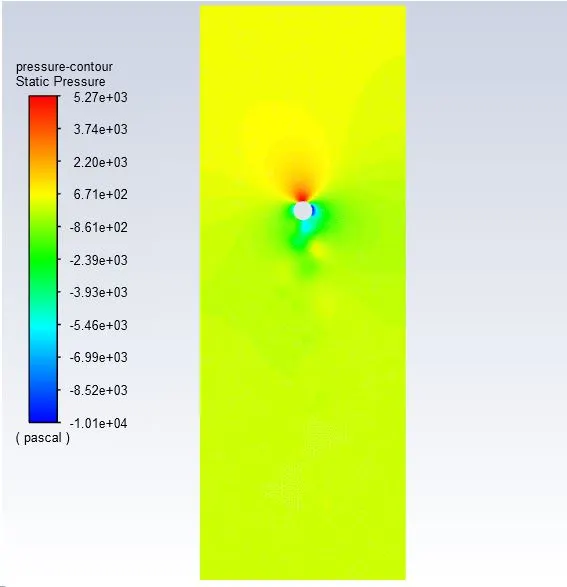
5.27e3 |
|
100000 |
1.87e3 |
5.08e5 |
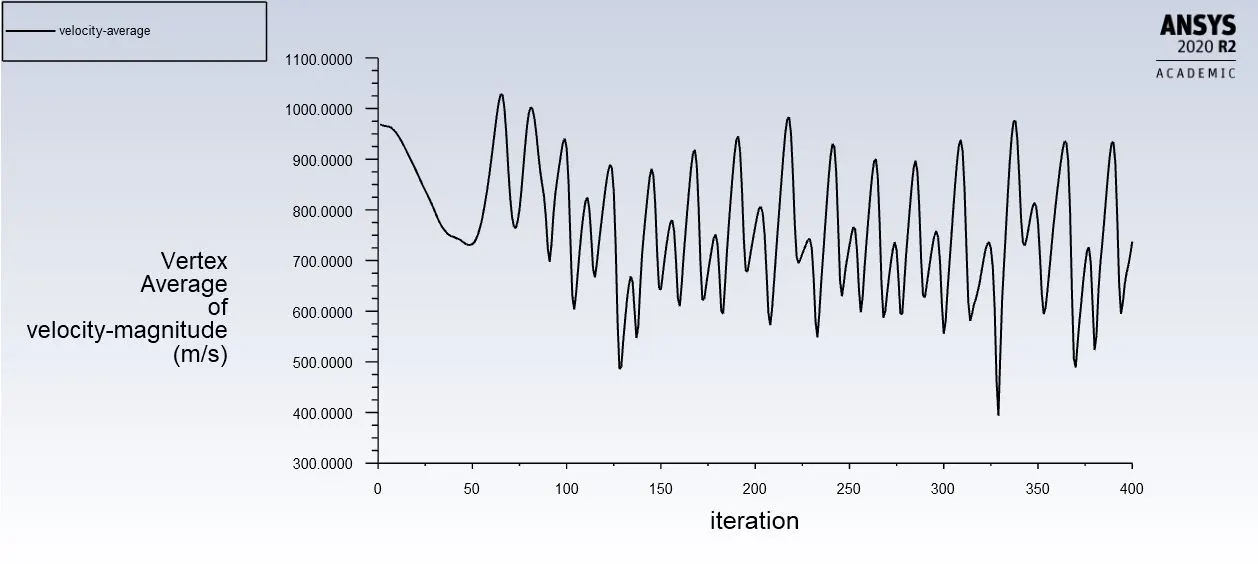
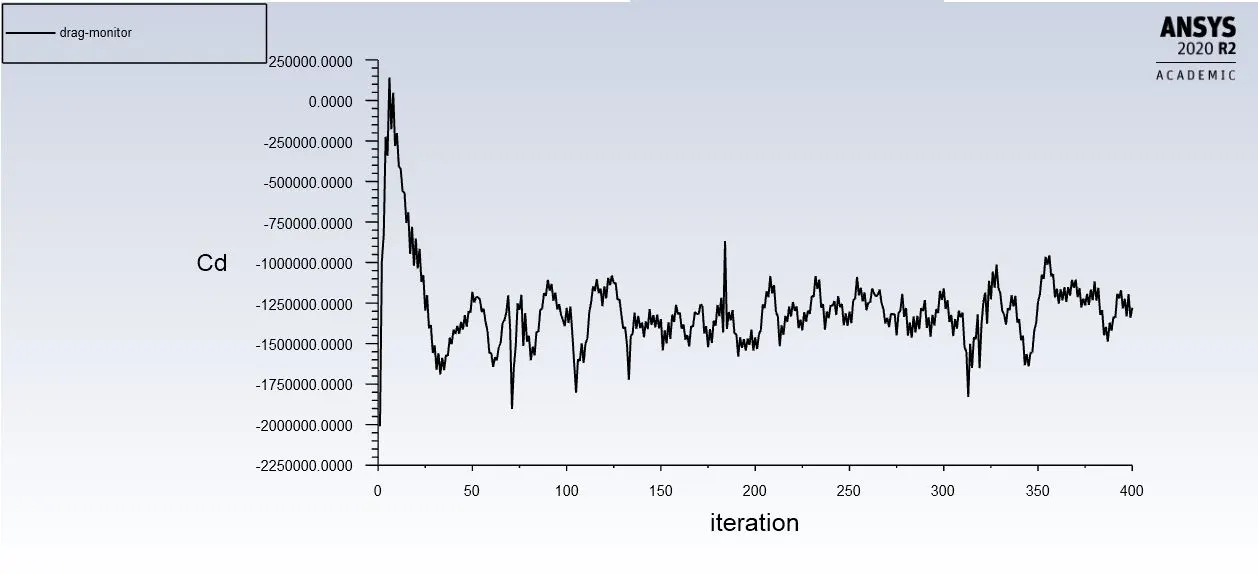
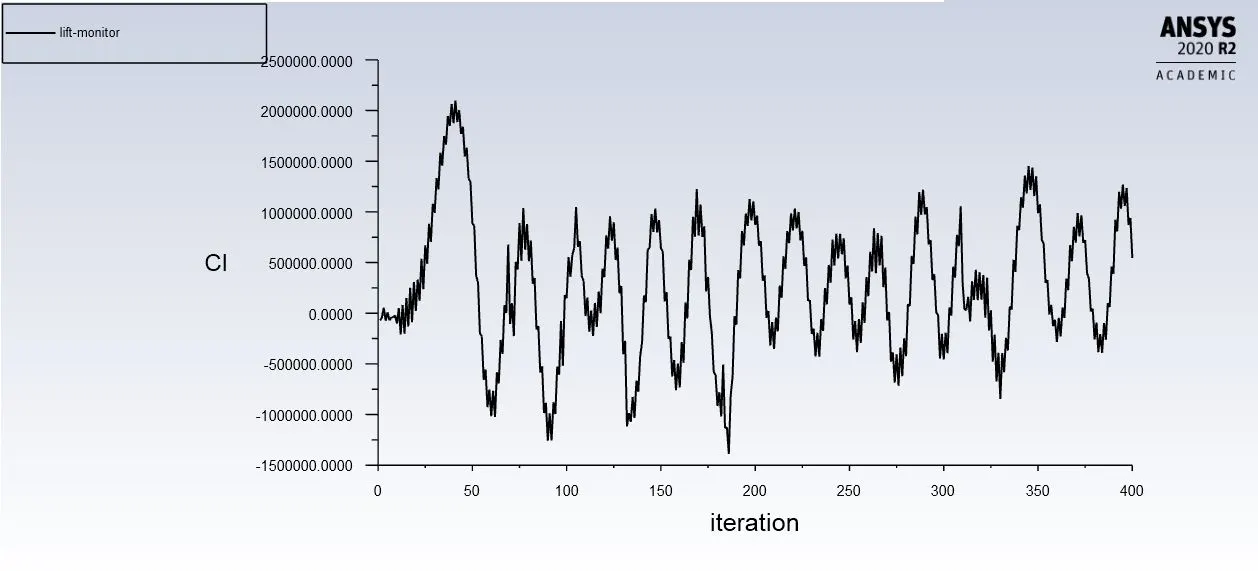
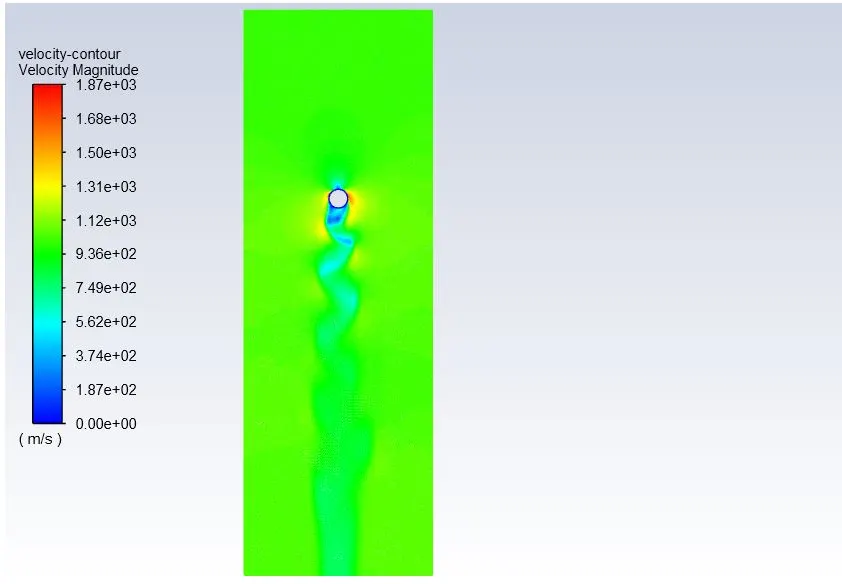
From the CFD prediction of velocity factors it is seen that velocity increases as the reynold number increases. It is infered from the post processing simulation that with increase in velocity, the drag coefficient factor also increases. The drag coefficient is linearly proportional to the square of the velocity, so the drag increases across the surface of the cylinder wall with increase in reynolds no. The effect of von karman street vortex shedding becomes more prominent with increase in reynolds no and is found to be optimal at reynold no 100.
Conclusions
- The von karman effect from the steady state case has accurately capture the flow behaviour across the cylinder wall with wake like formation.
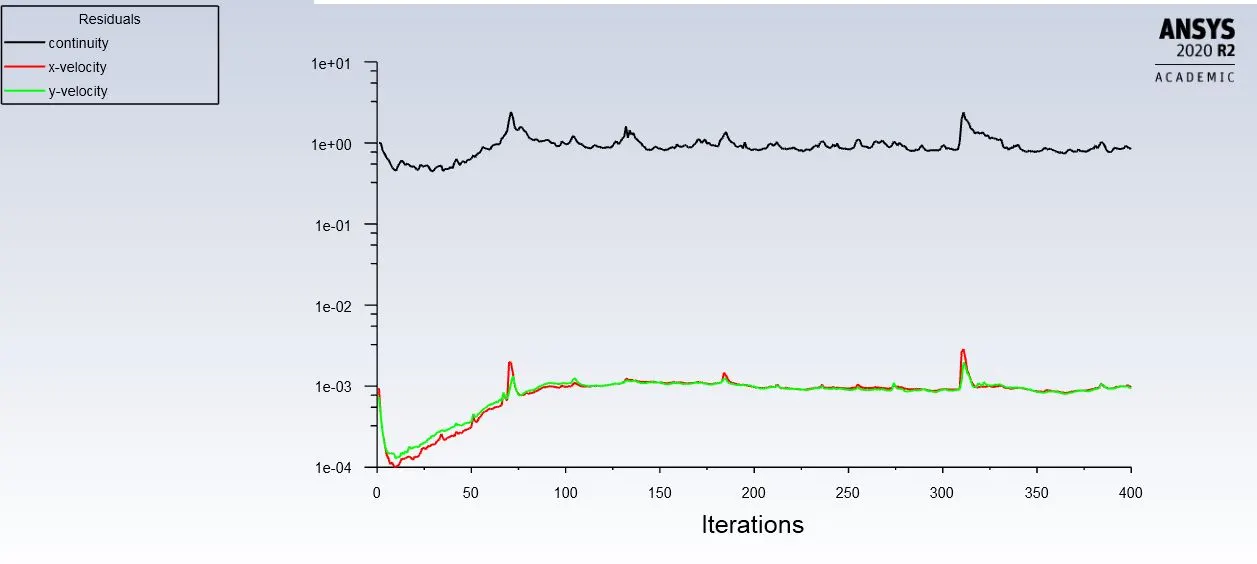
- From the transient case, the flow behaviour is also predicted same as that of steady state condition. Large fluctuation for vertex average of velocity magnitude is observed after 50s. This shows that transient case takes more time in computing the physics of flow behaviour.
- The strouhal no for the steady state and transient state are within the limit (<0.2).
- With change in reynold no it is seen that drag and lift coefficient changes, and makes the vortex shedding more prominent.