Solving second order ODEs using Python
AIM-
SOLVING SECOND ORDER ODE.
OBJECTIVE-
- Write a program in Python that will simulate the pendulum motion.
- write a program that solves the following ODE. This ODE represents the equation of motion of a simple pendulum with damping
THEORY-
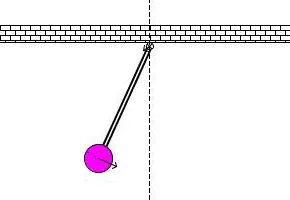
WHAT IS SIMPLE PENDULUM?
A pendulum is a weight suspended from a pivot so that it can swing freely. When a pendulum is displaced sideways from its resting, equilibrium position, it is subject to a restoring force due to gravity that will accelerate it back toward the equilibrium position.
THEORY OF SIMPLE PENDULUM-
A simple pendulum consists of a mass m hanging at the end of a string of length L. The
period of a pendulum or any oscillatory motion is the time required for one complete
cycle, that is, the time to go back and forth once.
GOVERNING EQUATION-
second-order ODE representing the equation of a simple pendulum motion.
In the above equation,
- g = gravity in m/s2,
- L = length of the pendulum in m,
- m = mass of the ball in kg,
- b=damping coefficient.
- To write a program in MatlabOctave that will simulate the pendulum motion, just like the one shown in the start of this challenge.
- We are using,
- L=1 metre,
- m=1 kg,
- b=0.5.
- g=9.81 m/s2.
Python Code-
# Importing libraries
import numpy as np
from scipy.integrate import odeint
import matplotlib.pyplot as plt
import math

# Inputs
b=0.5;
g=9.81;
l=1;
m=1;

# Initial conditions
# First one represents angular displacement
#second one represents angular velocity
theta_0=[0,3]

# Time
t=np.linspace(0,20,200)

def model(theta,t,b,g,l,m):
	theta1=theta[0]
	theta2=theta[1]
	dtheta1_dt=theta2
	dtheta2_dt=-(b/m)*theta2-(g/l)*math.sin(theta1)
	dtheta_dt=[dtheta1_dt,dtheta2_dt]
	return dtheta_dt

# Solving ODE
theta=odeint(model,theta_0,t,args=(b,g,l,m))

# Plotting results
plt.figure()
plt.plot(t,theta[:,0])
plt.plot(t,theta[:,1])
plt.xlabel("Time")
plt.ylabel("angular displacement & angular velocity")
plt.legend(["angular displacement","angular velocity"])
plt.show()

# Creating animation of pendulum
ang_dis=theta[:,0]
# Counter variable
ct=1
for ang in ang_dis:
	# Starting coordinates
	x0=0
	y0=0
	# Ending coordinates
	x1=l*math.sin(ang)
	y1=-l*math.cos(ang)

	# Plotting
	plt.figure()
	plt.plot([-1.5,1.5],[0,0],linewidth=8)
	plt.plot([x0,x1],[y0,y1],linewidth=3)
	plt.plot(x1,y1,'o',markersize=15)
	plt.xlim([-1,1])
	plt.ylim([-1.5,.5])
	filename=str(ct)+".png"
	plt.savefig(filename)
	ct=ct+1
Output-
files stored in a folder-